

Protein Profiling of WERI-RB1 and Etoposide-Resistant WERI-ETOR Reveals New Insights into Topoisomerase Inhibitor Resistance in Retinoblastoma
- PMID: 35409416
- PMCID: PMC9000009
- DOI: 10.3390/ijms23074058
Protein Profiling of WERI-RB1 and Etoposide-Resistant WERI-ETOR Reveals New Insights into Topoisomerase Inhibitor Resistance in Retinoblastoma
Abstract
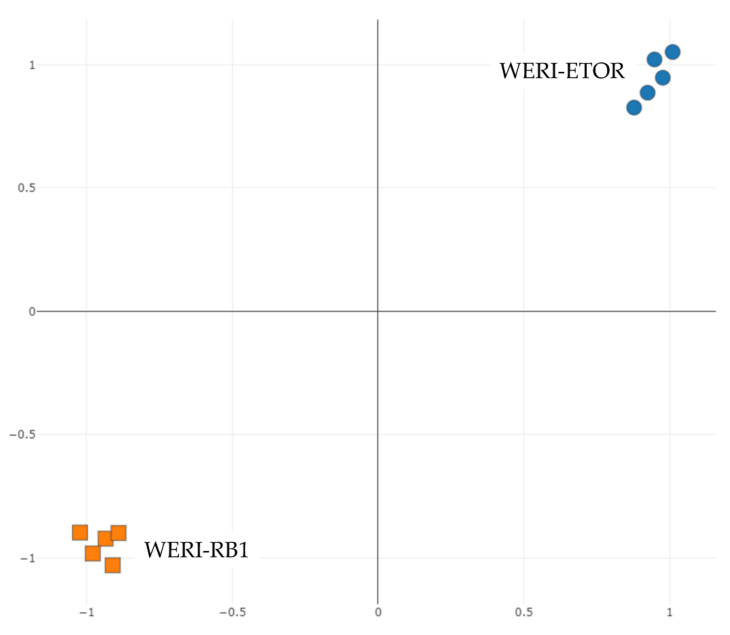
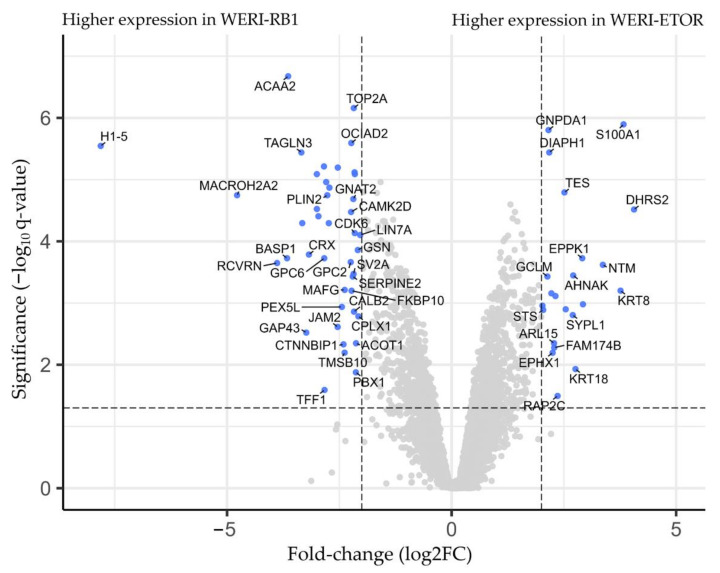
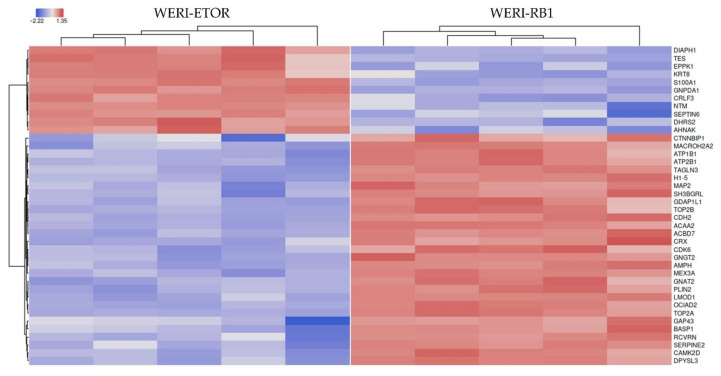
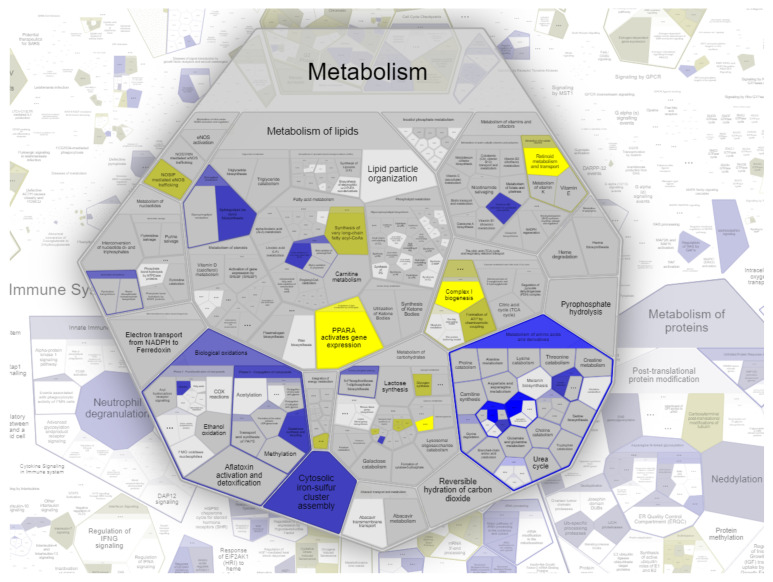
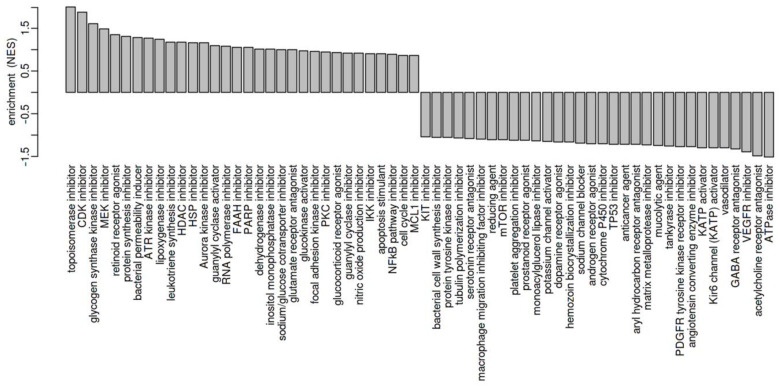
Chemotherapy resistance is one of the reasons for eye loss in patients with retinoblastoma (RB). RB chemotherapy resistance has been studied in different cell culture models, such as WERI-RB1. In addition, chemotherapy-resistant RB subclones, such as the etoposide-resistant WERI-ETOR cell line have been established to improve the understanding of chemotherapy resistance in RB. The objective of this study was to characterize cell line models of an etoposide-sensitive WERI-RB1 and its etoposide-resistant subclone, WERI-ETOR, by proteomic analysis. Subsequently, quantitative proteomics data served for correlation analysis with known drug perturbation profiles. Methodically, WERI-RB1 and WERI-ETOR were cultured, and prepared for quantitative mass spectrometry (MS). This was carried out in a data-independent acquisition (DIA) mode. The raw SWATH (sequential window acquisition of all theoretical mass spectra) files were processed using neural networks in a library-free mode along with machine-learning algorithms. Pathway-enrichment analysis was performed using the REACTOME-pathway resource, and correlated to the molecular signature database (MSigDB) hallmark gene set collections for functional annotation. Furthermore, a drug-connectivity analysis using the L1000 database was carried out to associate the mechanism of action (MOA) for different anticancer reagents to WERI-RB1/WERI-ETOR signatures. A total of 4756 proteins were identified across all samples, showing a distinct clustering between the groups. Of these proteins, 64 were significantly altered (q < 0.05 & log2FC |>2|, 22 higher in WERI-ETOR). Pathway analysis revealed the “retinoid metabolism and transport” pathway as an enriched metabolic pathway in WERI-ETOR cells, while the “sphingolipid de novo biosynthesis” pathway was identified in the WERI-RB1 cell line. In addition, this study revealed similar protein signatures of topoisomerase inhibitors in WERI-ETOR cells as well as ATPase inhibitors, acetylcholine receptor antagonists, and vascular endothelial growth factor receptor (VEGFR) inhibitors in the WERI-RB1 cell line. In this study, WERI-RB1 and WERI-ETOR were analyzed as a cell line model for chemotherapy resistance in RB using data-independent MS. Analysis of the global proteome identified activation of “sphingolipid de novo biosynthesis” in WERI-RB1, and revealed future potential treatment options for etoposide resistance in RB.
Keywords: WERI-ETOR; WERI-RB1; chemotherapy resistance; mass spectrometry; retinoblastoma.
Conflict of interest statement
The authors declare no conflict of interest. T.G. is a member of the BigOmics Analytics Advisory Board.
Figures
References
MeSH terms
Substances
Grants and funding
LinkOut - more resources
Full Text Sources
Molecular Biology Databases
Research Materials
Miscellaneous
