. 2022 Mar 31;19(7):4134.
doi: 10.3390/ijerph19074134.

Food By-Product Valorization by Using Plant-Based Coagulants Combined with AOPs for Agro-Industrial Wastewater Treatment

Affiliations

Food By-Product Valorization by Using Plant-Based Coagulants Combined with AOPs for Agro-Industrial Wastewater Treatment

Rita Beltrão Martins et al. Int J Environ Res Public Health. .

Abstract

Re-using and adding value to by-products is one of the current focuses of the agri-food industry, following the Sustainable Development Goals of United Nations. In this work, the by-products of four plants, namely chestnut burr, acorn peel, olive leaf, and grape stem were used as coagulants to treat elderberry wastewater (EW), a problematic liquid effluent. EW pre-treatment using these natural coagulants showed promising results after pH and coagulant dosage optimization. However, the decrease in total organic carbon (TOC) was not significant, due to the addition of the plant-based natural coagulants which contain carbon content. After this pre-treatment, the photo-Fenton advanced oxidation process was selected, after preliminary assays, to improve the global performance of the EW treatment. Photo-Fenton was also optimized for the parameters of pH, H2O2, Fe2+, and irradiance power, and the best conditions were applied to the EW treatment. Under the best operational conditions defined in the parametric study, the combined results of coagulation-flocculation-decantation (CFD) and photo-Fenton for chestnut burr, acorn peel, olive leaf, and grape stem were, respectively, 90.2, 89.5, 91.5, and 88.7% for TOC removal; 88.7, 82.0, 90.2 and 93.1%, respectively, for turbidity removal; and finally, 40.6, 42.2, 45.3, and 39.1%, respectively, for TSS removal. As a final remark, it is possible to suggest that plant-based coagulants, combined with photo-Fenton, can be a promising strategy for EW treatment that simultaneously enables valorization by adding value back to food by-products.

Keywords: by-products reuse; circular economy; coagulation–flocculation–decantation; photo-Fenton; plant-based coagulants; wastewater treatment.


Conflict of interest statement

The authors declare no conflict of interest.

Figures

Figure 1
Figure 1
By-products used as plant-based coagulants and their respective powders: (A)—chestnut burr, (B)—acorn peel, (C)—olive leaf, (D)—grape stem.
Figure 2
Figure 2
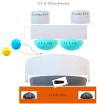
Photo-Fenton set-up schematic representation.
Figure 3
Figure 3
FTIR spectra of the four plant-based coagulants.
Figure 4
Figure 4
SEM images of each plant-based coagulant identified in the figure (A)—60× magnification and (B)—100× magnification.
Figure 5
Figure 5
Progress of (a) turbidity and (b) TSS removal, testing different pH values (3–9). Experimental conditions: 1.0 g L−1 for each coagulant, T = 25 °C, fast mix 150 rpm for 3 min, slow mix 20 rpm for 20 min, sedimentation time of 12 h ([TOC]0 = 144 mg C L−1, turbidity0 = 16 NTU, TSS0 = 64 mg L−1). Different letters between the graphic bars mean that values are statistically different (p < 0.05). When bars have two letters (ab), it means the values are not statistically different from a and from b.
Figure 6
Figure 6
Progress of (a) turbidity, (b) TSS and (c) TOC removal along the CFD process, testing different coagulant dosage (0.1, 0.5, 1.0, 2.0 g L−1). Experiment conditions: pH = 3 (for plant-based coagulants), pH = 5 (for ferrous sulfate), T = 25 °C, fast mix 150 rpm for 3 min, slow mix 20 rpm for 20 min, sedimentation time of 12 h ([TOC]0 = 144 mg C L−1, turbidity0 = 16 NTU, TSS0 = 64 mg L−1. Different letters between the graphic bars mean that values are statistically different (p < 0.05).
Figure 7
Figure 7
Chemical degradability of EW (TOC % removal) under different experimental conditions: [H2O2] = 38.8 mM, [Fe2+] = 1.0 mM, pH = 3.0, agitation = 350 rpm, T = 25 °C, radiation = UV-A, IUV = 32.7 Wm−2, t = 90 min.
Figure 8
Figure 8
Progress of TOC percentage removal at different pH (3–7) in the UV-A-Fenton process. Experimental conditions: [H2O2] = 38.8 mM, [Fe2+] = 1.0 mM, agitation = 350 rpm, T = 25 °C, radiation = UV-A, IUV = 32.7 Wm−2, t = 90 min. Blank non-catalytic experiments (UV-A/H2O2 and UV-A without H2O2) are also represented as a reference.
Figure 9
Figure 9
Progress of TOC percentage removal at different H2O2 concentrations (9.7–77.6 mM) in the UV-A-Fenton process. Experimental conditions: [Fe2+] = 1.0 mM, pH = 3.0, agitation = 350 rpm, T = 25 °C, radiation = UV-A, IUV = 32.7 Wm−2, and t = 90 min. Blank non-catalytic experiments (UV-A/H2O2 and UV-A without H2O2) are also represented as a reference.
Figure 10
Figure 10
Progress of TOC percentage removal at different Fe2+ concentrations (0.5–5.0 mM) in the UV-A-Fenton process. Experimental conditions: [H2O2] = 38.8 mM, pH = 3.0, agitation = 350 rpm, T = 25 °C, radiation= UV-A, IUV = 32.7 Wm−2, t = 90 min. Blank non-catalytic experiments (UV-A/H2O2 and UV-A without H2O2) are also represented as a reference.
Figure 11
Figure 11
Progress of TOC percentage removal at different UV-A radiation intensities (0.0–32.7 W/m2) in the UV-A-Fenton process. Experimental conditions: [H2O2] = 38.8 mM, [Fe2+] = 1.0 mM, pH = 3.0, agitation = 350 rpm, T = 25 °C, t = 90 min. Blank non-catalytic experiments (UV-A/H2O2 and UV-A without H2O2) are also represented as a reference.
Figure 12
Figure 12
Progress of TOC percentage removal after CFD (with plant-based coagulants chestnut burr, acorn peel, olive leaf, and grape stem) and the UV-A-Fenton processes with the following experimental conditions: [H2O2] = 38.8 mM, [Fe2+] = 1.0 mM, pH = 3.0, agitation = 350 rpm, T = 25 °C, t = 90 min. Blank without coagulant and blank non-catalytic experiment (UV-A/H2O2) are also represented as a reference.
Figure 13
Figure 13
Progress of (a) turbidity, (b) TSS, and (c) total polyphenols percentage removal as a result of CFD process (with plant-based coagulants) in comparison with UV-A-Fenton under the following experimental conditions: [H2O2] = 38.8 mM, [Fe2+] = 1.0 mM, pH = 3.0, agitation = 350 rpm, T = 25 °C, t = 90 min. Different letters between the graphic bars mean values are statistically different (p < 0.05).

Similar articles

Cited by

References

    1. Esposito B., Sessa M.R., Sica D., Malandrino O. Towards circular economy in the agri-food sector. A systematic literature review. Sustainability. 2020;12:7401. doi: 10.3390/su12187401. - DOI
    1. United Nations Sustainable Development Goals. [(accessed on 6 December 2021)]. Available online: https://www.un.org/sustainabledevelopment/
    1. Ang W.L., Mohammad A.W. State of the art and sustainability of natural coagulants in water and wastewater treatment. J. Clean. Prod. 2020;262:121267. doi: 10.1016/j.jclepro.2020.121267. - DOI
    1. Tsani S., Koundouri P., Akinsete E. Resource management and sustainable development: A review of the European water policies in accordance with the United Nations’ Sustainable Development Goals. Environ. Sci. Policy. 2020;114:570–579. doi: 10.1016/j.envsci.2020.09.008. - DOI
    1. Peres J.A., de Heredia J.B., Domınguez J.R. Integrated Fenton’s reagent—coagulation/flocculation process for the treatment of cork processing wastewaters. J. Hazard. Mater. 2004;107:115–121. doi: 10.1016/j.jhazmat.2003.09.012. - DOI - PubMed

Publication types