

Profit-Influencing Factors in Orthopedic Surgery: An Analysis of Costs and Reimbursements
- PMID: 35410007
- PMCID: PMC8998626
- DOI: 10.3390/ijerph19074325
Profit-Influencing Factors in Orthopedic Surgery: An Analysis of Costs and Reimbursements
Abstract
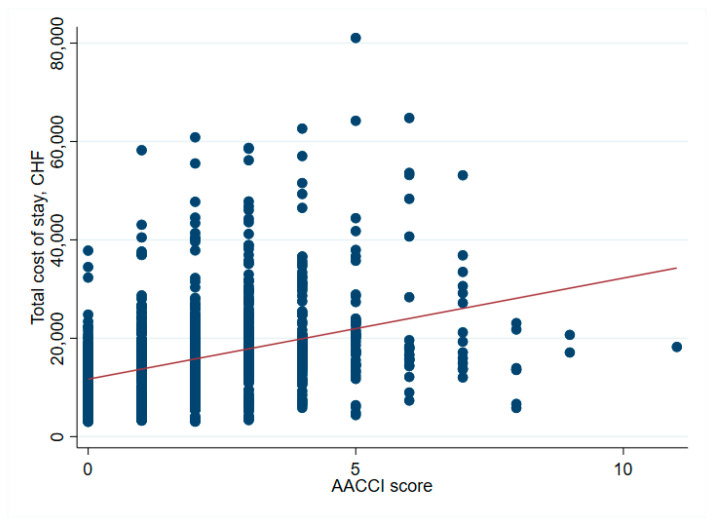
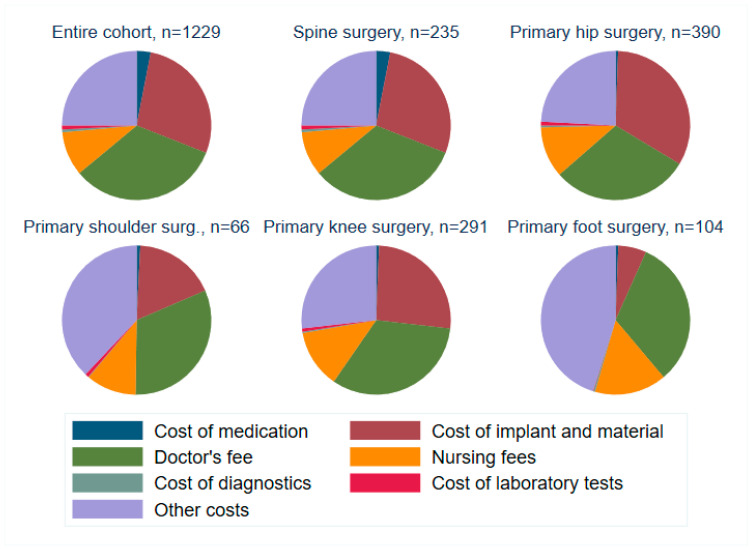
The aging population and the associated demand for orthopedic surgeries are increasing health costs. Although the Diagnostic Related Groups (DRG) system was introduced to offer incentives for hospitals, concerns remain that reimbursements for older and frail patients do not cover all hospital expenses. We investigated further: (1) Does age influence net financial results in orthopedic surgery? (2) Are there patient or surgical factors that influence results? This retrospective, monocentric study compares costs and reimbursements for orthopedic patients in a tertiary care hospital in Switzerland between 2015 and 2017. The data of 1230 patients were analyzed. Overall, the net results for the hospital were positive, despite 19.5% of patients being treated at a loss. We did not find any correlation between age and profitability (p = 0.61). Patient-related factors associated with financial losses were female sex (p < 0.001) and diabetes (p = 0.013). Patients free of serious comorbidities (p = 0.012) or with a higher cost weight (p < 0.001) were more often profitable. A longer length of stay was associated with higher losses (p < 0.001). This is the first study to address the Swiss DRG reimbursement system in a broad orthopedic population, while also analyzing specific patient and surgical factors. Overall, the reimbursement system is fair, but could better account for certain interventions.
Keywords: Swiss DRG; cost-benefit profitability analysis; costing; finance; net financial result; orthopedic surgery; patient health data; profit.
Conflict of interest statement
The authors declare no conflict of interest.
Figures


Similar articles
-
DRGs, orthopedic surgery, and age at an academic medical center.Orthopedics. 1988 Dec;11(12):1645-51. doi: 10.3928/0147-7447-19881201-06. Orthopedics. 1988. PMID: 3148129
-
Current hospital costs and medicare reimbursement for endovascular abdominal aortic aneurysm repair.J Vasc Surg. 2003 Feb;37(2):272-9. doi: 10.1067/mva.2003.118. J Vasc Surg. 2003. PMID: 12563195
-
Refining risk adjustment for bundled payment models in cervical fusions-an analysis of Medicare beneficiaries.Spine J. 2019 Oct;19(10):1706-1713. doi: 10.1016/j.spinee.2019.06.009. Epub 2019 Jun 18. Spine J. 2019. PMID: 31226386
-
The future of medical reimbursement for orthopedic surgery in Japan from the viewpoint of the health economy.J Orthop Sci. 2016 May;21(3):273-81. doi: 10.1016/j.jos.2016.02.007. Epub 2016 Mar 25. J Orthop Sci. 2016. PMID: 27020176 Review.
-
[Regional anaesthesia as advantage in competition between hospitals. Strategic market analysis].Anaesthesist. 2009 May;58(5):459-68. doi: 10.1007/s00101-009-1539-7. Anaesthesist. 2009. PMID: 19384453 Review. German.
Cited by
-
Recent Advancements in Metallic Drug-Eluting Implants.Pharmaceutics. 2023 Jan 9;15(1):223. doi: 10.3390/pharmaceutics15010223. Pharmaceutics. 2023. PMID: 36678852 Free PMC article. Review.
-
The impact of allergies on patient-reported outcomes after total hip and knee arthroplasty: a systematic review and meta-analysis.Arch Orthop Trauma Surg. 2024 Aug;144(8):3755-3765. doi: 10.1007/s00402-024-05433-z. Epub 2024 Jul 15. Arch Orthop Trauma Surg. 2024. PMID: 39008079
-
A Decade's Perspective on the Orthopedic Workforce in Saudi Arabia.Cureus. 2023 Apr 11;15(4):e37426. doi: 10.7759/cureus.37426. eCollection 2023 Apr. Cureus. 2023. PMID: 37182036 Free PMC article.
References
-
- Bundesamt für Statistik BFS . Szenarien zur Bevölkerungsentwicklung der Schweiz 2010–2060. Bundesamt für Statistik BFS; Neuchatel, Switzerland: 2010. p. 84.
Publication types
MeSH terms
LinkOut - more resources
Full Text Sources
