. 2022 Apr 11;23(1):291.
doi: 10.1186/s12864-022-08450-7.

Inferring mammalian tissue-specific regulatory conservation by predicting tissue-specific differences in open chromatin

Affiliations

Inferring mammalian tissue-specific regulatory conservation by predicting tissue-specific differences in open chromatin

Irene M Kaplow et al. BMC Genomics. .

Abstract

Background: Evolutionary conservation is an invaluable tool for inferring functional significance in the genome, including regions that are crucial across many species and those that have undergone convergent evolution. Computational methods to test for sequence conservation are dominated by algorithms that examine the ability of one or more nucleotides to align across large evolutionary distances. While these nucleotide alignment-based approaches have proven powerful for protein-coding genes and some non-coding elements, they fail to capture conservation of many enhancers, distal regulatory elements that control spatial and temporal patterns of gene expression. The function of enhancers is governed by a complex, often tissue- and cell type-specific code that links combinations of transcription factor binding sites and other regulation-related sequence patterns to regulatory activity. Thus, function of orthologous enhancer regions can be conserved across large evolutionary distances, even when nucleotide turnover is high.

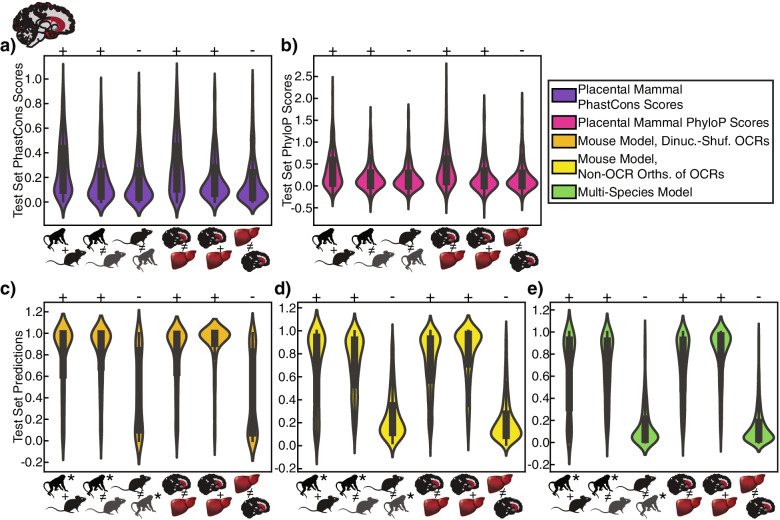
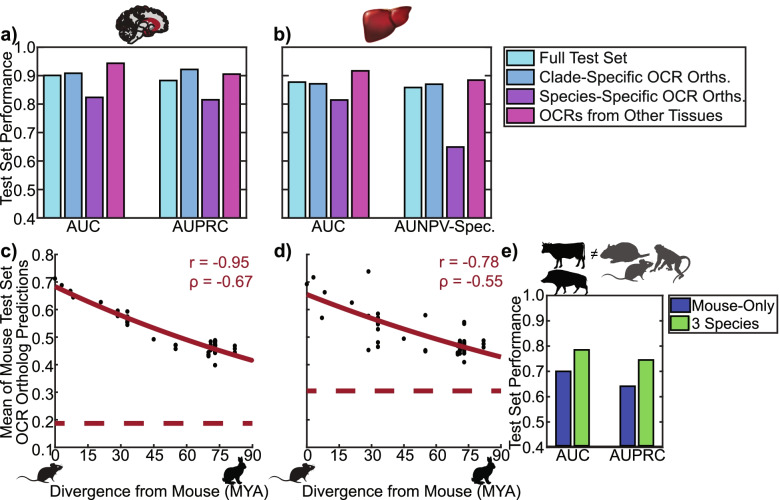
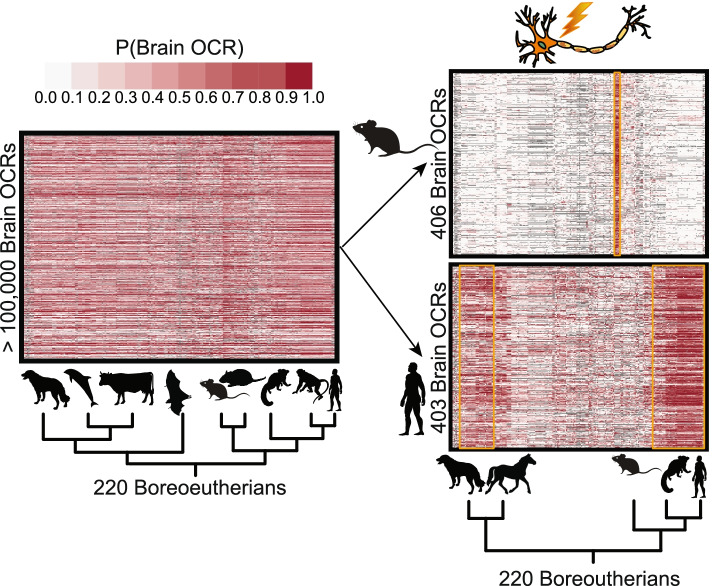
Results: We present a new machine learning-based approach for evaluating enhancer conservation that leverages the combinatorial sequence code of enhancer activity rather than relying on the alignment of individual nucleotides. We first train a convolutional neural network model that can predict tissue-specific open chromatin, a proxy for enhancer activity, across mammals. Next, we apply that model to distinguish instances where the genome sequence would predict conserved function versus a loss of regulatory activity in that tissue. We present criteria for systematically evaluating model performance for this task and use them to demonstrate that our models accurately predict tissue-specific conservation and divergence in open chromatin between primate and rodent species, vastly out-performing leading nucleotide alignment-based approaches. We then apply our models to predict open chromatin at orthologs of brain and liver open chromatin regions across hundreds of mammals and find that brain enhancers associated with neuron activity have a stronger tendency than the general population to have predicted lineage-specific open chromatin.

Conclusion: The framework presented here provides a mechanism to annotate tissue-specific regulatory function across hundreds of genomes and to study enhancer evolution using predicted regulatory differences rather than nucleotide-level conservation measurements.

Keywords: Enhancers; Gene expression evolution; Machine learning; Open chromatin prediction.


Conflict of interest statement

The authors declare that they have no competing interests.

Figures

Fig. 1
Fig. 1
OCR Ortholog Open Chromatin Status Prediction Framework Overview. a We trained a convolutional neural network (CNN) for predicting brain open chromatin using sequences underlying brain open chromatin region (OCR) orthologs in a small number of species and used the CNN to predict brain OCR ortholog open chromatin status across the species in the Zoonomia Consortium. Specifically, we used the sequences underlying the orthologs for which we have brain open chromatin data to train a CNN for predicting open chromatin. Then, we used the CNN to predict the probability of brain open chromatin for all brain OCR orthologs; predictions are illustrated on the right. Animals for which we do not have open chromatin data are in dark gray instead of black to indicate that their brain open chromatin is imputed. While we cannot evaluate the accuracy of most of our predictions, obtaining open chromatin data from most tissues in most species is infeasible, so predictions might be the best OCR annotations that we can obtain. b To demonstrate that our models can accurately predict whether sequence differences between species are associated with open chromatin differences, in addition to the evaluations described in previous work [57], we evaluated our performance on species-specific open chromatin for a species not used in model training and clade-specific open and closed chromatin for clades not used in model training. Since such regions often comprise a minority of OCR orthologs, models could obtain good overall performance while obtaining poor performance on such regions. We also evaluated our performance on tissue-specific open and closed chromatin for a tissue not used in model training, where we expect models to predict 0 if model learns sequence signatures related to the tissue used in training. c Full mouse test set and lineage-specific OCR accuracy evaluations for mouse sequence-only brain model, illustrating that, even for the best of these models, performance on clade-specific and species-specific OCRs and non-OCRs for clades and species not used in training is not as good as performance on the full test set. Animal silhouettes were obtained from PhyloPic [65].
Fig. 2
Fig. 2
Violin Plots for Brain Model Lineage-Specific and Tissue-Specific OCR Accuracy Evaluation in Macaque. Comparison of a PhastCons [13] and b PhyloP [14] scores to c-e three different machine learning models’ predictions for brain OCRs with conserved open chromatin across mouse and macaque, macaque brain OCRs whose mouse orthologs are closed in brain, macaque brain non-OCRs whose mouse orthologs are open in brain, macaque brain OCRs that are closed in liver, macaque brain OCRs that are open in liver (centered on brain peak summits), and macaque liver OCRs that are closed in brain. + ’s indicate that values should be large, and -‘s indicate that values should be small. Conservation scores were generated from the mm10-based placental mammals alignment [12, 73] and averaged over 500 bp centered on peak summits, where mouse peak summits were used for OCRs conserved between mouse and macaque and for OCRs in mouse whose macaque orthologs are closed, and mouse orthologs of macaque peak summits were used for other evaluations. All machine learning model predictions were made using macaque sequences. The macaque sequences for OCRs conserved between mouse and macaque and for OCRs in mouse whose macaque orthologs are closed were centered on macaque orthologs of mouse peak summits, and macaque peak summits were used for other evaluations. Note that the models in c and d were trained on only mouse sequences, demonstrating their performance in a species not used in training. Animal silhouettes were obtained from PhyloPic [65]. *’s indicate the species from which sequences were obtained for making predictions. Dinuc.-shuf. stands for dinucleotide-shuffled, and orths. stands for orthologs
Fig. 3
Fig. 3
Multi-Species Model Performance. a Performance of multi-species brain model on MultiBr, MultiBrClade, MultiBrSpecies, and MultiBrVsLv (Supplemental Tables 20–21). b Performance of multi-species liver model on MultiLv, MultiLvClade, MultiLvSpecies, and MultiLvVsBr (Supplemental Tables 20–21). We reported area under the negative predictive value (NPV)-specificity (Spec.) curve instead of the AUPRC because these evaluation sets have more positives than negatives. c Divergence from mouse versus mean multi-species brain model predictions across mouse test chromosome brain OCR orthologs in Glires. d Divergence from mouse versus mean multi-species liver model predictions across mouse test chromosome liver OCR orthologs in Glires. e Performance of mouse-only liver model versus multi-species liver model on MultiLvLauras (Supplemental Tables 20–21). Animal silhouettes were obtained from PhyloPic [65]. AUC stands for area under the receiver operating characteristic curve, AUPRC stands for area under the precision-recall curve, and MYA stands for millions of years ago. The red curves are the best fit exponential function of the form y = aebx. The red dotted lines are the average prediction across test set negatives.
Fig. 4
Fig. 4
Examples of Mean Conservation Score and Open Chromatin Status Prediction versus Open Chromatin Conservation. a 7-week-old mouse cortex and striatum and macaque orofacial motor cortex (“Cortex”) and putamen (“Striatum”) open chromatin signal for a mouse brain OCR that is 50,328 bp away from the Stx16 transcription start site (TSS). Experimentally identified and predicted brain open chromatin statuses are conserved even though mean mouse PhastCons score is low. b 7-week-old mouse cortex and striatum and macaque orofacial motor cortex (“Cortex”) and putamen (“Striatum”) open chromatin signal for a mouse brain OCR that is 144,474 bp away from the Lnpk TSS. Experimentally identified and predicted brain open chromatin statuses are not conserved even though mean mouse PhastCons score is high. c Our mouse liver open chromatin, mouse liver H3K27ac ChIP-seq, and macaque liver open chromatin signal for a mouse liver OCR that is 24,814 bp away from the Rxra TSS. Experimentally identified and predicted liver open chromatin statuses are conserved even though mean mouse PhastCons score is low. d Our mouse liver open chromatin, mouse liver H3K27ac ChIP-seq, and macaque liver open chromatin signal for a mouse liver OCR that is 154,404 bp away from the Fn1 TSS. Experimentally identified and predicted liver open chromatin statuses are not conserved even though mean mouse PhastCons score is high. Animal silhouettes were obtained from PhyloPic [65]. Regions are mouse cortex or liver open chromatin peak summits ± 250 bp and their macaque orthologs, signals are from pooled reads across biological replicates, and liver H3K27ac ChIP-seq data was obtained from E-MTAB-2633 [40].
Fig. 5
Fig. 5
Examples of Brain OCR Clusters with Predicted Lineage-Specific Open Chromatin Associated with Neuron Activity. We clustered the brain OCRs, where the features were the brain predictions in each Boreoeutheria species from Zoonomia, and then identified clusters whose regions had significant overlap with regions associated with mouse neuron firing and human neuron activity. Mouse neuron firing enhancers had significant overlap with a predicted Murinae-specific OCR cluster (cluster 43), and human neuron activity enhancers had significant overlap with a predicted Euarchonta and Carnivora-specific non-OCR cluster (cluster 74). Animal silhouettes were obtained from PhyloPic [65]

References

    1. Alföldi J, Lindblad-Toh K. Comparative genomics as a tool to understand evolution and disease. Genome Res. 2013;23(7):1063–1068. doi: 10.1101/gr.157503.113. - DOI - PMC - PubMed
    1. Bulik-Sullivan BK, Loh PR, Finucane HK, Ripke S, Yang J, Schizophrenia Working Group of the Psychiatric Genomics Consortium, Patterson N, Daly MJ, Price AL, Neale BM. LD Score regression distinguishes confounding from polygenicity in genome-wide association studies. Nat Genet. 2015;47(3):291–5. - PMC - PubMed
    1. Pollard KS, Salama SR, Lambert N, Lambot MA, Coppens S, Pedersen JS, Katzman S, King B, Onodera C, Siepel A, et al. An RNA gene expressed during cortical development evolved rapidly in humans. Nature. 2006;443(7108):167–172. doi: 10.1038/nature05113. - DOI - PubMed
    1. Zoonomia Consortium A comparative genomics multitool for scientific discovery and conservation. Nature. 2020;587(7833):240–245. doi: 10.1038/s41586-020-2876-6. - DOI - PMC - PubMed
    1. Kvon EZ, Kamneva OK, Melo US, Barozzi I, Osterwalder M, Mannion BJ, Tissieres V, Pickle CS, Plajzer-Frick I, Lee EA, et al. Progressive Loss of Function in a Limb Enhancer during Snake Evolution. Cell. 2016;167(3):633–642.e611. doi: 10.1016/j.cell.2016.09.028. - DOI - PMC - PubMed