. 2022 Apr 11;23(1):90.
doi: 10.1186/s12931-022-02011-y.

Distributions and trends of the global burden of COPD attributable to risk factors by SDI, age, and sex from 1990 to 2019: a systematic analysis of GBD 2019 data

Affiliations

Distributions and trends of the global burden of COPD attributable to risk factors by SDI, age, and sex from 1990 to 2019: a systematic analysis of GBD 2019 data

Jiahua Zou et al. Respir Res. .

Abstract

Background: Global distributions and trends of the risk-attributable burdens of chronic obstructive pulmonary disease (COPD) have rarely been systematically explored. To guide the formulation of targeted and accurate strategies for the management of COPD, we analyzed COPD burdens attributable to known risk factors.

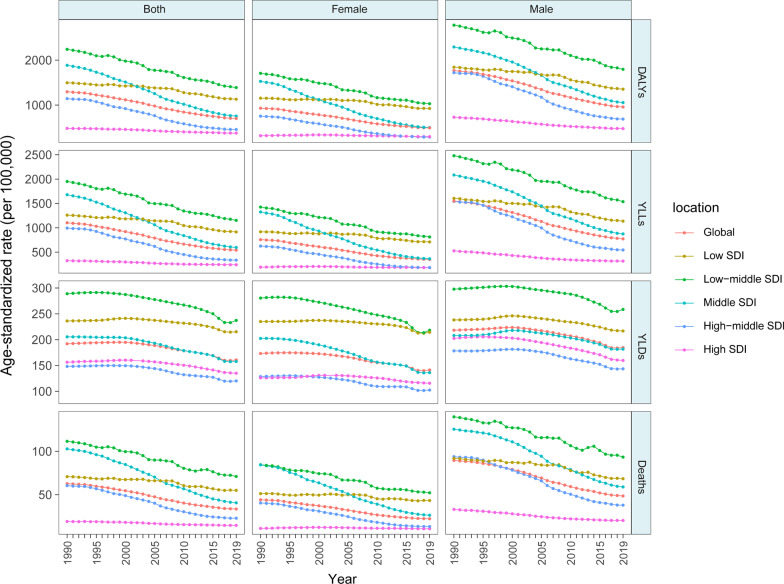
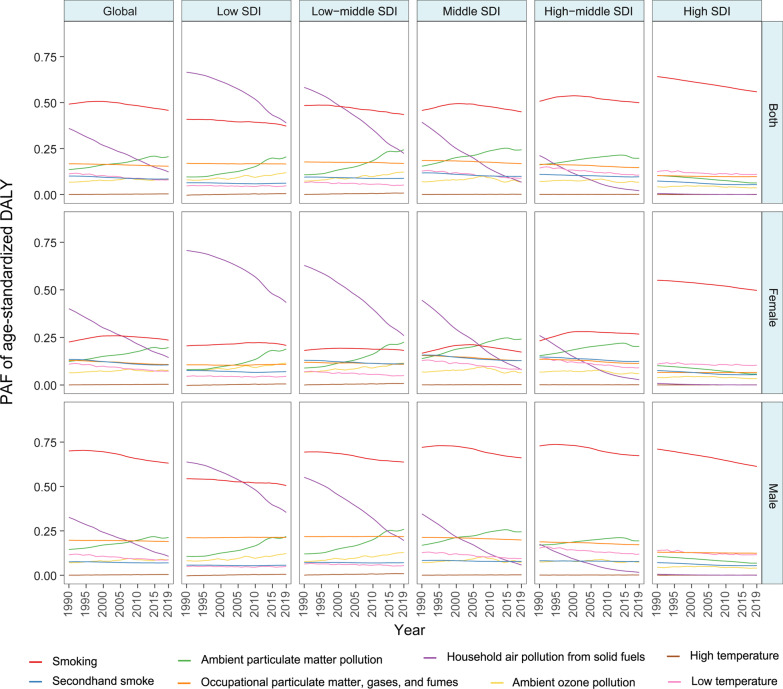
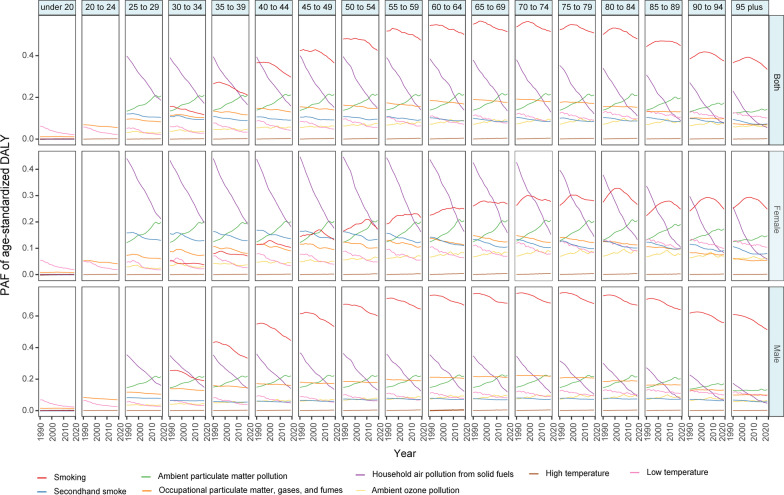
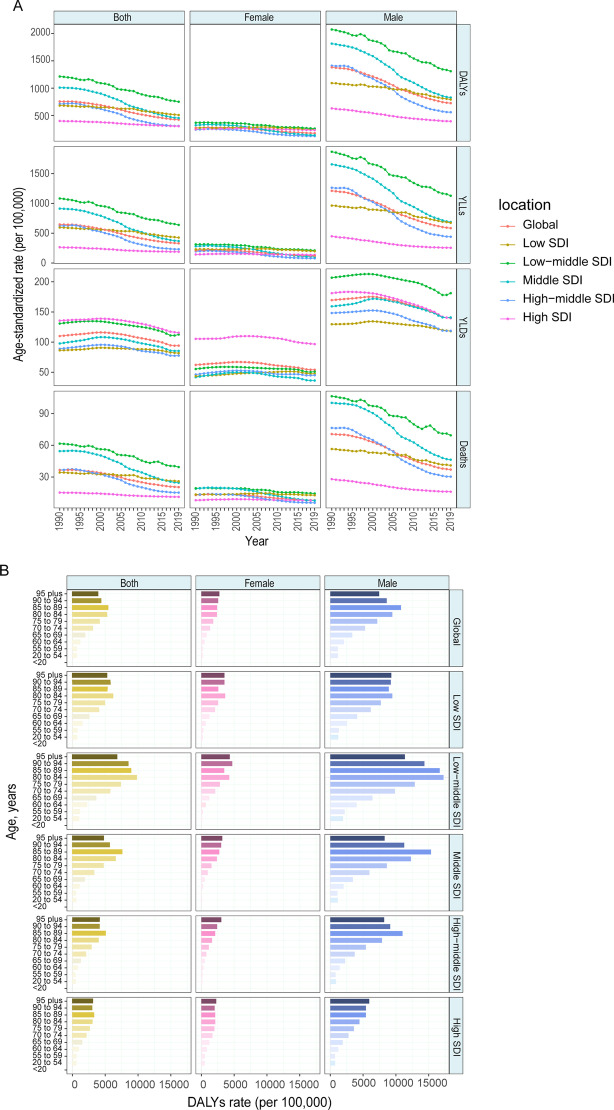
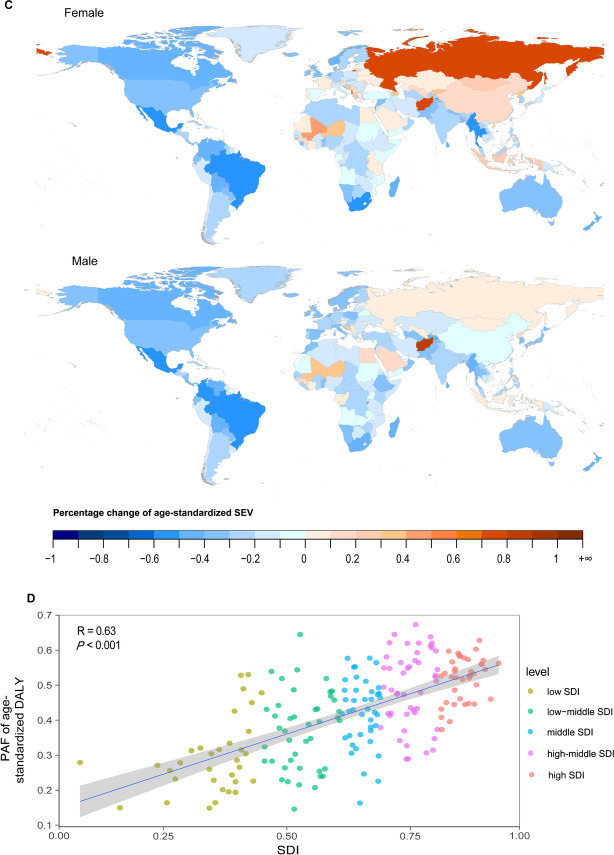
Methods: Using detailed COPD data from the Global Burden of Disease study 2019, we analyzed disability-adjusted life years (DALYs), years lived with disability (YLDs), years of life lost (YLLs), and deaths attributable to each risk factor from 1990 to 2019. Additionally, we calculated estimated annual percentage changes (EAPCs) during the study period. The population attributable fraction (PAF) and summary exposure value (SEV) of each risk factor are also presented.

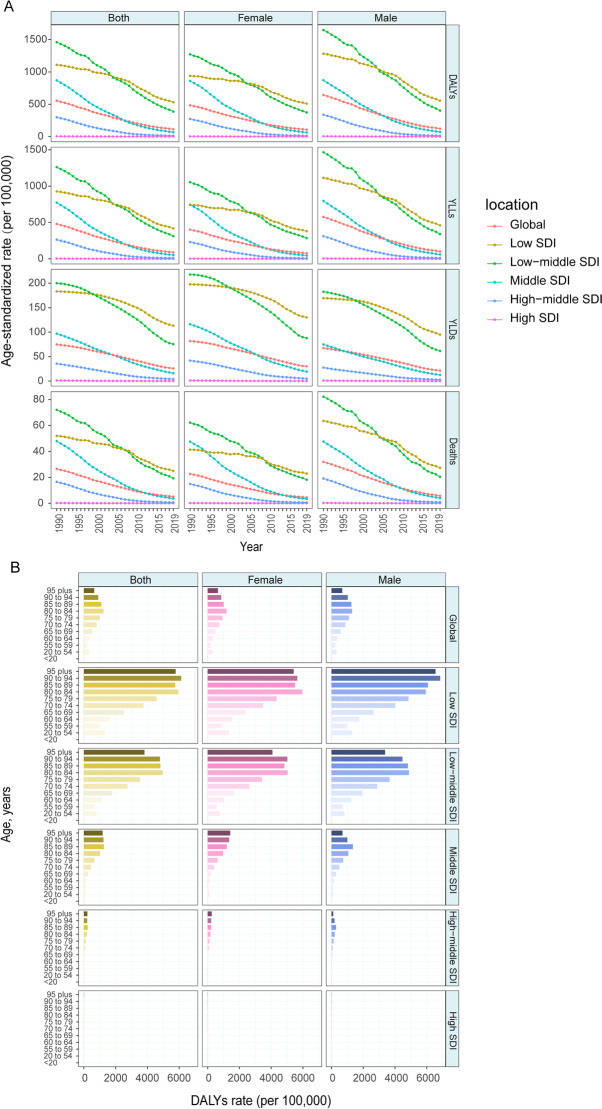
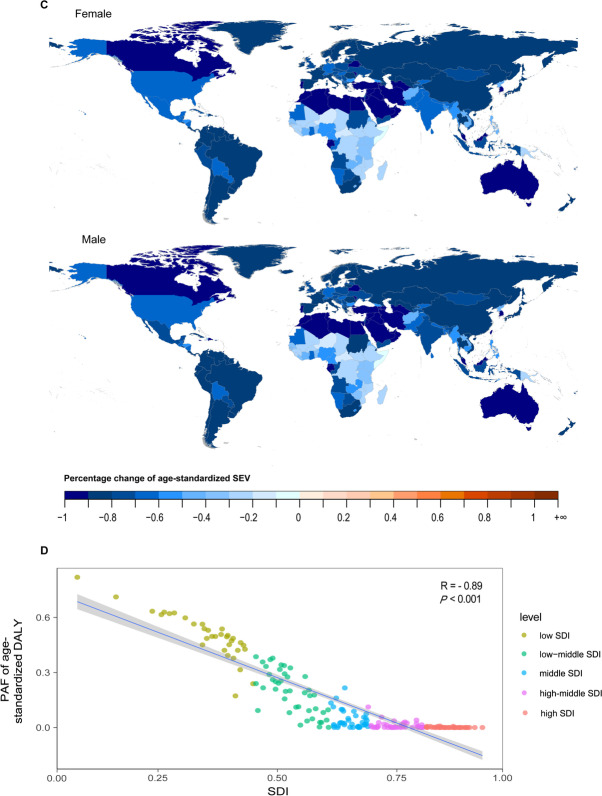
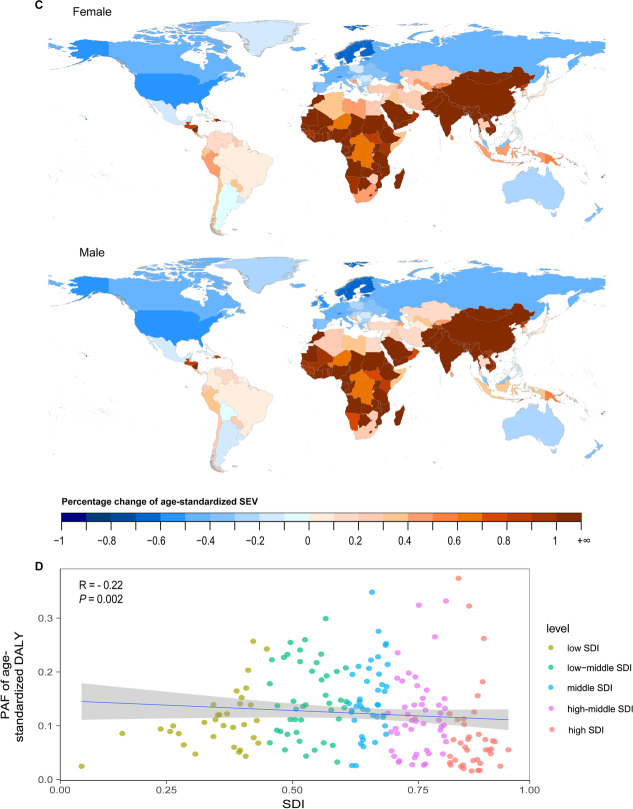
Results: From 1990 to 2019, the age-standardized DALY and death rates of COPD attributable to smoking and household air pollution, occupational particles, secondhand smoke, and low temperature presented consistently declining trends in almost all socio-demographic index (SDI) regions. However, the decline in YLD was not as dramatic as that of the death rate. In contrast, the COPD burden attributable to ambient particulate matter, ozone, and high temperature exposure showed undesirable increasing trends in the low- and low-middle-SDI regions. In addition, the age-standardized DALY and death rates attributable to each risk factor except household air pollution and low temperature were the highest in the low-middle-SDI region. In 2019, the COPD burden attributable to smoking ambient particulate matter, ozone, occupational particles, low and high temperature was obviously greater in males than in females. Meanwhile, the most important risk factors for female varied across regions (low- and low-middle-SDI regions: household air pollution; middle-SDI region: ambient particles; high-middle- and high-SDI region: smoking).

Conclusions: Increasing trends of COPD burden attributable to ambient particulate matter, ozone, and high temperature exposure in the low-middle- and low-SDI regions call for an urgent need to implement specific and effective measures. Moreover, considering the gender differences in COPD burdens attributable to some risk factors such as ambient particulate matter and ozone with similar SEV, further research on biological differences between sexes in COPD and relevant policy-making of disease prevention are required.

Keywords: Chronic obstructive pulmonary disease; Global disease burden; Prevention; Risk factors.


Conflict of interest statement

We declare that we had no conflicts of interests.

Figures

Fig. 1
Fig. 1
Age-standardized rates of DALY, YLL, YLD and death attributable to all risk factors of chronic obstructive pulmonary disease, 1990 to 2019. DALY disability-adjusted life year, YLL year of life lost, YLD year lived with disability
Fig. 2
Fig. 2
Contributions of 8 main risk factors to the PAF of age-standardized DALY due to chronic obstructive pulmonary disease by different SDI quintiles and sex from 1990 to 2019. PAF population attributable fraction, DALY disability-adjusted life year, SDI socio-demographic index
Fig. 3
Fig. 3
Contributions of 8 main risk factors to the PAF of age-standardized DALY due to chronic obstructive pulmonary disease by different age and sex from 1990 to 2019. PAF population attributable fraction, DALY disability-adjusted life year
Fig. 4
Fig. 4
The global burden of COPD attributable to smoking over the past 30 years. A Age-standardized rates of DALY, YLL, YLD and death attributable to smoking, 1990–2019. B Age-specific DALY by SDI quintiles and sex in 2019. C Percentage change of age-standardized SEV of smoking for female and male in 204 countries from 1990 to 2019. D Relationship between PAF of age-standardized DALY and SDI in 2019. COPD chronic obstructive pulmonary disease, DALY disability-adjusted life year, YLL year of life lost, YLD year lived with disability, SDI socio-demographic index, SEV summary exposure value, PAF population attributable fraction
Fig. 4
Fig. 4
The global burden of COPD attributable to smoking over the past 30 years. A Age-standardized rates of DALY, YLL, YLD and death attributable to smoking, 1990–2019. B Age-specific DALY by SDI quintiles and sex in 2019. C Percentage change of age-standardized SEV of smoking for female and male in 204 countries from 1990 to 2019. D Relationship between PAF of age-standardized DALY and SDI in 2019. COPD chronic obstructive pulmonary disease, DALY disability-adjusted life year, YLL year of life lost, YLD year lived with disability, SDI socio-demographic index, SEV summary exposure value, PAF population attributable fraction
Fig. 5
Fig. 5
The global burden of COPD attributable to household air pollution over the past 30 years. A Age-standardized rates of DALY, YLL, YLD and death attributable to household air pollution, 1990–2019. B Age-specific DALY by SDI quintiles and sex in 2019. C Percentage change of age-standardized SEV of household air pollution for female and male in 204 countries from 1990 to 2019. D Relationship between PAF of age-standardized DALY and SDI in 2019. COPD chronic obstructive pulmonary disease, DALY disability-adjusted life year, YLL year of life lost, YLD year lived with disability, SDI socio-demographic index, SEV summary exposure value, PAF population attributable fraction
Fig. 5
Fig. 5
The global burden of COPD attributable to household air pollution over the past 30 years. A Age-standardized rates of DALY, YLL, YLD and death attributable to household air pollution, 1990–2019. B Age-specific DALY by SDI quintiles and sex in 2019. C Percentage change of age-standardized SEV of household air pollution for female and male in 204 countries from 1990 to 2019. D Relationship between PAF of age-standardized DALY and SDI in 2019. COPD chronic obstructive pulmonary disease, DALY disability-adjusted life year, YLL year of life lost, YLD year lived with disability, SDI socio-demographic index, SEV summary exposure value, PAF population attributable fraction
Fig. 6
Fig. 6
The global burden of COPD attributable to ambient particulate matter pollution over the past 30 years. A Age-standardized rates of DALY, YLL, YLD and death attributable to ambient particulate matter pollution, 1990 to 2019. B Age-specific DALY by SDI quintiles and sex in 2019. C Percentage change of age-standardized SEV of ambient particulate matter pollution for female and male in 204 countries from 1990 to 2019. D Relationship between PAF of age-standardized DALY and SDI in 2019. COPD chronic obstructive pulmonary disease, DALY disability-adjusted life year, YLL year of life lost, YLD year lived with disability, SDI socio-demographic index, SEV summary exposure value, PAF population attributable fraction
Fig. 6
Fig. 6
The global burden of COPD attributable to ambient particulate matter pollution over the past 30 years. A Age-standardized rates of DALY, YLL, YLD and death attributable to ambient particulate matter pollution, 1990 to 2019. B Age-specific DALY by SDI quintiles and sex in 2019. C Percentage change of age-standardized SEV of ambient particulate matter pollution for female and male in 204 countries from 1990 to 2019. D Relationship between PAF of age-standardized DALY and SDI in 2019. COPD chronic obstructive pulmonary disease, DALY disability-adjusted life year, YLL year of life lost, YLD year lived with disability, SDI socio-demographic index, SEV summary exposure value, PAF population attributable fraction

References

    1. GBD 2019 Diseases and Injuries Collaborators Global burden of 369 diseases and injuries in 204 countries and territories, 1990–2019: a systematic analysis for the Global Burden of Disease Study 2019. Lancet. 2020;396(10258):1204–1222. doi: 10.1016/S0140-6736(20)30925-9. - DOI - PMC - PubMed
    1. GBD Chronic Respiratory Disease Collaborators Prevalence and attributable health burden of chronic respiratory diseases, 1990–2017: a systematic analysis for the Global Burden of Disease Study 2017. Lancet Respir Med. 2020;8(6):585–596. doi: 10.1016/S2213-2600(20)30105-3. - DOI - PMC - PubMed
    1. Li X, Cao X, Guo M, Xie M, Liu X. Trends and risk factors of mortality and disability adjusted life years for chronic respiratory diseases from 1990 to 2017: systematic analysis for the Global Burden of Disease Study 2017. BMJ. 2020;368:m234. doi: 10.1136/bmj.m234. - DOI - PMC - PubMed
    1. GBD 2019 Risk Factors Collaborators Global burden of 87 risk factors in 204 countries and territories, 1990–2019: a systematic analysis for the Global Burden of Disease Study 2019. Lancet. 2020;396(10258):1223–1249. doi: 10.1016/S0140-6736(20)30752-2. - DOI - PMC - PubMed
    1. Stevens GA, Alkema L, Black RE, et al. Guidelines for accurate and transparent health estimates reporting: the GATHER statement. The Lancet. 2016;388(10062):e19–e23. doi: 10.1016/S0140-6736(16)30388-9. - DOI - PubMed