. 2022 Apr;54(4):459-468.
doi: 10.1038/s41588-022-01047-6. Epub 2022 Apr 11.

H3K27me3 conditions chemotolerance in triple-negative breast cancer

Affiliations

H3K27me3 conditions chemotolerance in triple-negative breast cancer

Justine Marsolier et al. Nat Genet. 2022 Apr.

Abstract

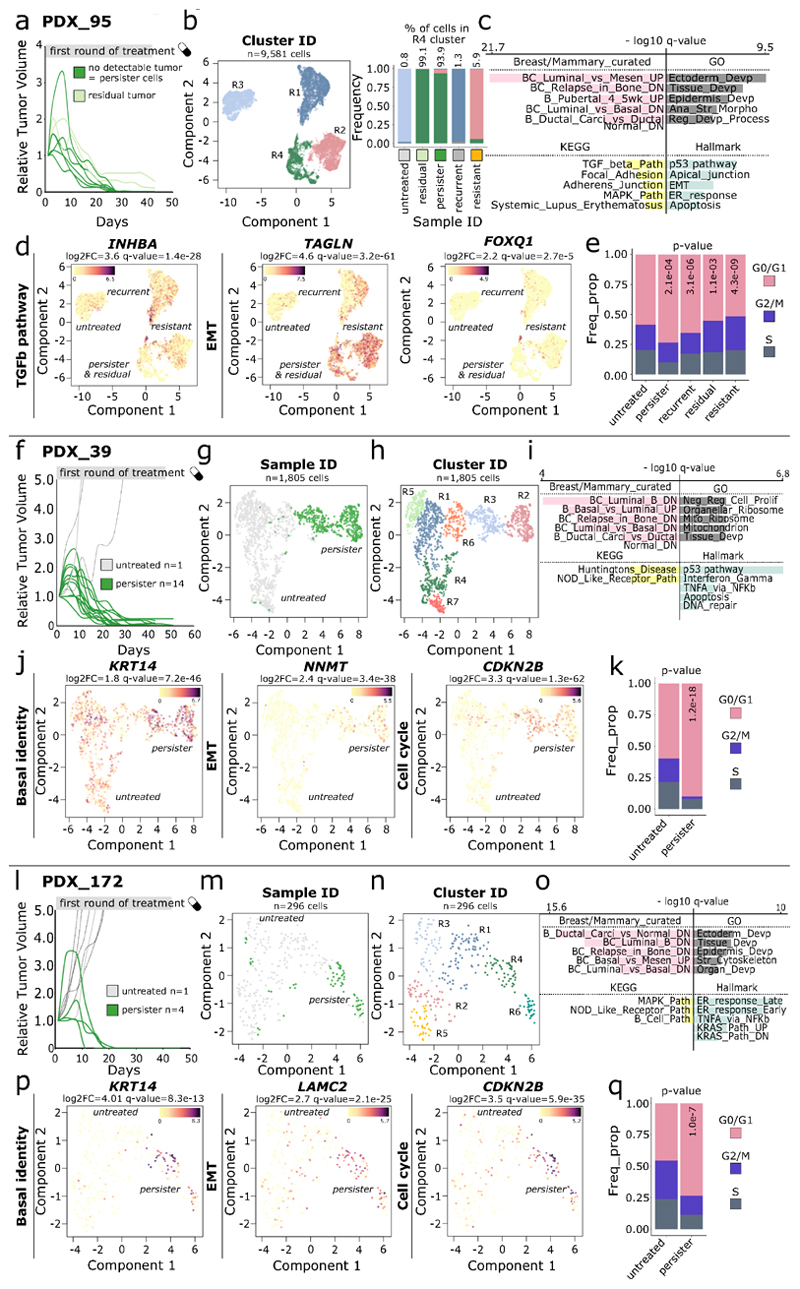
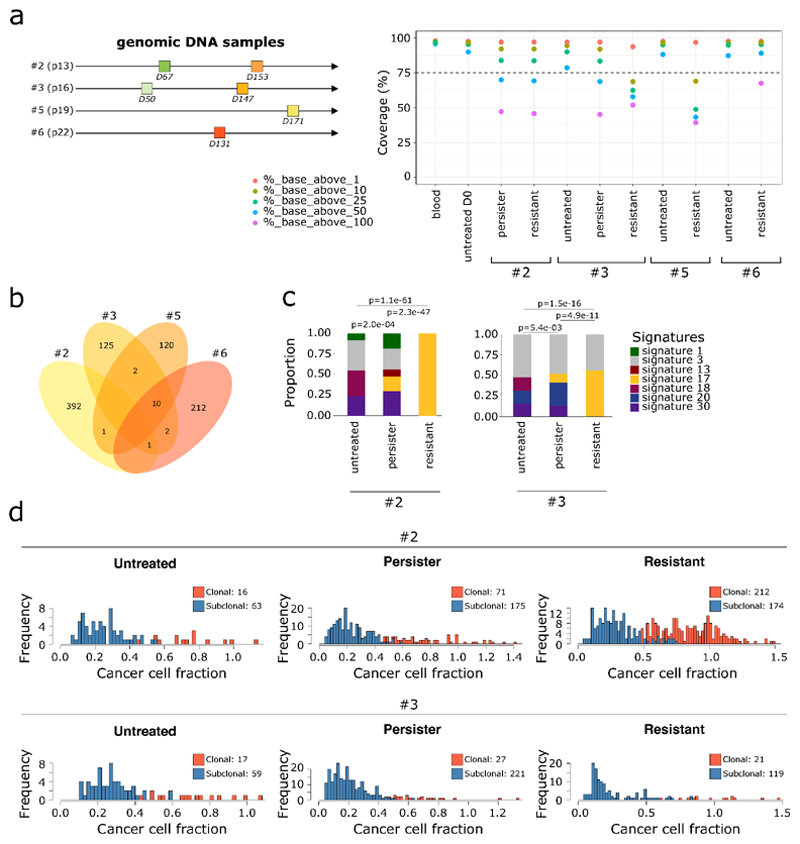
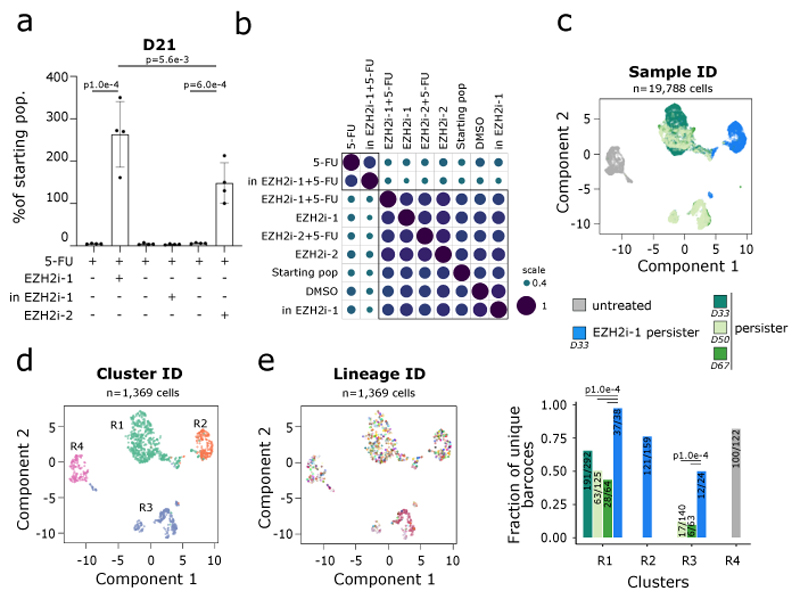
The persistence of cancer cells resistant to therapy remains a major clinical challenge. In triple-negative breast cancer, resistance to chemotherapy results in the highest recurrence risk among breast cancer subtypes. The drug-tolerant state seems largely defined by nongenetic features, but the underlying mechanisms are poorly understood. Here, by monitoring epigenomes, transcriptomes and lineages with single-cell resolution, we show that the repressive histone mark H3K27me3 (trimethylation of histone H3 at lysine 27) regulates cell fate at the onset of chemotherapy. We report that a persister expression program is primed with both H3K4me3 (trimethylation of histone H3 at lysine 4) and H3K27me3 in unchallenged cells, with H3K27me3 being the lock to its transcriptional activation. We further demonstrate that depleting H3K27me3 enhances the potential of cancer cells to tolerate chemotherapy. Conversely, preventing H3K27me3 demethylation simultaneously to chemotherapy inhibits the transition to a drug-tolerant state, and delays tumor recurrence in vivo. Our results highlight how chromatin landscapes shape the potential of cancer cells to respond to initial therapy.


Conflict of interest statement

Competing Interests Statement

C.V. is founder and equity holder of One Biosciences. The remaining authors declare no competing interests.

Figures

Extended Figure 1
Extended Figure 1
Extended Figure 2
Extended Figure 2
Extended Figure 3
Extended Figure 3
Extended Figure 4
Extended Figure 4
Extended Figure 5
Extended Figure 5
Extended Figure 6
Extended Figure 6
Extended Figure 7
Extended Figure 7
Extended Figure 8
Extended Figure 8
Extended Figure 9
Extended Figure 9
Fig. 1
Fig. 1. Identification of a pool of basal persister cells in TNBC in vivo and in vitro.
a. Schematic representation of the standard of care for TNBC patients and the generation of patient-derived xenograft models. b. Graph of the relative tumor volumes (RTV) over time (days). Colored growth curves correspond to tumors that have been further studied by scRNA-seq. Black arrows indicate the start of the second round of Capecitabine treatment for the corresponding mice. c. (Up) Phenotypes and cell numbers are indicated, with the number of mice used to collect samples in brackets. (Down) UMAP representation of PDX scRNA-seq datasets, colored according to sample of origin (first panel - cluster ID are indicated) or log2 gene expression signal for differentially expressed genes between persister cells and untreated tumor cells (remaining panels), log2FC and adjusted P values are indicated above the graph. d. (Left) Venn diagram displaying the intersection of pathways activated in persister cells from the 3 PDX models, among MSigDB c2_curated Breast/Mammary and c7_Hallmark pathways. P value associated with the intersection is indicated below (exact test of multi-set intersections) (Right) Barplot displaying the top 5 pathways - for each category - activated in persister cells. x-axis corresponds to -log10 adjusted P values for the model PDX_95. e. Graph representation of the cell proliferation of triple negative breast cancer cell line MDA-MB-468 (MM468) treated with 5-FU (green for persister cells, and orange lines for resistant cells) or with DMSO (untreated - grey lines). f. (Up) Schematic view of the experimental design. Experiment number and corresponding passage of cells at D0 are indicated. (Down) UMAP representation of MDA-MB-468 cells scRNA-seq datasets, colored according to the sample of origin (first panel - cluster ID are indicated) or log2 gene expression signal for differentially expressed genes between persister cells (cluster R2) and untreated cells (cluster R10, KRT14 and TGFB1 panels) or for a differentially expressed gene between the two persisters clusters, i.e. clusters R4 vs R2 (CDH2 panel). Untreated population (in grey) corresponds to DMSO-D0-#1. g. (Left) UMAP representation of scRNA-seq as in 1f, restricted to cells with detected lineage barcode. Cells are colored according to lineage barcode and cluster membership is indicated (Extended Data Fig. 2c). R1, R2 correspond to RNA-inferred clusters. (Right) Scatter plot of the lineage barcode diversity detected in the scRNA-seq data across clusters and samples. Colors correspond to sample ID as in 1f. (Means are indicated for persister clusters R2 & R4, two-sided Wilcoxon rank test).
Fig. 2
Fig. 2. H3K27me3 represses the persister expression program prior to chemotherapy exposure.
All experiments were performed in MDA-MB-468 cells. a. UMAP representation of scChIP-seq H3K27me3 datasets, cells are colored according to the sample of origin. Persister and resistant samples correspond to 5-FU-treated cells, days of treatment are indicated. b. Same as in a. with cells colored according to cluster membership. E1, E2 correspond to epigenomic-based clusters. c. Enrichment of H3K27me3 significantly depleted peaks in persister cells compared to all peaks across various gene annotation categories with Fisher’s exact test (see Methods). Full bars indicate P value < 1.0 × 10⁻². Empty bars indicate non-significant P values. “PC” indicates protein coding genes. d. Repartition of H3K27me3-depleted peaks within log2 expression fold-changes quantiles from scRNA-seq experiments. e. Cumulative H3K27me3 profiles over TGFB1 and FOXQ1 in untreated and persister cells (D33). Log2FC and adjusted P value correspond to differential analysis of cells from cluster E1 versus cells from clusters E2 + E4. f. Violin plot representation of the cell-to-cell inter-correlation scores between cells from clusters E1, E2 or E4 and cells from E1. Pearson’s correlation scores were compared using a two-sided Wilcoxon rank test, P value are indicated above plots. g. Dot plot representing log2 expression fold-change induced by 5-FU or EZH2i-1 at D33 versus D0. Pearson’s correlation scores and associated P value are indicated. h. Bulk H3K27me3 chromatin profiles for TGFB1 and FOXQ1 in cells treated with DMSO, 5-FU or EZH2i-1 at D33.
Fig. 3
Fig. 3. Epigenomes of untreated cells are primed with co-accumulation of H3K27me3 and H3K4me3.
a. UMAP representation of scChIP-seq H3K4me3 datasets, cells are colored according to the sample of origin - untreated cells (D0) and persister cells (D60). b. (Up) Cumulative H3K4me3 enrichment profiles over FOXQ1 in untreated cells (D0) and persister cells (D60). ‘ns’ stands for not significant after differential testing comparing untreated and persister cells. (Down) H3K27me3→H3K4me3 and H3K27me3→IgG sequential ChIP-seq profiles of FOXQ1 in the untreated population. Comparative tracks show enrichment over IgG control with associated odd ratio and adjusted P value from Fisher’s exact test adjusted for multiple testing. c. Doughnut chart displaying the fraction of persister genes (n = 168) with H3K27me3 loss upon 5-FU treatment or with bivalent chromatin at TSS in untreated cells. Candidate master TFs - among persister genes - are indicated with the number of persister genes potentially regulated by the corresponding TF in parentheses. d. (Left) H3K27me3 and H3K4me3 chromatin profiles of human tumor samples for candidate master TFs (Patient_39, Patient_95 and Patient_172). The percentage of tumoral cells are indicated for each sample. (Right) H3K4me3→H3K27me3 and H3K4me3→IgG sequential ChIP-seq profiles of untreated population of the three derived PDX_models (PDX_39, PDX_95 and PDX_172). Comparative tracks show enrichment over IgG control with associated odds ratio and adjusted P value from Fisher’s exact test adjusted for multiple testing. e. H3K27me3 and H3K4me3 chromatin profiles for FOXQ1 of 6 additional human tumor samples. The percentage of tumoral cells are indicated for each sample. f. Dotplot showing the top pathways enriched in genes displaying a dual H3K27me3 and H3K4me3 enrichment in human tumor samples. Color of the dot corresponds to adjusted P values - calculated with hypergeometric test adjusted for multiple testing - and the size of the dot corresponds to the gene ratio, i.e. the fraction of bivalent genes belonging to this pathway. Stars indicate human tumor samples used to establish our PDX models.
Fig. 4
Fig. 4. EZH2 inhibition rescues cell fate bias upon chemotherapy exposure.
All the experiments were performed in MDA-MB-468 cells. a. Histogram representing the number of cells after treatment with 5-FU alone or 5-FU and EZH2i over 21 days, relative to the number of cells at D0. Cells were pre-treated with EZH2i-1, inactive EZH2i-1 or EZH2i-2 for 10 days prior to chemotherapy treatment. (n = 3, Mean ± s.d., ANOVA test). b. Clustering of samples according to lineage barcode frequencies, detected by bulk analysis, using Spearman correlation score. c. UMAP representation of scRNA-seq datasets, colored according to the sample of origin. Cells were treated with DMSO (untreated) or with 5-FU alone (persister) or with 5-FU and EZH2i-1 (EZH2i-1 persister). d. UMAP representation of scRNA-seq datasets, barcoded cells were selected and colored according to hierarchical clusters e. (Left) UMAP representation of scRNA-seq datasets, barcoded cells were selected and colored according to lineage barcode. (Right) Histogram of the lineage barcodes diversity detected in the scRNA-seq data within hierarchical clusters, and across samples. Colors correspond to sample ID as in 4c. Ratio of unique barcodes/total barcodes and P value are indicated (two-sided Fisher’s test).
Fig. 5
Fig. 5. Simultaneous KDM6i and chemotherapy treatment inhibits chemotolerance in vitro and delays recurrence in vivo.
a. Colony forming assay at day 60 for 5-FU treated MDA-MB-468 cells in combination with DMSO or indicated concentrations of the KDM6i GSK-J4. b. Colony forming assay at day 60 for 5-FU treated MDA-MB-468 cells in combination or not with 1 µM of GSK-J4 or its inactive isomer GSK-J5, either simultaneously - added at D0 - or added at day 39 of chemotherapy treatment. c. Relative tumor volumes for n = 60 mice treated with either DMSO, GSK-J4, Capecitabine or a combination of Capecitabine and GSK-J4. Dashed line indicates the threshold to detect recurrent tumors, RTV = 3. d. Kaplan-Meier plot of the overall disease-free survival probability since pathologic complete response pCR to initial treatment (tumor volume < 20 mm3), number of mice treated and P value are indicated (log-rank test).

References

    1. Vallette FM, et al. Dormant, quiescent, tolerant and persister cells: Four synonyms for the same target in cancer. Biochemical Pharmacology. 2019;162:169–176. - PubMed
    1. Shen S, Vagner S, Robert C. Persistent Cancer Cells: The Deadly Survivors. Cell. 2020;183:860–874. - PubMed
    1. Ramirez M, et al. Diverse drug-resistance mechanisms can emerge from drug-tolerant cancer persister cells. Nat Commun. 2016;7:10690. - PMC - PubMed
    1. Shaffer SM, et al. Rare cell variability and drug-induced reprogramming as a mode of cancer drug resistance. Nature. 2017;546:431–435. - PMC - PubMed
    1. Cortazar P, et al. Pathological complete response and long-term clinical benefit in breast cancer: the CTNeoBC pooled analysis. The Lancet. 2014;384:164–172. - PubMed

Publication types

MeSH terms