. 2022 Apr;54(4):518-525.
doi: 10.1038/s41588-022-01043-w. Epub 2022 Apr 11.

Pangenome-based genome inference allows efficient and accurate genotyping across a wide spectrum of variant classes

Affiliations

Pangenome-based genome inference allows efficient and accurate genotyping across a wide spectrum of variant classes

Jana Ebler et al. Nat Genet. 2022 Apr.

Abstract

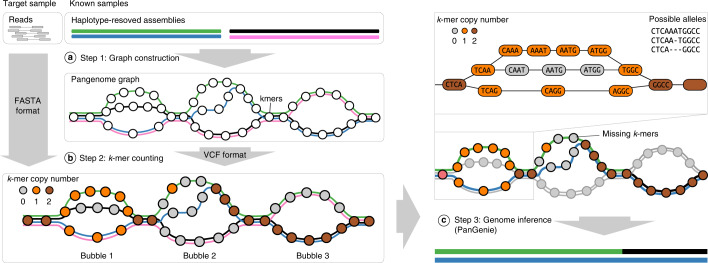
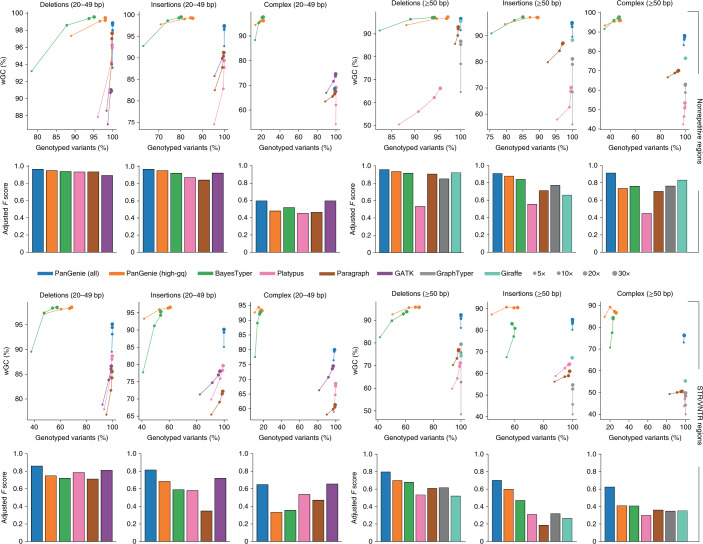
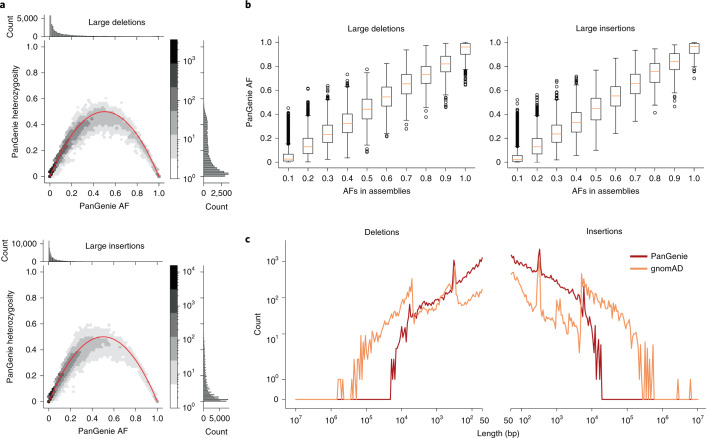
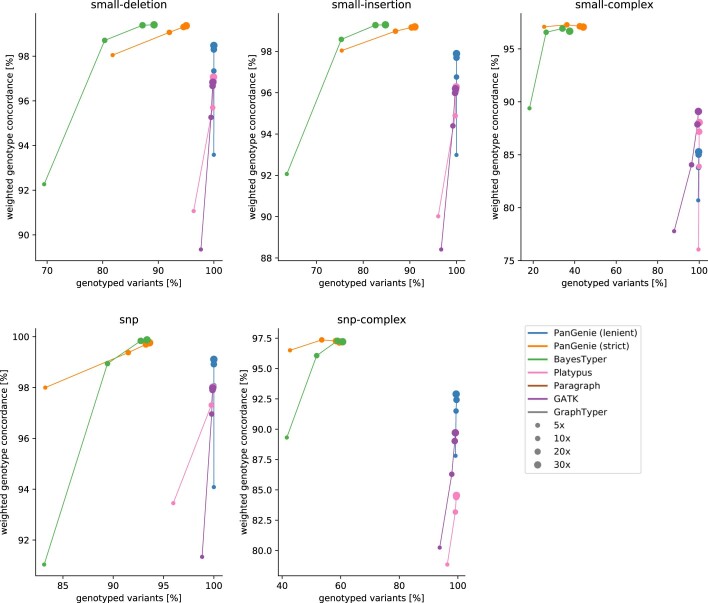
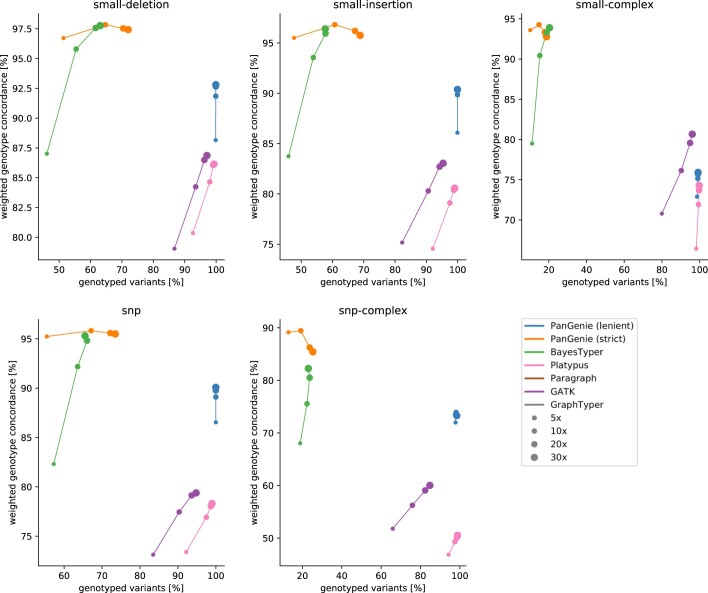
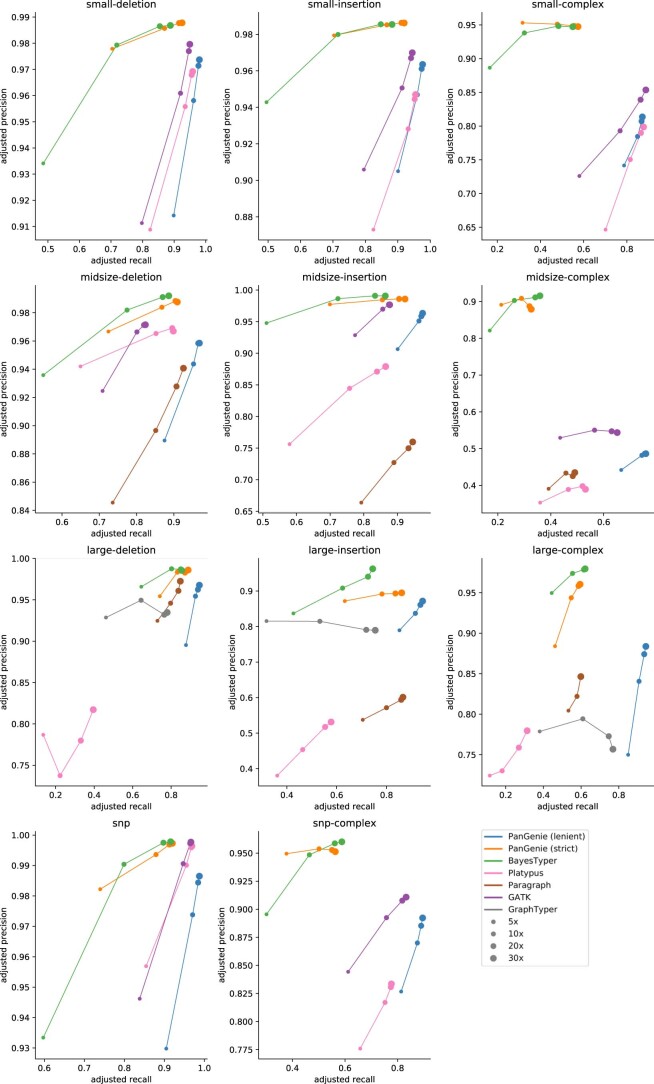
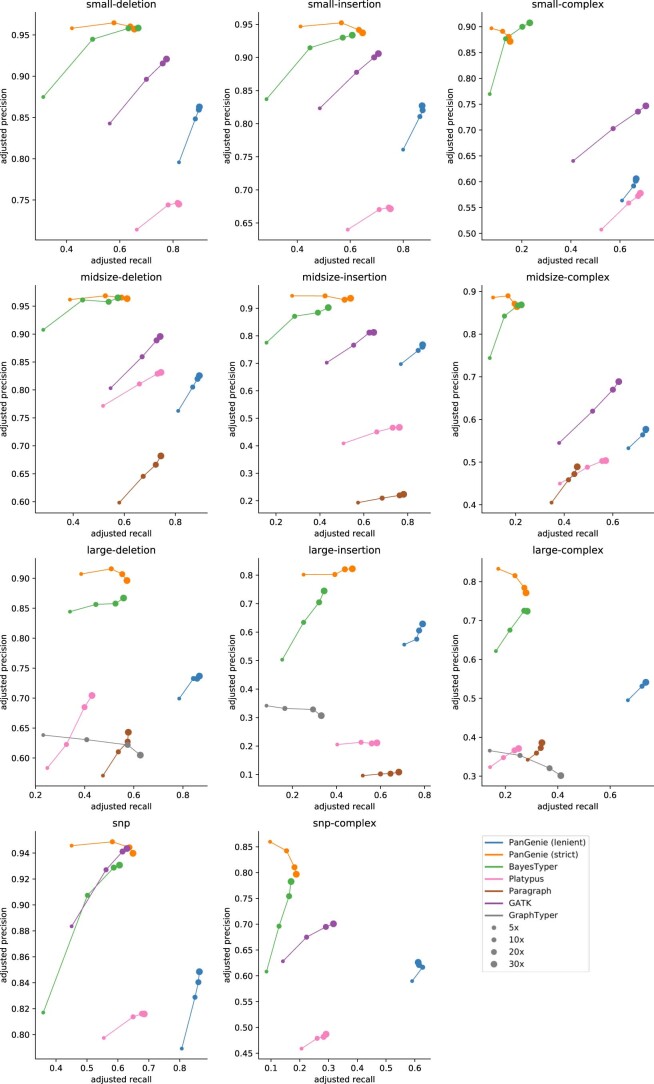
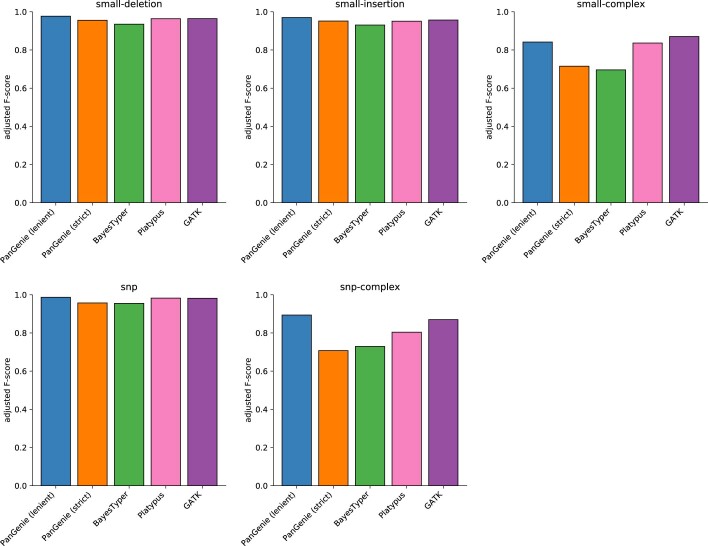
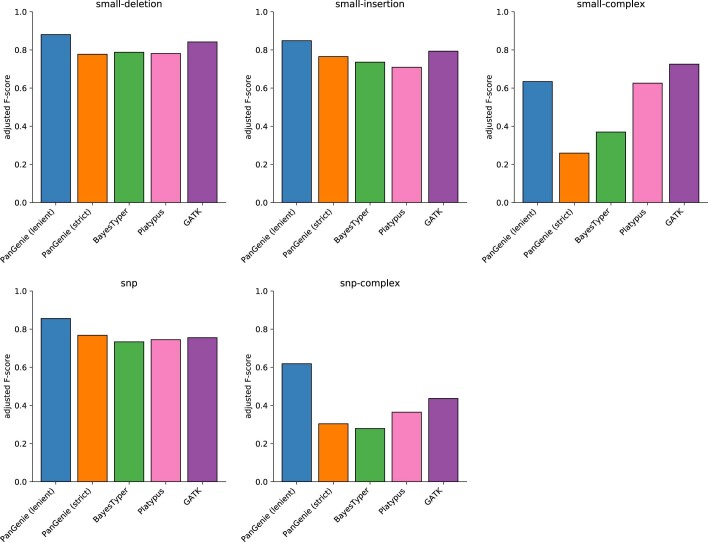
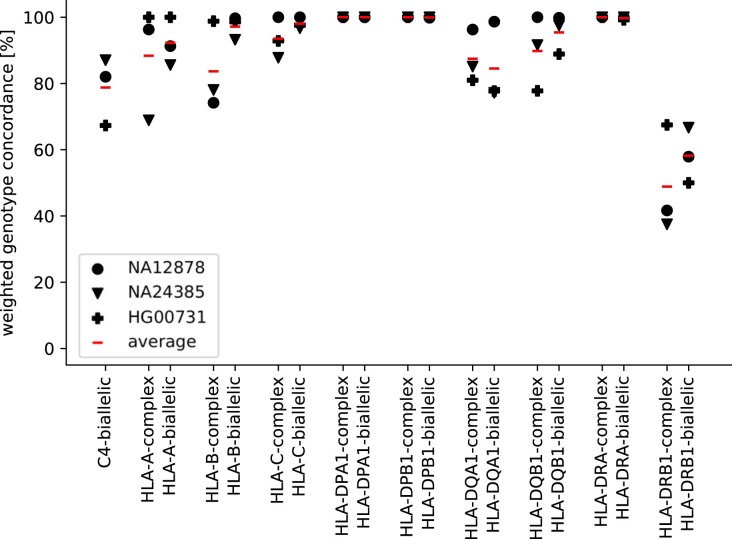
Typical genotyping workflows map reads to a reference genome before identifying genetic variants. Generating such alignments introduces reference biases and comes with substantial computational burden. Furthermore, short-read lengths limit the ability to characterize repetitive genomic regions, which are particularly challenging for fast k-mer-based genotypers. In the present study, we propose a new algorithm, PanGenie, that leverages a haplotype-resolved pangenome reference together with k-mer counts from short-read sequencing data to genotype a wide spectrum of genetic variation-a process we refer to as genome inference. Compared with mapping-based approaches, PanGenie is more than 4 times faster at 30-fold coverage and achieves better genotype concordances for almost all variant types and coverages tested. Improvements are especially pronounced for large insertions (≥50 bp) and variants in repetitive regions, enabling the inclusion of these classes of variants in genome-wide association studies. PanGenie efficiently leverages the increasing amount of haplotype-resolved assemblies to unravel the functional impact of previously inaccessible variants while being faster compared with alignment-based workflows.


Conflict of interest statement

The authors declare no competing interests.

Figures

Fig. 1
Fig. 1. Overview.
a, Step 1: variants are called from haplotype-resolved assemblies of a set of known samples and a pangenome graph is constructed, which represents variants as bubbles and contains one path per haplotype. b, Step 2: the k-mers (represented by circles) contained in the graph are counted in the short-read sequencing data of the target sample to be genotyped. The color of the nodes indicates copy number estimates for the k-mers. c, Step 3: PanGenie uses k-mer counts and haplotype paths to infer the unknown genome. For the first bubble, k-mer counts suggest that the sample probably carries the alleles of the green and blue haplotypes. The second bubble is poorly covered by k-mers; however, linkage to adjacent bubbles can be used to infer the two local haplotype paths.
Fig. 2
Fig. 2. Callset statistics.
a, Overview of the samples for which variants are called from haplotype-resolved assemblies as well as their het:hom ratios. Color corresponds to the population from which the samples originate. b, The number of different substitutions reported for all samples. c, Length distribution of insertions and deletions across all samples (in basepairs). d, Total number of distinct variant alleles detected across all 11 samples (first row), as well as the number of bubbles in the corresponding pangenome graph (second row). We distinguished small (1–19 bp), midsize (20–49 bp) and large (≥50 bp) variants. Biallelic bubbles were classified as SNPs, insertions or deletions; complex corresponds to all remaining bubbles with more than two branches resulting from inserting overlapping variant calls into the graph.
Fig. 3
Fig. 3. Leave-one-out experiment.
The wGC at different coverages for sample NA12878 and F scores for coverage 30× in nonrepetitive (top) and STR/VNTR regions (bottom). We ran PanGenie, BayesTyper, Paragraph, Platypus, GATK, GraphTyper and Giraffe to re-genotype all callset variants. Besides not applying any filter on the reported genotype qualities (‘all’), we additionally report genotyping statistics for PanGenie when using ‘high-gq’ filtering (genotype quality ≥200). Insertions and deletions include all respective variants in biallelic regions of the genome, whereas complex contains all variant alleles falling into regions with complex bubbles in the pangenome graph representation.
Fig. 4
Fig. 4. Genotyping large cohorts.
a, The hexbin plots show the relationship between AFs and heterozygosities of the PanGenie genotypes for all 200 unrelated samples from the 1000 Genomes Project. The barplots show the one-dimensional distributions of both features (top: AF, right: heterozygosity). All large insertions (≥50 bp, n = 84,836) and deletions (≥50 bp, n = 34,290) contained in our lenient set were taken into account. b, Comparison of AFs computed from the PanGenie genotypes for 200 samples and the corresponding AFs observed in the 11 assembly samples from which variants were called. As in a, we consider all large insertions (≥50 bp, n = 84,836) and deletions (≥50 bp, n = 34,290) contained in our lenient set. In the boxplots, lower and upper limits of the box represent the lower and upper quartiles (Q1 and Q3); the median is marked in yellow. Lower and upper whiskers are defined as Q1 − 1.5 (Q3–Q1) and Q3 + 1.5 (Q3–Q1), respectively, and outliers are marked by dots. c, Length distribution of the number of common insertions and deletions (AF ≥ 5%) contained in the PanGenie lenient callset and gnomAD.
Fig. 5
Fig. 5. LD analysis.
We calculated the LD for GWAS variants and SVs that were part of our assembly-based callset. We detected an insertion (marked in blue) close to the ABO gene which was in LD with six GWAS SNPs. The plots show all callset variants in this region; GWAS variants are annotated with their name. Those variants colored in red correspond to blood-type markers.
Extended Data Fig. 1
Extended Data Fig. 1. Variant calling and graph construction.
a) Shown are haplotype-resolved assemblies for three samples and corresponding variant calls made relative to a reference genome. On the right, we show how these variants are represented in a VCF file (simplified). The VCF file is biallelic and contains one record per (distinct) variant allele detected across the assemblies. b) Shown is the pangenome representation of the variants detected in panel a). Variants are represented as bubble structures. Sets of overlapping variants are merged into a single multi-allelic bubble (see first and last bubble for examples). Each haplotype can be represented as a path through the graph. We represent the pangenome in terms of a VCF file containing a record for each bubble and alleles corresponding to the branches of the bubble (right). We keep track of which callset variants each branch of the bubble was constructed from as illustrated in the VCF representation. In this way, we can later convert genotypes derived for a bubble back to genotypes for each individual variant inside of a bubble. Note that our VCFs contain the actual allele sequences in their ‘ALT’ column, we replaced them by their IDs in this figure for simplicity.
Extended Data Fig. 2
Extended Data Fig. 2. Leave one out experiment.
We illustrate the leave-one-out experiment using three samples. Variants are called for all samples based on haplotype-resolved assemblies. For evaluation, we construct a callset containing all variants called in samples 1 and 3, and a truth set containing all variants called in the left out sample (sample 2). The former set of variants is used for genotyping, the latter for evaluation. When running PanGenie, BayesTyper and Platypus, we first convert the variant calls into a pangenome graph representation (stored as VCF) and genotyped the corresponding bubbles (A). We keep track of which bubbles consist of which variant alleles so that genotypes can later be converted back to the original variant representation. For the other tools tested (GATK, Platypus, GraphTyper, Giraffe), we directly used the callset variants as input, without creating the graph (B). The genotypes predicted by each tool are then compared to the variants detected in the left out sample for evaluation. Variants unique to the left out sample cannot be genotyped correctly by any re-genotyping approach (marked in red). We exclude such variants when computing weighted genotype concordances and adjusted precision/recall/Fscore metrics.
Extended Data Fig. 3
Extended Data Fig. 3. Weighted genotype concordance for NA12878 (non-repetitive regions).
Weighted genotype concordance at different coverages for sample NA12878. We ran PanGenie, BayesTyper, Paragraph, Platypus, GATK, GraphTyper and Giraffe in order to re-genotype all callset variants. Besides not applying any filter on the reported genotype qualities (‘all’), we additionally report genotyping statistics for PanGenie when using ‘high-gq’ filtering (genotype quality 200). SNPs, insertions and deletions include all respective variants in biallelic regions of the genome, while complex contains all variant alleles falling into regions with complex bubbles in the pangenome graph representation.
Extended Data Fig. 4
Extended Data Fig. 4. Weighted genotype concordance for NA12878 (STR/VNTR regions).
Weighted genotype concordance at different coverages for sample NA12878. We ran PanGenie, BayesTyper, Paragraph, Platypus, GATK, GraphTyper and Giraffe in order to re-genotype all callset variants. Besides not applying any filter on the reported genotype qualities (‘all’), we additionally report genotyping statistics for PanGenie when using ‘high-gq’ filtering (genotype quality 200). SNPs, insertions and deletions include all respective variants in biallelic regions of the genome, while complex contains all variant alleles falling into regions with complex bubbles in the pangenome graph representation.
Extended Data Fig. 5
Extended Data Fig. 5. Adjusted precision/recall for NA12878 (non-repetitive regions).
Adjusted precision/recall at different coverages for sample NA12878. We ran PanGenie, BayesTyper, Paragraph, Platypus, GATK, GraphTyper and Giraffe in order to re-genotype all callset variants. Besides not applying any filter on the reported genotype qualities (‘all’), we additionally report genotyping statistics for PanGenie when using ‘high-gq’ filtering (genotype quality 200). SNPs, insertions and deletions include all respective variants in biallelic regions of the genome, while complex contains all variant alleles falling into regions with complex bubbles in the pangenome graph representation.
Extended Data Fig. 6
Extended Data Fig. 6. Adjusted precision/recall for NA12878 (STR/VNTR regions).
Adjusted precision/recall at different coverages for sample NA12878. We ran PanGenie, BayesTyper, Paragraph, Platypus, GATK, GraphTyper and Giraffe in order to re-genotype all callset variants. Besides not applying any filter on the reported genotype qualities (‘all’), we additionally report genotyping statistics for PanGenie when using ‘high-gq’ filtering (genotype quality 200). SNPs, insertions and deletions include all respective variants in biallelic regions of the genome, while complex contains all variant alleles falling into regions with complex bubbles in the pangenome graph representation.
Extended Data Fig. 7
Extended Data Fig. 7. Adjusted Fscore for NA12878 (non-repetitive regions).
Adjusted Fscore at coverage 30× for sample NA12878. We ran PanGenie, BayesTyper, Paragraph, Platypus, GATK, GraphTyper and Giraffe in order to re-genotype all callset variants. Besides not applying any filter on the reported genotype qualities (‘all’), we additionally report genotyping statistics for PanGenie when using ‘high-gq’ filtering (genotype quality 200). SNPs, insertions and deletions include all respective variants in biallelic regions of the genome, while complex contains all variant alleles falling into regions with complex bubbles in the pangenome graph representation.
Extended Data Fig. 8
Extended Data Fig. 8. Adjusted Fscore for NA12878 (STR/VNTR regions).
Adjusted Fscore at coverage 30× for sample NA12878. We ran PanGenie, BayesTyper, Paragraph, Platypus, GATK, GraphTyper and Giraffe in order to re-genotype all callset variants. Besides not applying any filter on the reported genotype qualities (‘all’), we additionally report genotyping statistics for PanGenie when using ‘high-gq’ filtering (genotype quality 200). SNPs, insertions and deletions include all respective variants in biallelic regions of the genome, while complex contains all variant alleles falling into regions with complex bubbles in the pangenome graph representation.
Extended Data Fig. 9
Extended Data Fig. 9. HLA genotyping.
Weighted genotype concordances for samples NA12878, NA24385 and HG00731 resulting from a ‘leave-one-out’ experiment for HLA genes, as well as the average weighted genotype concordance across all three samples (red). For each gene, we separately computed concordances for the simpler, ‘biallelic’ regions, as well as the more difficult ‘complex’ regions.
Extended Data Fig. 10
Extended Data Fig. 10. GIAB medically relevant SVs in our lenient set.
Distribution of SVR scores for all 209 GIAB medically relevant genes that are part of our variant callset (left), as well as heterozygosities and allele frequencies observed across all 200 unrelated trio samples in our lenient set (right).

References

    1. Garg, S. et al. Chromosome-scale, haplotype-resolved assembly of human genomes. Nat. Biotechnol. 39, 309–312 (2021). - PMC - PubMed
    1. Porubsky, D. et al. A fully phased accurate assembly of an individual human genome. Nat. Biotechnol. 39, 302–308 (2021). - PMC - PubMed
    1. Koren, S. et al. De novo assembly of haplotype-resolved genomes with trio binning. Nat. Biotechnol. 36, 1174–1182 (2018). - PMC - PubMed
    1. Ebert P, et al. Haplotype-resolved diverse human genomes and integrated analysis of structural variation. Science. 2021;372:eabf7117. doi: 10.1126/science.abf7117. - DOI - PMC - PubMed
    1. Wang, T. et al. The Human Pangenome Project: a global resource to map genomic diversity. Nature10.1038/s41586-022-04601-8 (2022). - PMC - PubMed

Publication types