. 2022 Sep;179(9):650-660.
doi: 10.1176/appi.ajp.21070686. Epub 2022 Apr 12.

Schizophrenia Imaging Signatures and Their Associations With Cognition, Psychopathology, and Genetics in the General Population

Affiliations

Schizophrenia Imaging Signatures and Their Associations With Cognition, Psychopathology, and Genetics in the General Population

Ganesh B Chand et al. Am J Psychiatry. 2022 Sep.

Abstract

Objective: The prevalence and significance of schizophrenia-related phenotypes at the population level is debated in the literature. Here, the authors assessed whether two recently reported neuroanatomical signatures of schizophrenia-signature 1, with widespread reduction of gray matter volume, and signature 2, with increased striatal volume-could be replicated in an independent schizophrenia sample, and investigated whether expression of these signatures can be detected at the population level and how they relate to cognition, psychosis spectrum symptoms, and schizophrenia genetic risk.

Methods: This cross-sectional study used an independent schizophrenia-control sample (N=347; ages 16-57 years) for replication of imaging signatures, and then examined two independent population-level data sets: typically developing youths and youths with psychosis spectrum symptoms in the Philadelphia Neurodevelopmental Cohort (N=359; ages 16-23 years) and adults in the UK Biobank study (N=836; ages 44-50 years). The authors quantified signature expression using support-vector machine learning and compared cognition, psychopathology, and polygenic risk between signatures.

Results: Two neuroanatomical signatures of schizophrenia were replicated. Signature 1 but not signature 2 was significantly more common in youths with psychosis spectrum symptoms than in typically developing youths, whereas signature 2 frequency was similar in the two groups. In both youths and adults, signature 1 was associated with worse cognitive performance than signature 2. Compared with adults with neither signature, adults expressing signature 1 had elevated schizophrenia polygenic risk scores, but this was not seen for signature 2.

Conclusions: The authors successfully replicated two neuroanatomical signatures of schizophrenia and describe their prevalence in population-based samples of youths and adults. They further demonstrated distinct relationships of these signatures with psychosis symptoms, cognition, and genetic risk, potentially reflecting underlying neurobiological vulnerability.

Keywords: Genetics/Genomics; Machine Learning; Neuroanatomy; Neuroimaging; Polygenic Risk Scores; Schizophrenia Spectrum and Other Psychotic Disorders.


Figures
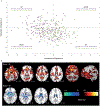
FIGURE 1.
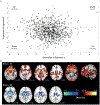
FIGURE 1.. Presence of signature 1 (S1) and signature 2 (S2) expressions in the Philadelphia Neurodevelopmental Cohort data seta
a In panel A, dimensional expression strength was visualized in a two-axis (E1, E2) framework, with typically developing and psychosis spectrum individuals across S1, S2, both signatures (S1+S2), and neither signature (“none”). S1 was significantly more common in the psychosis spectrum group than in the typically developing group (χ2=11.67, df=1, p<0.05, corrected for multiple comparisons), but other combinations were similar between the typically developing and psychosis spectrum groups (p>0.05). In panel B, voxel-based comparisons of regional gray matter volumes between individuals expressing primarily S1 (top) or S2 (bottom), compared with individuals expressing neither of these two signatures, are displayed for visualization purposes. Individuals with S1 were characterized by significantly reduced gray matter volumes, especially in prefrontal, temporal, and peri-Sylvian regions, whereas those with S2 were characterized by markedly increased striatal volumes and normal to mildly enlarged cortical volumes compared with the “none” subgroup. Cohen’s d (effect size) maps were generated by masking MIDAS results after false discovery rate correction over voxels at p<0.05, and the largest effect sizes (~1.4) were observed in the thalamus, nucleus accumbens, and medial temporal, medial prefrontal/frontal, and insular cortices for S1 and in the striatal region for S2. (See Figure S3 in the online supplement for visualization of white matter comparison.)
FIGURE 2.
FIGURE 2.. Cognitive profiles of signature 1 (S1) and signature 2 (S2) in the Philadelphia Neurodevelopmental Cohort data seta
a In panels A–D, S1 expression across the full sample was inversely correlated with global cognitive performance efficiency (combination of accuracy and speed) (Spearman’s rank correlation, ρ=−0.28, p<10−4) and accuracy (ρ=−0.24, p<10−4), whereas stronger S2 expression was correlated with higher efficiency (ρ=0.13, p<0.05), and S2 expression was not significantly associated with accuracy (ρ=0.06, p>0.05). In panels E–G, individuals with S1 had worse efficiency (Wilcoxon rank sum test, z=−4.64, p<10−4), accuracy (z=−3.38, p<0.05), and speed (z=−2.71, p<0.05) than those with S2. The S1 subgroup also had worse efficiency (z=−4.50, p<0.05), accuracy (z=−3.91, p<0.05), and speed (z=−2.53, p<0.05) than the “none” subgroup. Error bars indicate standard error of the mean over subjects; asterisks indicate p<0.05, corrected for multiple comparisons.
FIGURE 3.
FIGURE 3.. Presence of signature 1 (S1) and signature 2 (S2) expressions in the UK Biobank data seta
a In panel A, dimensional expression strength was visualized in a two-axis (E1, E2) framework, with individuals across S1, S2, both signatures (S1+S2), and neither signature (“none”). In panel B, voxel-based comparisons of regional gray matter volumes between individuals expressing primarily S1 (top) or S2 (bottom), compared with individuals expressing neither of these signatures, are displayed for visualization purposes. Individuals with S1 were characterized by significantly reduced gray matter volumes, especially in prefrontal, temporal, and peri-Sylvian regions, whereas those with S2 were characterized by markedly increased striatal volumes compared to the “none” subgroup. Cohen’s d (effect size) maps were generated by masking MIDAS results after false discovery rate correction over voxels at p<0.05. (See Figure S10 in the online supplement for visualization of white matter comparison.)
FIGURE 4.
FIGURE 4.. Cognitive profiles of signature 1 (S1) and signature 2 (S2) in the UK Biobank data seta
a In panel A, stronger S1 expression across the full sample was associated with worse cognitive performance on the Trail Making Test, part B (Trails B; higher Trails B time reflects worse performance) (ρ=0.15, p<0.05), whereas in panel B, S2 expression was not significantly correlated with Trails B (ρ= −0.05, p>0.05). In panel C, the S1 subgroup had worse cognitive performance on Trails B than the S2 subgroup (z=2.85, p<0.05). In panel D, stronger S1 expression across the full sample was correlated with worse cognitive performance on the fluid intelligence test (ρ=−0.15, p<10−4), whereas in panel E, S2 expression was positively correlated with the fluid intelligence test (ρ=0.17, p<10−4). In panel F, the S1 subgroup had worse cognitive performance on the fluid intelligence test than the S2 subgroup (z=−5.16, p<10−4) and the “none” subgroup (z=−3.89, p<0.05). Error bars indicate standard error of the mean over subjects; asterisks indicate p<0.05, corrected for multiple comparisons.
FIGURE 5.
FIGURE 5.. Genetic profiles of signature 1 (S1) and signature 2 (S2) in the UK Biobank data seta
a Only the S1 subgroup had significantly higher polygenicrisk scores (PRSs) for schizophrenia compared with the “none” subgroup (Wilcoxon rank sum test, z=2.69, p<0.05). Error bars indicate standard error of the mean over subjects; asterisks indicate p<0.05, corrected for multiple comparisons.

Comment in

References

    1. Crespo-Facorro B, Such P, Nylander A-G, et al.: The burden of disease in early schizophrenia: a systematic literature review. Curr Med Res Opin 2020; 37:109–121 - PubMed
    1. Zhang T, Koutsouleris N, Meisenzahl E, et al.: Heterogeneity of structural brain changes in subtypes of schizophrenia revealed using magnetic resonance imaging pattern analysis. Schizophr Bull 2015; 41:74–84 - PMC - PubMed
    1. Voineskos AN, Jacobs GR, Ameis SH: Neuroimaging heterogeneity in psychosis: neurobiological underpinnings and opportunities for prognostic and therapeutic innovation. Biol Psychiatry 2020; 88: 95–102 - PMC - PubMed
    1. Kapur S, Phillips AG, Insel TR: Why has it taken so long for biological psychiatry to develop clinical tests and what to do about it? Mol Psychiatry 2012; 17:1174–1179 - PubMed
    1. Chand GB, Dwyer DB, Erus G, et al.: Two distinct neuroanatomical subtypes of schizophrenia revealed using machine learning. Brain 2020; 143:1027–1038 - PMC - PubMed

Publication types