. 2022 Dec;11(1):250-265.
doi: 10.1080/21623945.2022.2064956.

Transcriptome analysis of adipocytokines and their-related LncRNAs in lung adenocarcinoma revealing the association with prognosis, immune infiltration, and metabolic characteristics

Affiliations

Transcriptome analysis of adipocytokines and their-related LncRNAs in lung adenocarcinoma revealing the association with prognosis, immune infiltration, and metabolic characteristics

Jie Ren et al. Adipocyte. 2022 Dec.

Abstract

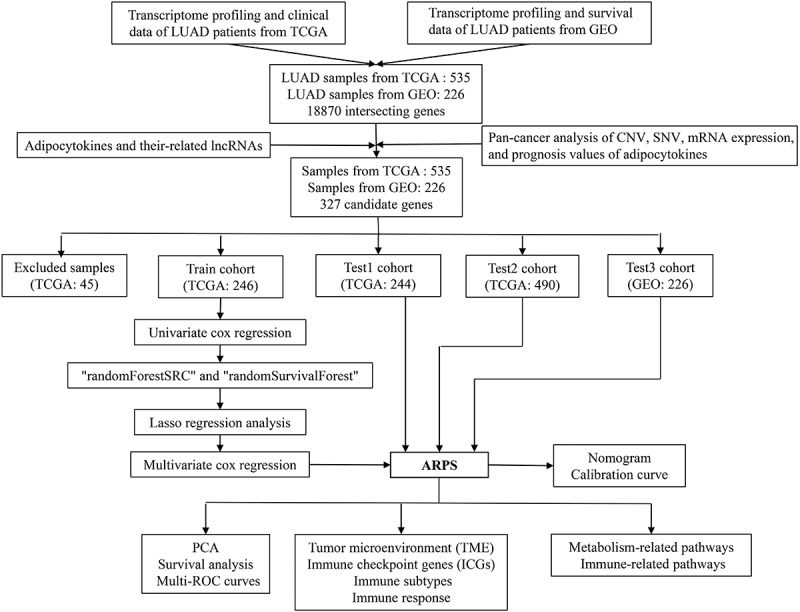
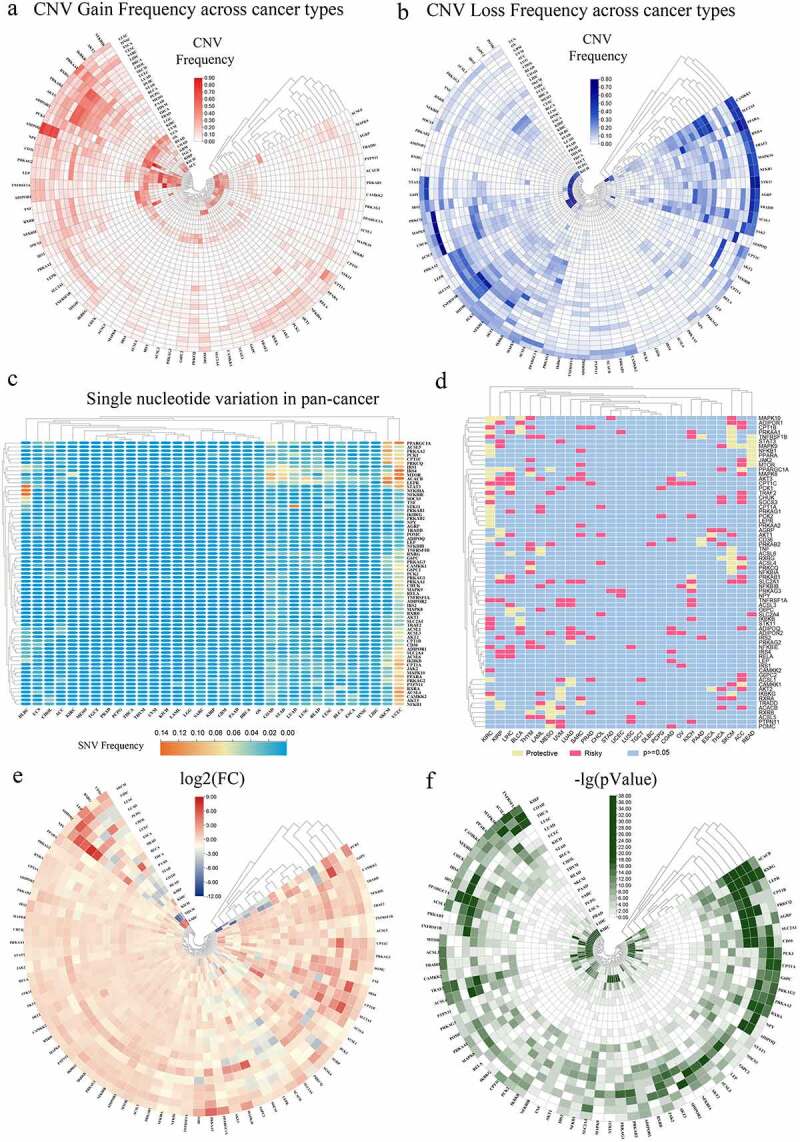
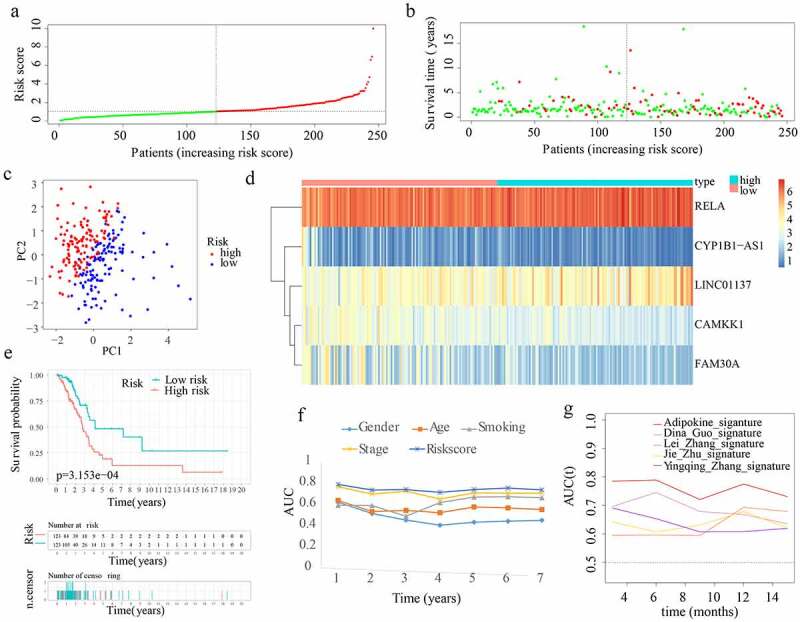
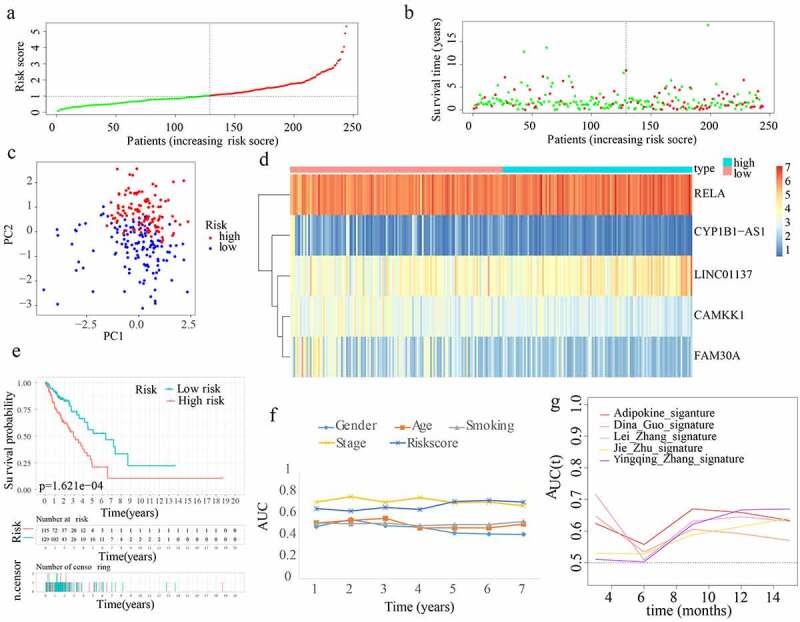
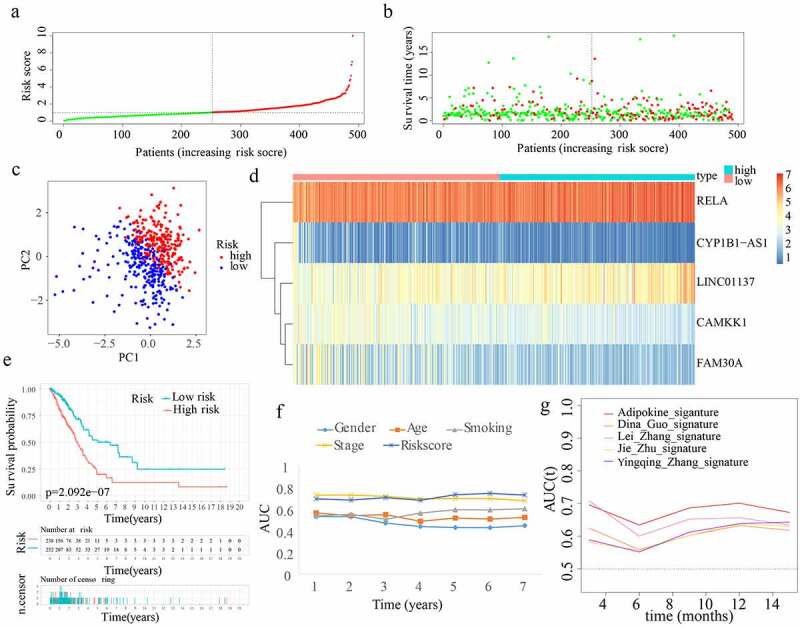
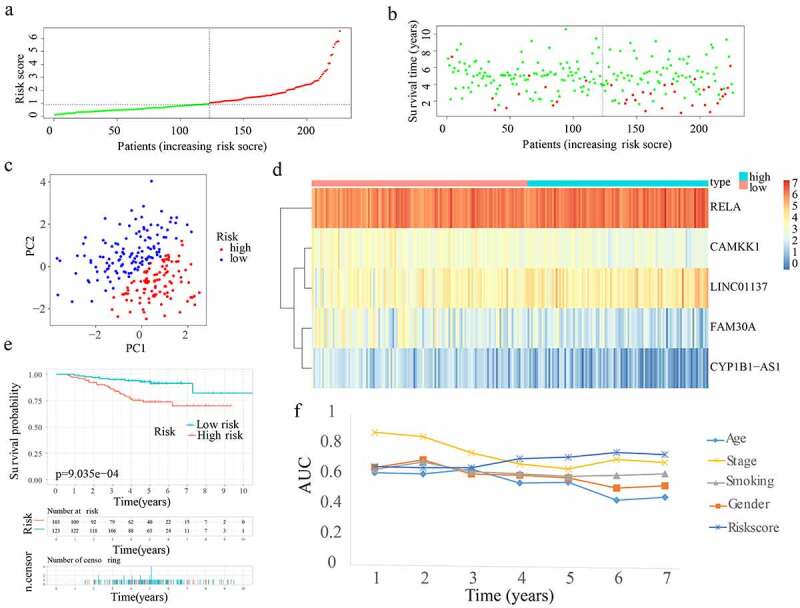
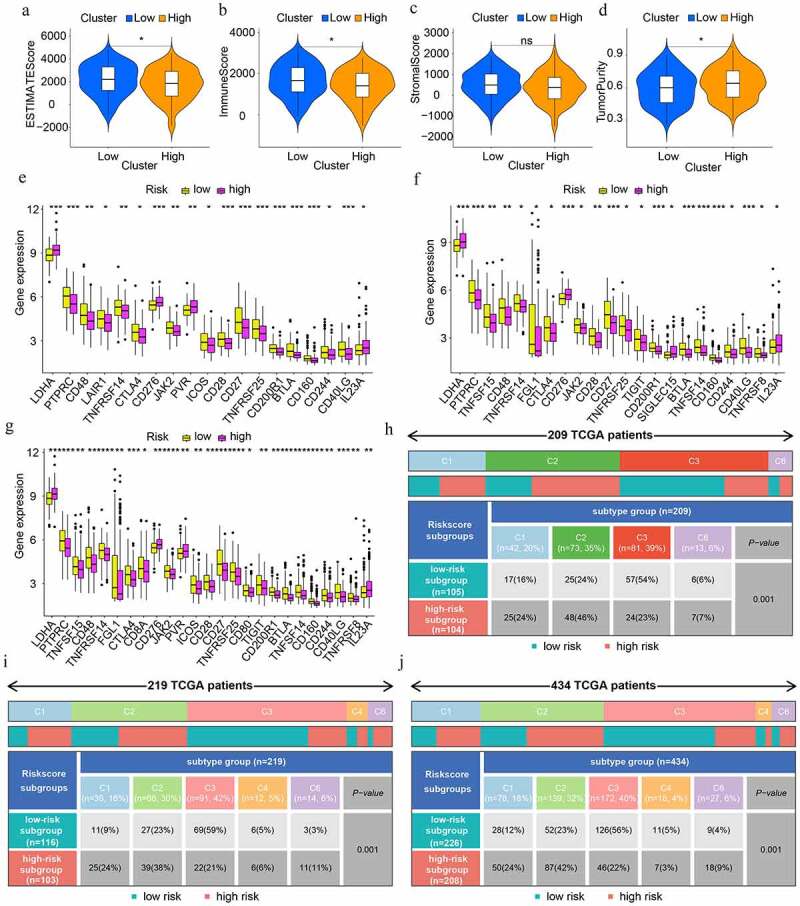
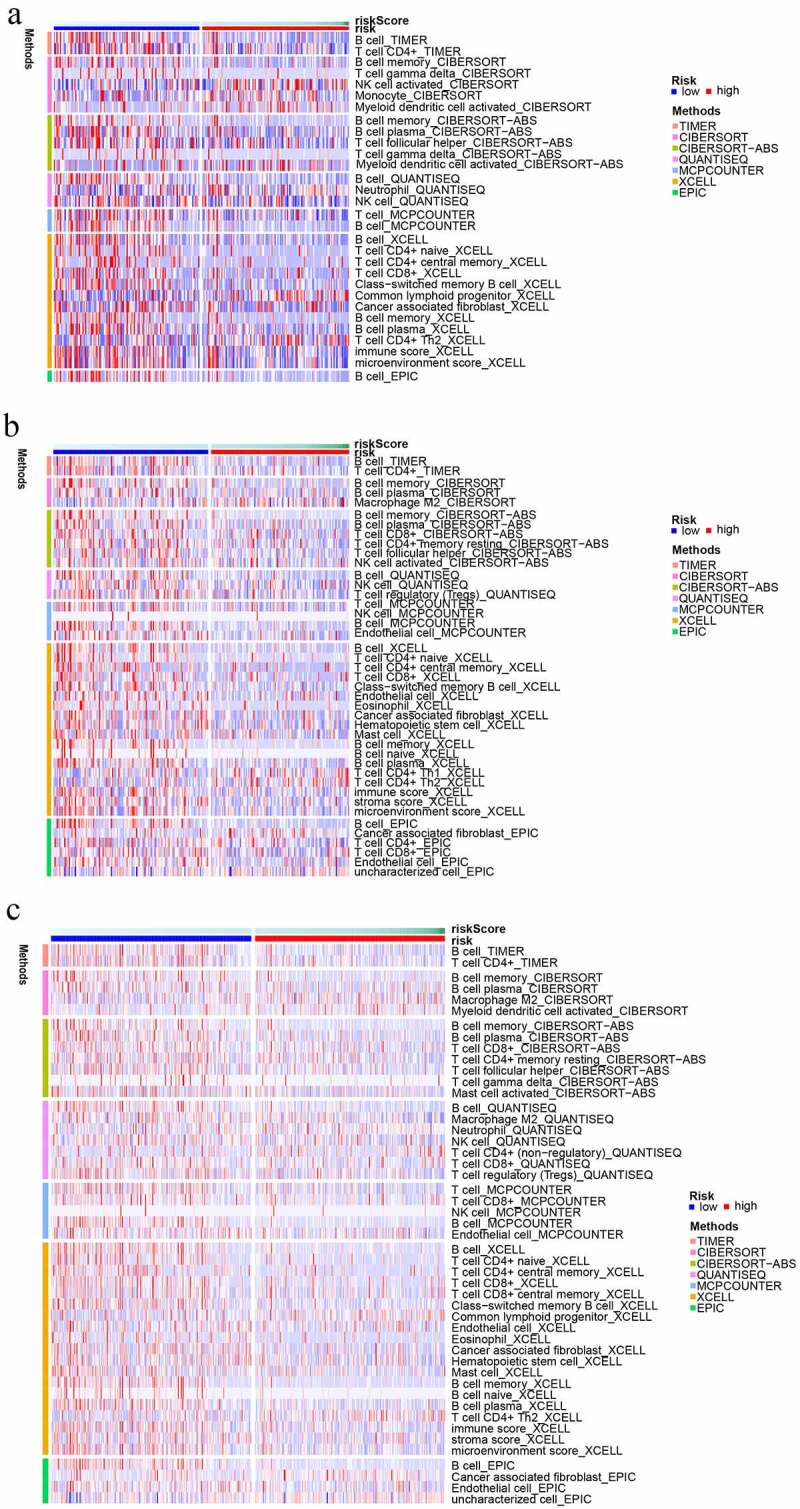
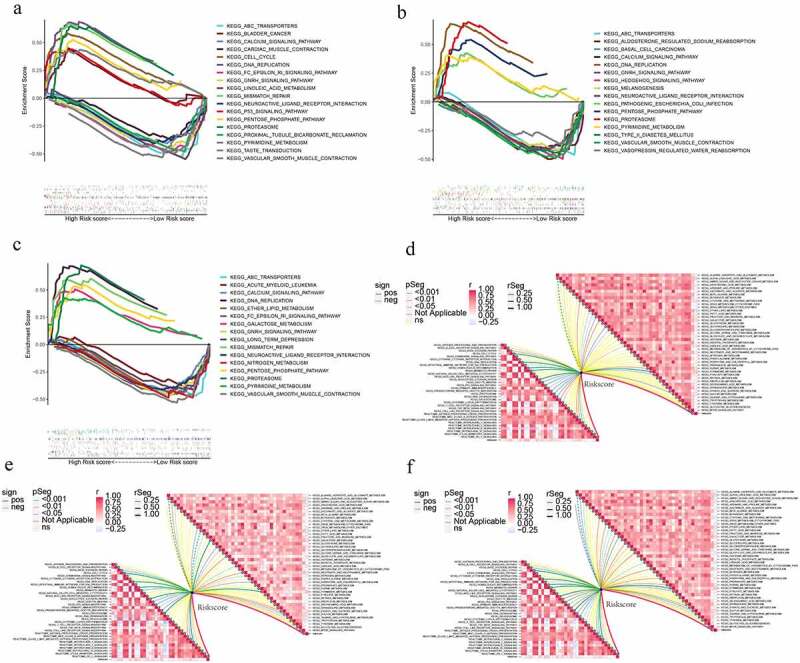
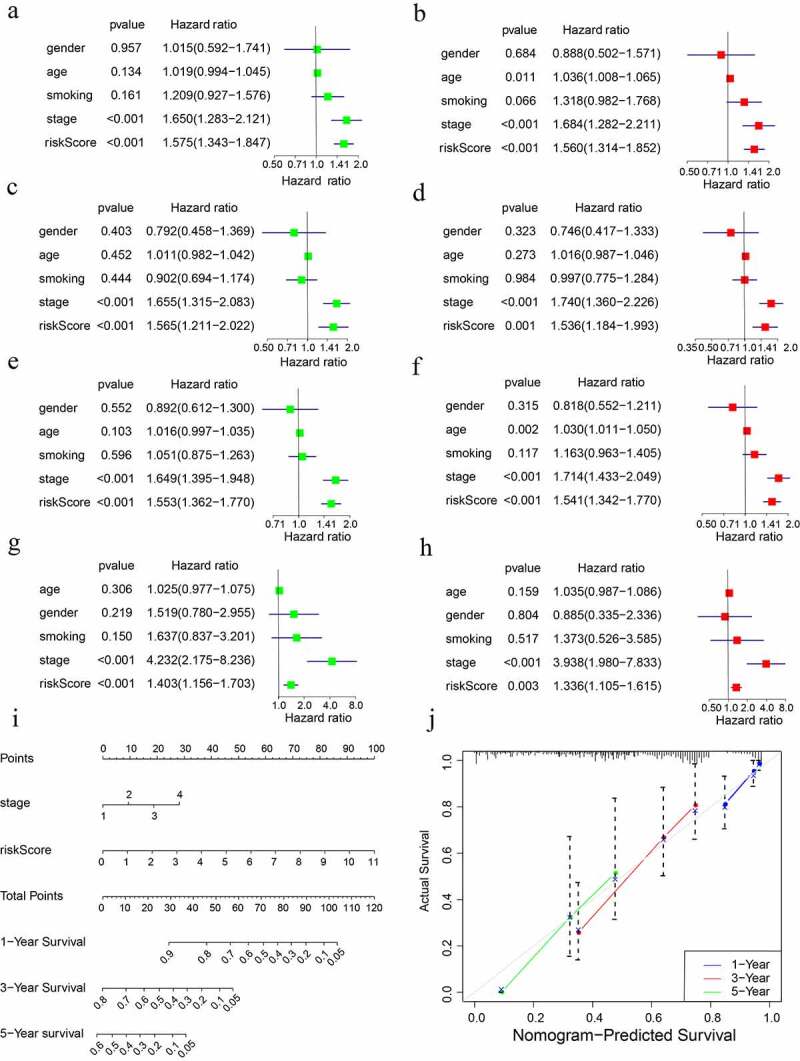
Lung adenocarcinoma (LUAD) is amongst the major contributors to cancer-related deaths on a global scale. Adipocytokines and long non-coding RNAs (lncRNAs) are indispensable participants in cancer. We performed a pan-cancer analysis of the mRNA expression, single nucleotide variation, copy number variation, and prognostic value of adipocytokines. LUAD samples were obtained from the Gene Expression Omnibus (GEO) and The Cancer Genome Atlas (TCGA) databases. Simultaneously, train, internal and external cohorts were grouped. After a stepwise screening of optimized genes through least absolute shrinkage and selection operator regression analysis, random forest algorithm,, and Cox regression analysis, an adipocytokine-related prognostic signature (ARPS) with superior performance compared with four additional well-established signatures for survival prediction was constructed. After determination of risk levels, the discrepancy of immune microenvironment, immune checkpoint gene expression, immune subtypes, and immune response in low- and high-risk cohorts were explored through multiple bioinformatics methods. Abnormal pathways underlying high- and low-risk subgroups were identified through gene set enrichment analysis (GSEA). Immune-and metabolism-related pathways that were correlated with risk score were selected through single sample GSEA. Finally, a nomogram with satisfied predictive survival probability was plotted. In summary, this study offers meaningful information for clinical treatment and scientific investigation.

Keywords: Lung adenocarcinoma; adipocytokine; immune infiltration; long non-coding RNA; prognostic signature.


Conflict of interest statement

No potential conflict of interest was reported by the author(s).

Figures

Figure 1.
Figure 1.
The workflow of the current study.
Figure 2.
Figure 2.
Panoramic view of adipocytokines in pan-cancer. (a) The gain frequencies of copy number variation (CNV) in diverse types of cancers. (b) Loss frequencies of CNV in diverse types of cancers. (c) Single nucleotide variation (SNV) in pan-cancer. (d) Survival landscape of adipocytokines across cancer types. (e) The changes of mRNA expression of adipocytokines across cancer types (FC: Fold changes). (f) The relevant -logP value of the changes of each gene across various cancers.
Figure 3.
Figure 3.
Construction of ARPS in the training cohort. (a) Group division according to median risk score in the training cohort. (b) Survival status and risk score distributions in the training cohort. (c) Training cohort’s PCA. (d) In the training cohort, a heatmap depicting the levels of expression of the 5 genes associated with the signature. (e) Survival curve of the training cohort. (f) AUC values of multi-ROC curves in the training cohort. (g) The AUC values of ROC curves for prediction ability of ARPS in comparison to four additional signatures in the training cohort.
Figure 4.
Figure 4.
Internal verification of ARPS in test1 cohort. (a) In the test 1 cohort, there was a classification into subgroups. (b) Survival status and risk score distributions of test 1 cohort. (c) PCA of test 1 cohort. (d) The heatmap depicting the levels of expression of the 5 genes implicated in the signature in test1 cohort. (e) Survival curve of test 1 cohort. (f) AUC values of multi-ROC curves in test 1 cohort. (g) The AUC values of ROC curves for prediction ability of ARPS in comparison to four additional signatures in test1 cohort.
Figure 5.
Figure 5.
Internal verification of ARPS in test 2 cohort. (a) Classification of test 2 cohort into subgroups. (b) Survival status and risk score distributions of test 2 cohort. (c) PCA of test2 cohort. (d) Heatmap depicting the levels of expression of the 5 genes related to the signature in test2 cohort. (e) Survival curve of test 2 cohort. (f) AUC values of multi-ROC curves in test 2 cohort. (g) The AUC values of ROC curves for ARPS prediction ability in comparison to four additional signatures in test 2 cohort.
Figure 6.
Figure 6.
External verification of ARPS in test 3 cohort. (a) Test 3 cohort was divided into groups. (b) Survival status and risk score distributions of test 3 cohort. (c) PCA of test3 cohort. (d) Heatmap illustrating the levels of expression for the five genes linked to the signature in test 3 cohort. (e) Survival curve of test3 cohort. (f) AUC values of multi-ROC curves in test 3 cohort.
Figure 7.
Figure 7.
The discrepancies in tumour microenvironment (TME), immune checkpoint genes (ICGs), and immune subtypes in low- and high-risk population. (a-d) TME scores in high- and low-risk subgroups. Greater scores denote an elevated proportion of the matching TME component. (e-g) Differential expression analysis of ICGs in train, test1, and test2 cohorts respectively. (h-j) Heat map and table showing the distribution of immune subtypes (C1, C2, C3, C4, C5, and C6) between the risk score-based subgroups in train, test1, and test2 cohorts respectively.
Figure 8.
Figure 8.
The immune cell infiltration distribution landscape in (a) train, (b) test 1, and (c) test 2 cohorts.
Figure 9.
Figure 9.
ARPS-based functional annotation. (a-c) Gene set enrichment analysis of the low- and high-risk subgroups in train, test1, and test2 cohorts. (d-f) Relationships between risk score and immune-related (in the left bottom panel) and metabolism-related pathways (in the upper right panel) in train, test1, and test2 cohorts.
Figure 10.
Figure 10.
Creation and verification of the risk score-based nomogram. Multivariate and univariate cox regression analyses in (a, b) training cohort, (c, d) test1 cohort, (e, f) test2 cohort, and (g,h) test3 cohort. (i) The nomogram for survival probability over one, three, and five years. (j) Verification of the predictive power of the nomogram using calibration curves.

References

    1. Herbst RS, Heymach JV, Lippman SM.. Lung cancer. N Engl J Med. 2008;359(13):1367–1380. - PMC - PubMed
    1. Siegel RL, Miller KD, Jemal A.. Cancer statistics, 2019. CA Cancer J Clin. 2019;69(1):7–34. - PubMed
    1. Cao H. Adipocytokines in obesity and metabolic disease. J Endocrinol. 2014;220(2):T47–59. - PMC - PubMed
    1. Weisberg SP, McCann D, Desai M, et al. Obesity is associated with macrophage accumulation in adipose tissue. J Clin Invest. 2003;112(12):1796–1808. - PMC - PubMed
    1. Xu H, Barnes GT, Yang Q, et al. Chronic inflammation in fat plays a crucial role in the development of obesity-related insulin resistance. J Clin Invest. 2003;112(12):1821–1830. - PMC - PubMed

Publication types