. 2022 Apr 11;13(1):1944.
doi: 10.1038/s41467-022-29511-1.

Transient viral exposure drives functionally-coordinated humoral immune responses in HIV-1 post-treatment controllers

Collaborators, Affiliations

Transient viral exposure drives functionally-coordinated humoral immune responses in HIV-1 post-treatment controllers

Luis M Molinos-Albert et al. Nat Commun. .

Abstract

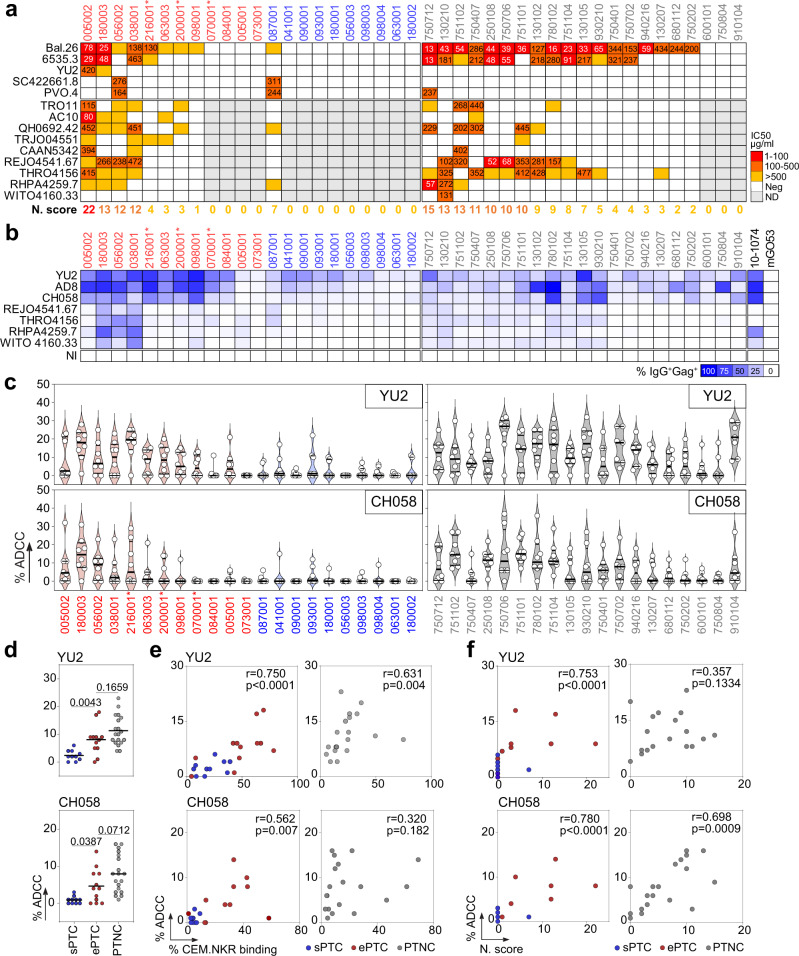
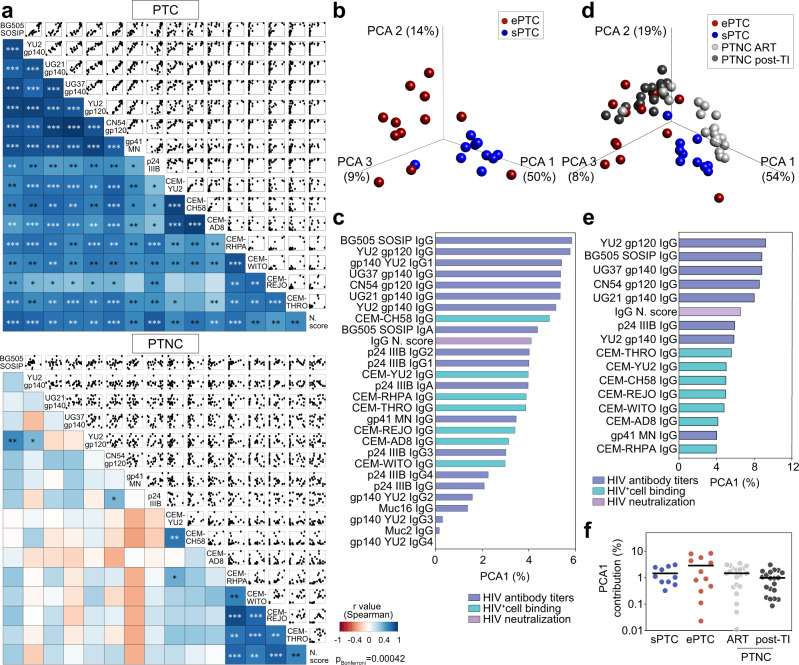
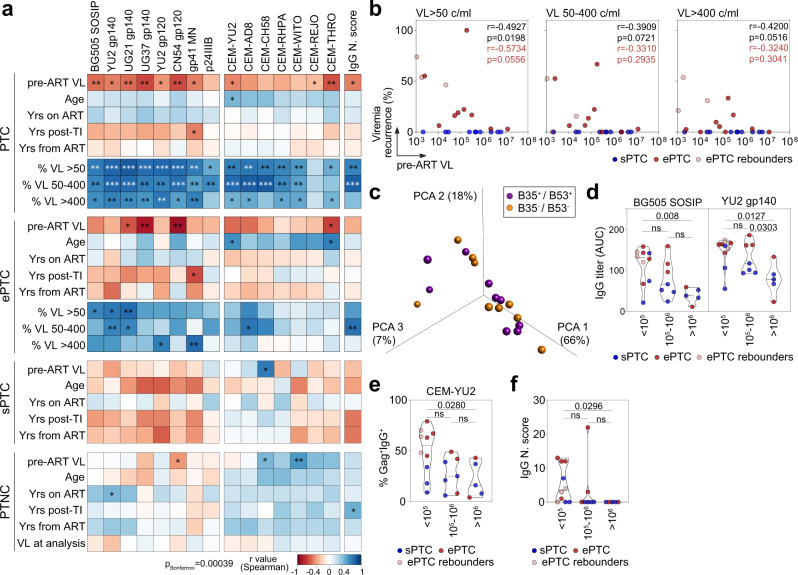
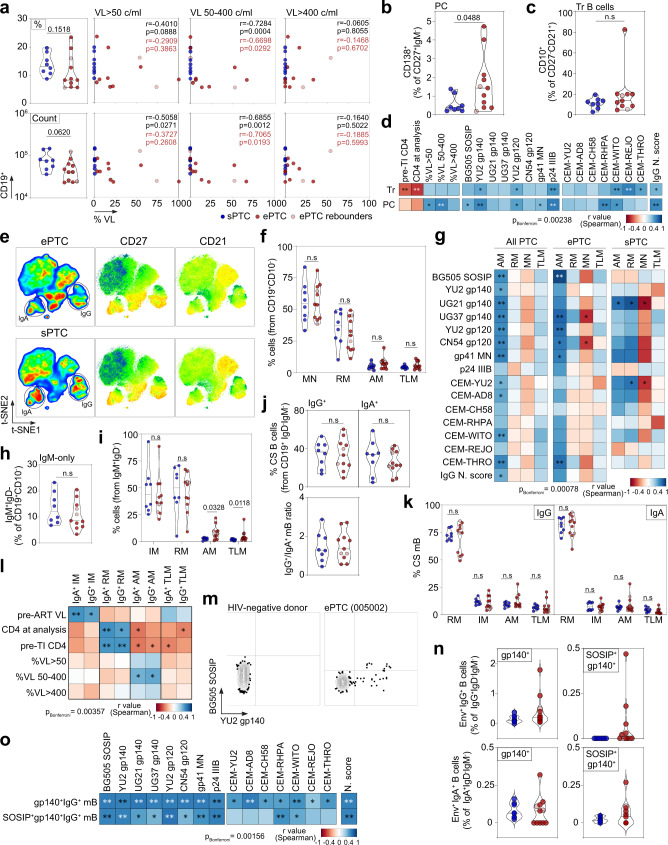
HIV-1 post-treatment controllers are rare individuals controlling HIV-1 infection for years after antiretroviral therapy interruption. Identification of immune correlates of control in post-treatment controllers could aid in designing effective HIV-1 vaccine and remission strategies. Here, we perform comprehensive immunoprofiling of the humoral response to HIV-1 in long-term post-treatment controllers. Global multivariate analyses combining clinico-virological and humoral immune data reveal distinct profiles in post-treatment controllers experiencing transient viremic episodes off therapy compared to those stably aviremic. Virally-exposed post-treatment controllers display stronger HIV-1 humoral responses, and develop more frequently Env-specific memory B cells and cross-neutralizing antibodies. Both are linked to short viremic exposures, which are also accompanied by an increase in blood atypical memory B cells and activated subsets of circulating follicular helper T cells. Still, most humoral immune variables only correlate with Th2-like circulating follicular helper T cells. Thus, post-treatment controllers form a heterogeneous group with two distinct viral behaviours and associated immune signatures. Post-treatment controllers stably aviremic present "silent" humoral profiles, while those virally-exposed develop functionally robust HIV-specific B-cell and antibody responses, which may participate in controlling infection.


Conflict of interest statement

The authors declare no competing interests.

Figures

Fig. 1
Fig. 1. Serum HIV-1 antibody responses in PTC and PTNC.
a Pie chart distinguishes the PTC experiencing transient viral loads (VL) over 50 copies/ml (ePTC, red, n = 12) from those stably aviremic (sPTC, blue, n = 10). b Violin plots showing the frequency of transient viremic episodes in ePTC (n = 12) according to VL. Light red dots indicate ePTC who resumed ART before the analysis (Supplementary Table 1). c Dot plots comparing the serum anti-Env and anti-p24 IgG titers (as area under the curve of ELISA optical density values (AUC)) between sPTC (blue, n = 10) and ePTC (red, n = 12) after treatment interruption (TI), and in PTNC (n = 20) before (light grey) and after TI (dark grey). Groups and PTNC timepoints were compared using two-tailed Mann–Whitney and Wilcoxon tests, respectively. p values are indicated. d Dot plots comparing HIV-1 VL in PTNC pre- and post-TI (n = 20). Average time post-TI is 1.73 years (Supplementary Table 1). e Dot plots comparing the IgG seroneutralizing activity against Bal.26 HIV-1 strain in PTNC pre- and post-TI (n = 20). Timepoints matched those in (c), and were compared using a two-tailed Wilcoxon test. f Graphs comparing the serum IgG antibody titers against HIV-1 Env and p24 proteins over time for the selected PTC (ePTC, red, n = 4; sPTC, blue, n = 1). Post-TI (1) corresponds to 2.07 [1–3.22] years after TI, post-TI (2) corresponds to 14.2 [12.7–18] years after TI, and M12 and M24 timepoints correspond to 12 and 24 months after post-TI (2), respectively. Donors 216001 and 200001 were “rebounders” who resumed to ART at post-TI (2) (Supplementary Table 1). g Bar graphs showing the IgG seroreactivity against clade B Env overlapping peptides as measured by ELISA in PTC sub-groups and PTNC post-TI. Each bar shows the cumulative IgG reactivity for all donors against a single peptide. Amino acid sequences on the top indicate immunodominant linear Env regions. Source data are provided as a Source Data file.
Fig. 2
Fig. 2. Neutralizing and ADCC activity of serum IgG antibodies from PTC and PTNC.
a Heatmap comparing the IgG seroneutralizing activity against a 14-viruses panel in PTC and PTNC. Darker red colors indicate lower IC50 values (µg/ml), while white indicates no neutralization. Grey cells correspond to non-tested purified IgG samples when not neutralizing in the screening panel (top). For each donor, the in vitro IgG neutralization score (N. score, see Methods) is indicated below the heatmap. b Heatmap comparing the IgG binding from PTC and PTNC to HIV-1-infected CEM.NKR-CCR5 cells. Darker blue colors indicate higher % of Gag+ cells bound by purified serum IgG antibodies, while white indicates no detectable binding. The background IgG reactivity against non-infected cells (NI) control is shown at the bottom. 10-1074 and mGO53 antibodies are positive and negative control, respectively. c Violin plots showing the human NK cell-mediated ADCC activity of serum IgG antibodies purified from PTC [ePTC (red); sPTC (blue)] and PTNC (grey) against CEM.NKR-CCR5 cells infected with laboratory-adapted YU2 (top) and T/F CH058 (bottom) virus. Each dot represents the mean of duplicate values for a single NK cell donor. Horizontal lines indicate the mean values for all NK cell donors (n = 8). d Dot plots comparing the mean % ADCC in sPTC (n = 10), ePTC (n = 12) and PTNC (n = 19). Individual groups were compared using 2-tailed Mann–Whitney test. e Correlation plots of the mean % ADCC and % CEM.NKR cell binding in PTC [ePTC (red, n = 12); sPTC (blue, n = 10)] and PTNC (grey, n = 19). f Correlation plots of the % ADCC and neutralization scores in PTC [ePTC (red, n = 12); sPTC (blue, n = 10)] and PTNC (grey, n = 19). Two-sided Spearman rho correlation coefficients and corresponding p values are indicated in (e) and (f). Asterisks in (ac) indicate ePTC rebounders. Source data are provided as a Source Data file.
Fig. 3
Fig. 3. Humoral immunoprofiling of PTC and PTNC.
a Correlograms showing the correlation analyses of the humoral immune parameters measured in PTC (top) and PTNC (bottom) including IgG antibody titers, binding to HIV-1-infected cells and neutralizing activity. For each pair of compared parameters, scatter plots are shown on top and two-sided Spearman rho correlation coefficients (color coded) at the bottom. The color scale indicates the strength and direction of the correlation. Blue indicates positive correlation; white indicates no correlation and red indicates negative correlation. Asterisks correspond to unadjusted p values. ***p < 0.0001, **p < 0.01, *p < 0.05. p values below the Bonferroni-corrected significance threshold (p = 0.00042) are highlighted in white. Detailed correlation results are presented in Supplementary Data 1. b 3D plot shows principal component analysis (PCA) of the humoral immune parameters measured in ePTC (red, n = 12) and sPTC (blue, n = 10) post-TI. c Bar graph shows the contribution to the first principal component (PCA1, as %) for each variable included in the PCA shown in (b). n = 28 variables examined over 22 samples. d Same as in (b) but including PTNC pre- (light grey, n = 20) and post-TI (dark grey, n = 20). e Same as in (c) but for the PCA shown in (d). n = 16 variables examined over 62 samples. f Dot plot comparing groups [ePTC (red, n = 12), sPTC (blue, n = 10), PTNC pre- (light grey, n = 20) and post-TI (dark grey, n = 20)] for the PCA1 contribution (%) of the PCA shown in (d). Source data are provided as a Source Data file.
Fig. 4
Fig. 4. Humoral immune correlates to viral rebounds in PTC.
a Heatmaps showing the correlation analyses combining measurements for the clinico-virological [viral load before ART (VL pre-ART), age, years on ART, years post-TI, years from ART, and recurrence of viremic episodes in percent (viral load measured as RNA copies/ml (VL) > 50, 50–400 or >400)] and serum antibody [IgG antibody titers, binding to HIV-1-infected cells and neutralization score (N. score)] parameters in PTC, PTC sub-groups and PTNC. Cells are color-coded according to the value of the two-sided Spearman rho correlation coefficient (r). The color indicates the strength and direction of the correlation. Blue indicates positive correlation; white indicates no correlation and red indicates negative correlation. Asterisks correspond to unadjusted p values. ***p < 0.0001, **p < 0.01, *p < 0.05. p values below the Bonferroni-corrected significance threshold (p = 0.00039) are highlighted in white. Detailed correlation results are presented in Supplementary Data 1. b Correlation plots of pre-ART VL and recurrence of viremic episodes (VL > 50, VL [50–400], and VL > 400) in sPTC (blue) and ePTC (red). Two-sided Spearman rho correlation coefficients and p values are indicated for all PTC (black, n = 22) and ePTC only (red, n = 12). c 3D plot shows the PCA of the humoral immune parameters measured in PTC carrying HLA class I B35/B53 alleles (purple) or not (orange). d Violin plots comparing the IgG antibody titers against BG505 SOSIP and YU2 gp140-F trimers according to pre-ART VL values (>105, [105, 106] and >106 RNA copies/ml). e Same as in (d) but for the IgG binding of YU2-infected target cells. f Same as in (e) but for the neutralization scores of serum IgG antibodies. ePTC (red, n = 10), sPTC (blue, n = 10), ePTC rebounders (light red, n = 3). Groups in (df) were compared using 2-tailed Mann–Whitney test. ns not significant. Source data are provided as a Source Data file.
Fig. 5
Fig. 5. B-cell subsets in HIV-1 PTC.
a Violin plots comparing the % (top) and absolute number (bottom) of total CD19+ lymphocytes between sPTC and ePTC. Correlation plots (right) show the % of total B cells vs viremia exposure frequency according to VL. r and p values are indicated for PTC (black) and ePTC only (red). b Violin plots comparing % of circulating plasma cells between sPTC (blue) and ePTC (red). c Same as in (b) but for transitional B cells. d Correlation matrixes of transitional B-cell and circulating plasma cell frequencies with CD4+ T-cell count, viremia exposure frequency, and serological parameters. e t-SNE pseudocolor plots of concatenated CD19+CD10 B cells in ePTC (top) and sPTC (bottom), with statistic heatmaps presenting CD27 and CD21 staining intensities. f Violin plot comparing CD19+CD10 B-cell subset frequencies in PTC sub-groups: MN (mature naïve), RM (resting memory), AM (activated memory), TLM (tissue-like memory). g Heatmaps showing the correlation analyses between memory B-cell subsets and serological antibody parameters in PTC and sub-groups. h Violin plots comparing IgM+-only B-cell frequencies between ePTC (red) and sPTC (blue). i Same as in (h) but for IgM+ memory B-cell subsets. j Same as in (h) but for IgG+ and IgA+ memory B cells. Violin plot (bottom) comparing IgG/IgA ratios. k Same as in (f) but for IgG+ and IgA+ B-cell subsets. l Same as in (g) but for the clinico-virological parameters and IgA-/IgG-class switched B-cell subsets. m Representative flow cytograms showing blood B cells stained with Env trimers. n Violin plots comparing % of gp140+ and gp140+SOSIP+ IgG+/IgA+ B cells between ePTC and sPTC. o Heatmaps showing the correlation analyses between Env+ IgG+ B cells and serological parameters. In violin plots, groups were compared using 2-tailed Mann–Whitney test [ePTC (n = 11), sPTC (n = 8), light red dots: ePTC rebounders]. Significant p values are indicated. ns not significant. In correlation matrixes, cells are color-coded according to r values. Unadjusted p values: ***p < 0.0001, **p < 0.01, *p < 0.05. p values below the Bonferroni-corrected significance threshold are highlighted in white. Correlation results are detailed in Supplementary Data 1. Source data are provided as a Source Data file.
Fig. 6
Fig. 6. cTfh-cell subsets in HIV-1 PTC.
a Violin plots comparing the % and absolute number of blood CXCR5+CD4+ T cells between ePTC (red, n = 9) and sPTC (blue, n = 8). b Violin plots comparing the frequencies of CCR7+, ICOS+, PD1+, PD1hi and ICOS+PD1+ CXCR5+CD4+ T cells between sPTC and ePTC. c Correlation plot shows the % CD19+ B cells vs blood CXCR5+CD4+ T cells. d Correlation plots showing the % CXCR5+PD1hiCD4+ T cells vs CD4+ T-cell absolute number, % IgG+ RM and TLM B cells. Two-sided Spearman rho correlation coefficients and corresponding p values are indicated in (cd). e Violin plots comparing blood CXCR3+ and CXCR3 CXCR5+CD4+ T-cell frequencies in PTC. A representative flow cytometric histogram is shown (left). f Violin plots comparing the % blood CXCR3+ and CXCR3 CXCR5+CD4+ T cells expressing PD1, PD1hi or ICOS. + and − indicates the cell surface detection of the marker or not, respectively. g Violin plots comparing the frequencies of circulating blood CXCR3+CXCR5+CD4+ Tfh (cTfh)-cell subsets between sPTC and ePTC. h Same as in (g) but for the CXCR3 cTfh-cell subsets. Groups in (ah) were compared using 2-tailed Mann-Whitney test. Significant p values are indicated. ns not significant. Light red dots indicate ePTC rebounders in violin plots (panels ah). i PCA 2D-plot shows the B-cell and cTfh-cell related variables discriminating ePTC (red, n = 9) from sPTC (blue, n = 8). The two first dimensions account for 57.8% of the variability. The location of the variables is associated with the distribution of the donors. ePTC rebounder 200001 is shown in red light. j Heatmap shows the unsupervised hierarchical cluster analysis of the variables shown in (i) using standardized z score values. Top red and blue squares correspond to ePTC and sPTC, respectively. ePTC rebounder 200001 is indicated by an asterisk. k Correlation plots comparing the frequency of gp140+SOSIP+IgG+ B-cell and cTfh-cell subsets. ePTC (red, n = 9) from sPTC (blue, n = 8). Two-sided Spearman rho correlation coefficients and corresponding p values are indicated for all PTC (black, n = 17) and ePTC only (red, n = 9). Source data are provided as a Source Data file.
Fig. 7
Fig. 7. Humoral immune parameters differentiating ePTC and sPTC.
a Correlation matrixes showing the correlation analyses between activated cTfh-cell subsets (%) and selected clinico-virological and humoral parameters measured in PTC. b Same as in (a) but for the Th1, Th2 and Th17-like cTfh-cell subsets in ePTC and sPTC. Cells are color-coded according to the value of two-sided Spearman rho correlation coefficients. Asterisks correspond to unadjusted p values. ***p < 0.0001, **p < 0.01, *p < 0.05. p values below the Bonferroni-corrected significance threshold are highlighted in white. Detailed correlation results are presented in Supplementary Data 1. c PCA 2D-plot shows B-cell, cTfh-cell, and serological antibody related variables discriminating ePTC (red, n = 9) from sPTC (blue, n = 8). The two first dimensions account for 57.5% of the variability. The location of the variables is associated with the distribution of the donors. ePTC rebounder 200001 is shown in light red. d Heatmap shows the unsupervised hierarchical cluster analysis of the variables shown in (c) using standardized z score values. Top red and blue squares correspond to ePTC and sPTC, respectively. ePTC rebounder 200001 is indicated by an asterisk.

Similar articles

Cited by

References

    1. Sáez-Cirión, A. et al. Post-Treatment HIV-1 Controllers with a Long-Term Virological Remission after the Interruption of Early Initiated Antiretroviral Therapy ANRS VISCONTI Study. PLoS Pathogens9, 10.1371/journal.ppat.1003211 (2013). - PMC - PubMed
    1. Ananworanich J, Dube K, Chomont N. How does the timing of antiretroviral therapy initiation in acute infection affect HIV reservoirs? Curr. Opin. HIV AIDS. 2015;10:18–28. - PMC - PubMed
    1. Jensen SS, et al. HIV-Specific Antibody-Dependent Cellular Cytotoxicity (ADCC) -mediating antibodies decline while NK Cell Function Increases during Antiretroviral Therapy (ART) PLoS ONE. 2015;10:e0145249. - PMC - PubMed
    1. Krebs SJ, Ananworanich J. Immune activation during acute HIV infection and the impact of early antiretroviral therapy. Curr. Opin. HIV AIDS. 2016;11:163–172. - PubMed
    1. Moir S, et al. B cells in early and chronic HIV infection: Evidence for preservation of immune function associated with early initiation of antiretroviral therapy. Blood. 2010;116:5571–5579. - PMC - PubMed

Publication types

Substances