. 2022 Apr 11;13(1):1982.
doi: 10.1038/s41467-022-29175-x.

Single-cell RNA sequencing coupled to TCR profiling of large granular lymphocyte leukemia T cells

Affiliations

Single-cell RNA sequencing coupled to TCR profiling of large granular lymphocyte leukemia T cells

Shouguo Gao et al. Nat Commun. .

Abstract

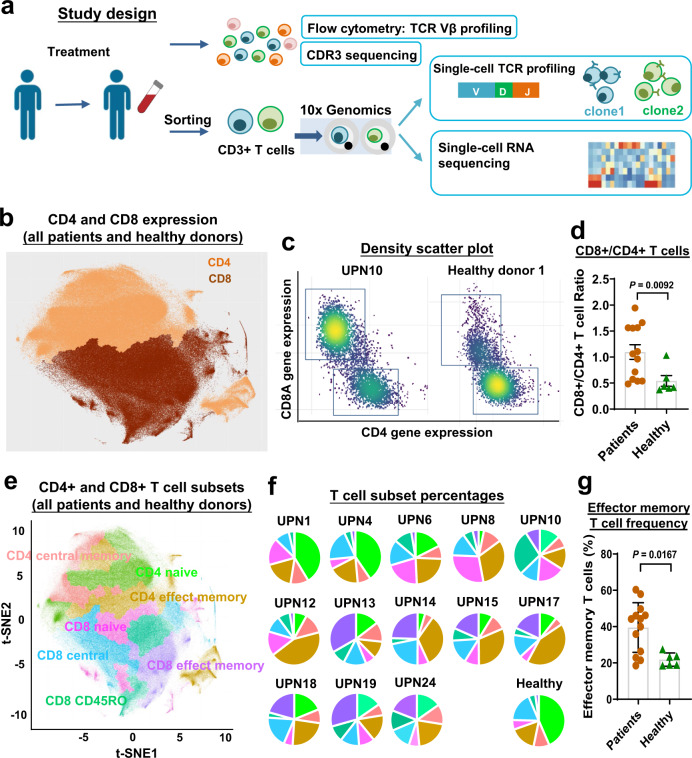
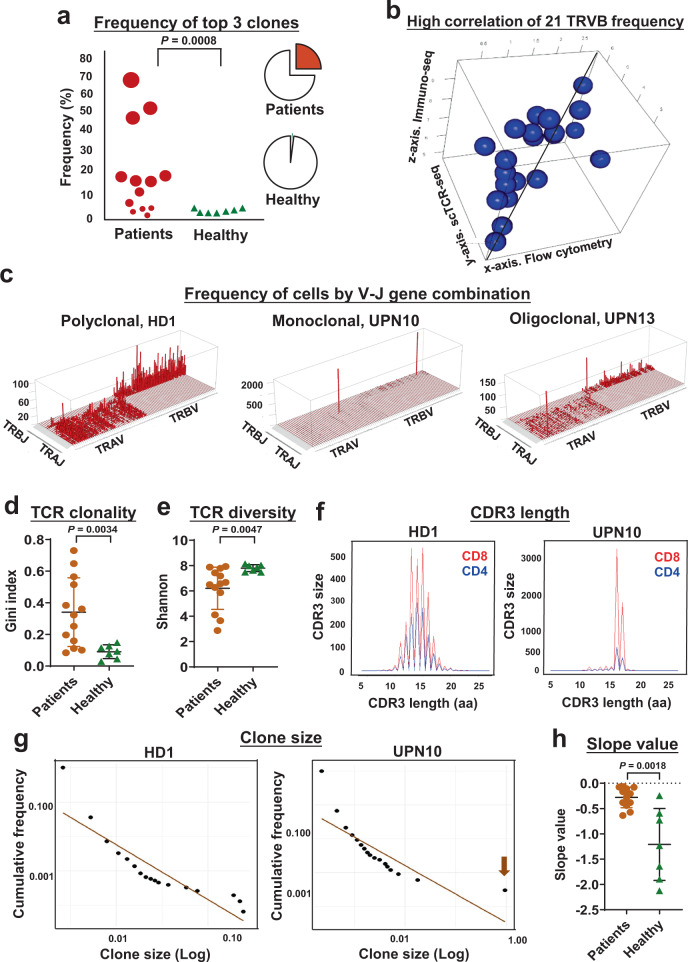
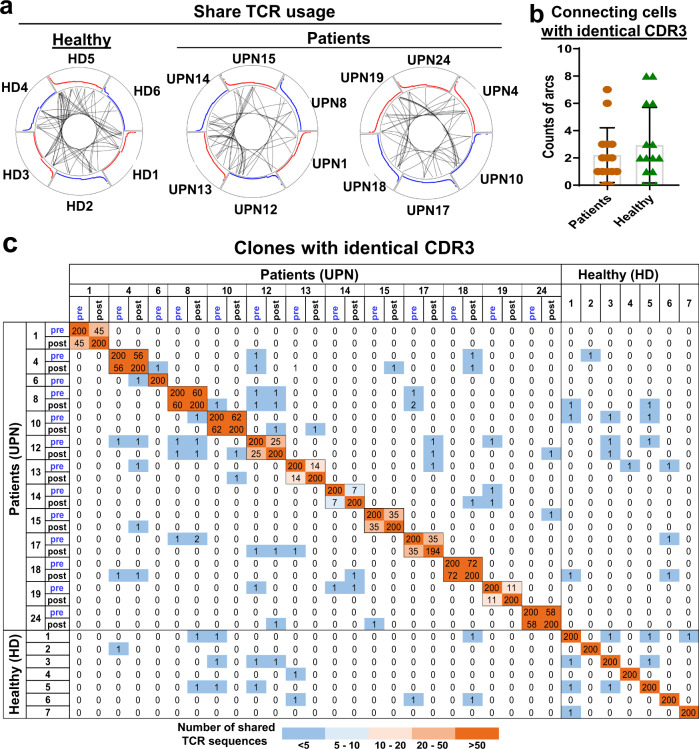
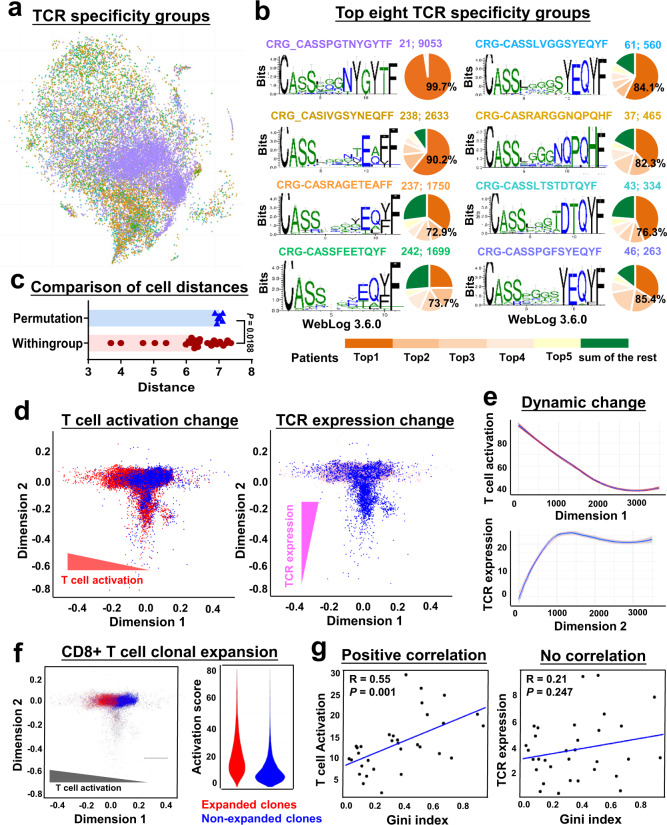
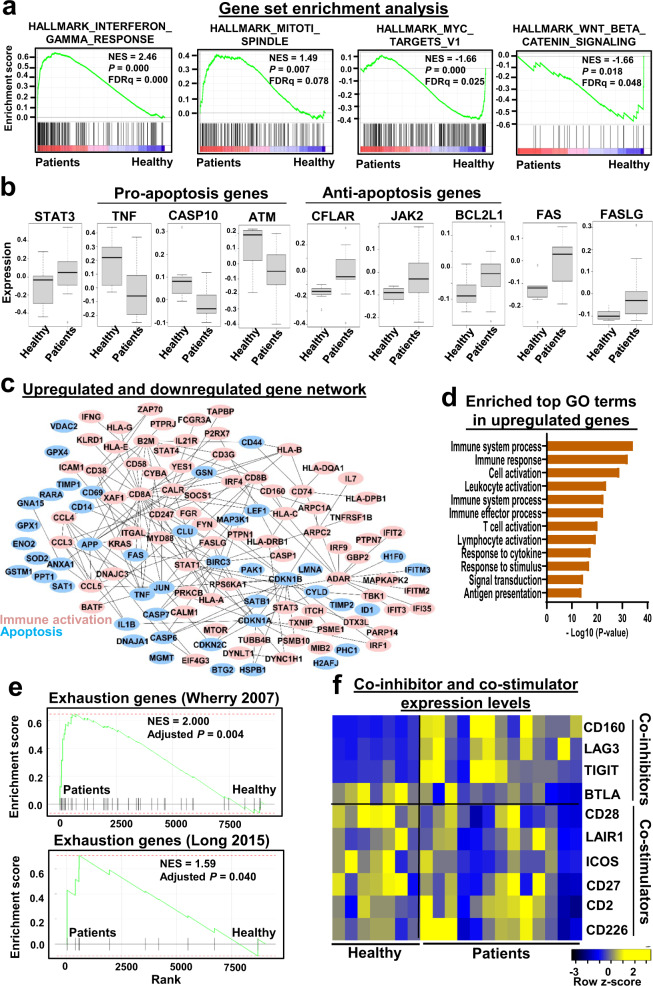
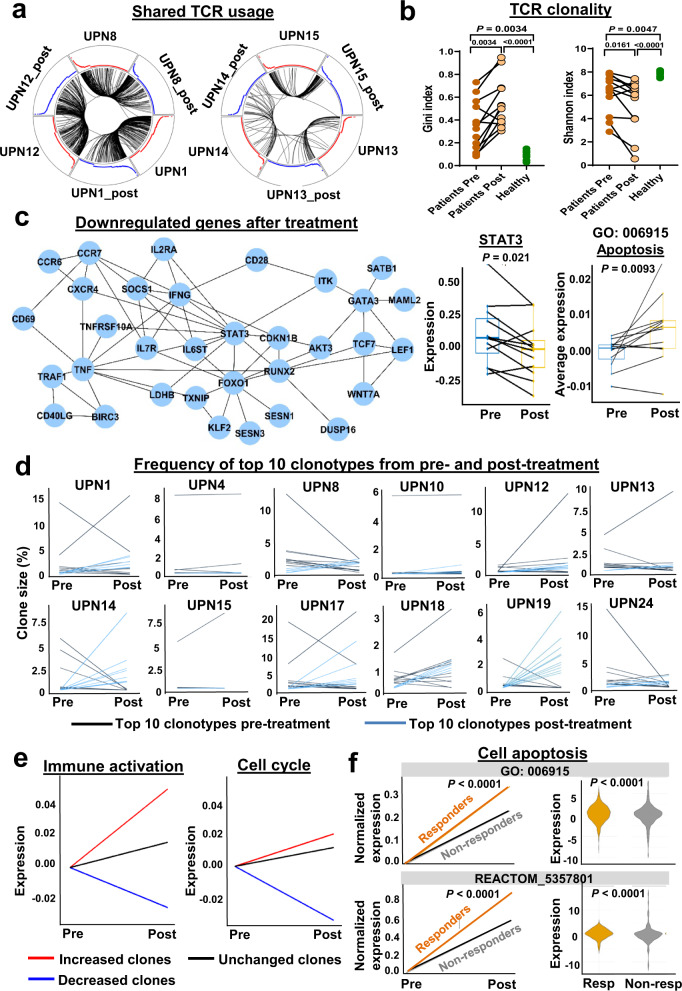
T-cell large granular lymphocyte leukemia (T-LGLL) is a lymphoproliferative disease and bone marrow failure syndrome which responds to immunosuppressive therapies. We show single-cell TCR coupled with RNA sequencing of CD3+ T cells from 13 patients, sampled before and after alemtuzumab treatments. Effector memory T cells and loss of T cell receptor (TCR) repertoire diversity are prevalent in T-LGLL. Shared TCRA and TCRB clonotypes are absent. Deregulation of cell survival and apoptosis gene programs, and marked downregulation of apoptosis genes in CD8+ clones, are prominent features of T-LGLL cells. Apoptosis genes are upregulated after alemtuzumab treatment, especially in responders than non-responders; baseline expression levels of apoptosis genes are predictive of hematologic response. Alemtuzumab does not attenuate TCR clonality, and TCR diversity is further skewed after treatment. Inferences made from analysis of single cell data inform understanding of the pathophysiologic mechanisms of clonal expansion and persistence in T-LGLL.


Conflict of interest statement

The authors declare no competing interests.

Figures

Fig. 1
Fig. 1. A T cell landscape in T-LGLL patients.
a A scheme of experimental study design. b A t-distributed Stochastic Neighbor Embedding (t-SNE) plot of single-cell gene expression of T cells in all patients and healthy donors, colored by CD4+ and CD8+ T cell clusters. c Density scatter plots of CD4 and CD8A expression in T cells, generated using scRNA-seq results. x-axis, CD4 gene expression; y-axis, CD8A gene expression; dots were colored by cell density. d A CD8+/CD4+ T cell ratio was compared between patients (n = 13) and healthy donors (n = 6). Data are presented as mean values ± SEM; two-sided unpaired Mann–Whitney test. P value = 0.0092. e The same t-SNE plot in (b), color coded for CD4+ and CD8+ T cell subsets. f Pie charts showing percentages of T cell subsets in individual patients and healthy donors; color scheme as in (e). g Percentages of effector memory T cells were compared to patients (n = 13) and healthy donors (n = 6). Data are presented as mean values ±  SEM; two-sided unpaired Mann–Whitney test, P value = 0.0167.
Fig. 2
Fig. 2. Loss of TCR repertoire diversity in T-LGLL patients.
a Dot plot showing frequency of a sum of top 3 clones in individual patients and healthy donors. Dot sizes are proportional to frequency of top 3 clones. Pie charts on the right show medium percentages of a sum of the top 3 clones (red parts) in patients (top) and healthy donors (bottom). Two-sided unpaired t-test. P value =  0.0008. b Three-dimensional dot plot showing high correlation of frequency of 21 TRVB detected by flow cytometry (x-axis), scTCR-seq (y-axis) and immuno-seq (z-axis) in individual patients with an average correlation coefficient of 0.503. c Skyscraper plots showing Vβ/Vα and matching Jβ/Jα in healthy donor 1 (HD1) and representative patients (UPN10 and UPN13). Gini index (d) and Shannon index (e) of TCR clonality were compared in patients (n = 13) and healthy donors (n = 7). Data are presented as mean values ±  SEM; two-sided unpaired Mann–Whitney test. P value = 0.0167 (d) and P value = 0.0047 (e). f CDR3 lengths of representative HD1 and patient UPN10 were plotted, with CDR3 lengths in amino acid (aa) on the x-axis and frequency (CDR3 size) on the y-axis (overlapped curves showing CD8+ and CD4+ T cells in red and blue, respectively). g Clone sizes were plotted in HD1 and UPN10, with log clone sizes on the x-axis and log cumulative frequency on the y-axis. h Slope values of power-law fitting plots were compared in all patients (n = 13) and healthy donors (n = 7); plots of all individuals are shown in Supplementary Figs. 6 and 7. Data are presented as mean values ± SEM; two-sided unpaired Mann–Whitney test. P value = 0.0018.
Fig. 3
Fig. 3. Lack of common TCRA and TCRB clonotypes in T-LGLL patients.
a Circos plots are shown: segments in circles represent individual cells yielding rearranged TCR sequences. Black lines connected clones sharing identical CDR3 sequences among individuals. Sharing of identical CDR3 sequences among six healthy donors (HD1–HD6) is shown on the left; sharing of identical CDR3 sequences among patients (UPNs 1, 8, 12, 13, 14, and 15) and patients (UPNs 4, 10, 17, 18, 19 and 24) on the right. Red and blue curves are proportional to clone sizes. b Counts of arcs connecting cells with identical CDR3 sequences among patients (n = 13) and healthy donors (n = 7) were compared pair-wisely, and there was no significant difference. Data are presented as mean values ± SEM; two-sided unpaired Mann–Whitney test. c Heatmap plot showing shared CDR3 sequences among the top 200 TCR clones of patients and healthy donors. On both x- and y-axes, samples of patients and healthy donors are listed, and adjacent grids show paired samples (pre- and post-treatments) of the same patients. Counts of identical TCR clones shared among samples are shown. Color scheme, ranging from dark orange to dark blue, indicates the number of shared TCR CDR3 sequences, from high to low.
Fig. 4
Fig. 4. TCR usage and activation stages shape T cell phenotypes.
a The same t-SNE plot in Fig. 1b with single T cells from all patients and healthy donors, colored by TCR specificity groups identified by GLIPH. b Sequences and corresponding weblogs of top eight TCR specificity groups with more than five different CDRs. In each panel, pie chart on the right indicates percentages for this TCR specificity group in top 5 patients (number in a black color) and in all other patients. In numbers A; B following CRG sequences, A indicates the number of clones contained in the CRG, B indicates the frequency of this CRG in all cells. c Distances of cells within the same TCR specificity group were compared to permutated distances of any random cells in the t-SNE plot; two-sided unpaired Mann–Whitney test. P value = 0.0188. d Diffusion maps to visualize components of CD8+ T cell phenotype variation from all patients and healthy donors. Each dot represents a CD8+ T cell. T cell activation, TCR expression, and all other cells are colored in red, pink, and blue, respectively, with dimension 1 on x-axis and dimension 2 on y-axis. Diffusion maps showing dynamic changes of T cell activation on dimension 1 (left, in red) and TCR expression on dimension 2 (right, in pink). e Curves indicate dynamic changes of T cell activation and TCR expression along on dimension 1 and dimension 2 revealed on diffusion maps, respectively. x-axis, dimensions on diffusion maps; y-axis, imputed expression of T cell activation (top, in red) and TCR expression (bottom, in pink) components. Solid lines in red and pink represent 5–95% interval, illustrated by shaded areas; blue line shows a medium. f Diffusion map of CD8+ T cells on dimension 1 and dimension 2, and colored by clonal expansion (red for expanded clones). Higher activation is observed in expanded clones than in non-expanded clones (a violin plot on the right). g Gini index positively correlated with T cell activation (left) but not with TCR expression (right). Each dot indicates one sample. A Pearson correlation test.
Fig. 5
Fig. 5. Dysregulated gene programs in T-LGLL.
a Gene Set Enrichment Analysis (GSEA) plots of differentially expressed genes in T-LGLL patients compared with those in healthy donors. GESA based on a Kolmogorov Smirnov test. b Boxplots showing expression of pro-apoptosis and anti-apoptosis genes in T-LGLL patients (n = 13) compared with those in healthy donors (n = 7). Shown are 25–75% response ranges (top and bottom lines of boxes) and minima and maxima (bars). A the two-sided unpaired t-test. c A network of upregulated genes involved in the immune response and cell survival, and downregulated genes involved in apoptosis in T-LGLL patients. d Bar chart showing top GO terms enriched in upregulated genes in expanded clones compared to those in non-expanded clones in T-LGLL, Fisher’s exact test. e GSEA plots of T cell exhaustion genes in T-LGLL patients compared with those in healthy donors. T cells in patients consistently expressed higher levels of exhaustion markers, gene lists were from two previous publications,. GESA is based on a Kolmogorov Smirnov test. f T cells in patients did not consistently express higher levels of co-stimulators or lower levels of co-inhibitors.
Fig. 6
Fig. 6. Immunosuppressive treatment modulates clonality and gene expression in T-LGLL.
a Shown were circos plots, where segments in circles represent individual cells yielding rearranged TCR sequences among patients or between two visits of patients. Black lines indicate arcs connecting cells sharing identical CDR3 sequences. Left and right plots show sharing of identical CDR3 sequences among UPNs 1, 8, and 12, and UPNs 13, 14 and 15, respectively. Red and blue curves are proportional to clone sizes in samples before and after treatment, respectively. b Gini index and a Shannon index of TCR clonality were compared in patients (pre- and post-treatment) and with healthy donors. Gini index was still significantly higher (0.547 ± 0.215, P < 0.001) and Shannon index significantly lower (5.21 ± 2.25, P = 0.002) when compared with those of healthy controls. A two-sided Wilcoxon test between patients’ samples before and after treatment (n = 12); two-sided unpaired Mann–Whitney between patients (n = 13) and healthy donors (n = 7); P values shown in the figure. c A module of downregulated genes identified by jActiveModulesTopo in T-LGLL patients after treatment, including STAT3; dynamic changes of expression levels of STAT3 and apoptosis genes (GO: 006915) pre- and post-treatment in T-LGLL patients (n = 12). Shown are 25–75% response ranges (top and bottom lines of boxes) and minima and maxima (bars). P values with two-sided paired t-test were shown in figures. d Shown are percentages of top ten TCR clonotypes from pre- and post-treatment samples at different time points. Black lines indicate top ten clones pre-treatment; blue lines indicate top ten clones post-treatment those were not among top ten pre-treatment. e Expression changes of immune activation genes and cell cycle genes of increased, decreased and stable clones after alemtuzumab. f Left, expression changes of apoptosis genes (averaged) in responders and non-responders after treatment with alemtuzumab. x-axis, two time points, pre- and post-treatments; y-axis, adjusted expression levels of apoptosis genes to set pre-treatment values of apoptosis gene expression as zero in both responders and non-responders. Right, expression levels of apoptosis genes before treatment in responders (Resp) and non-responders (Non-resp); two-sided unpaired t-test; P < 0.0001 [as software generated P < 0.0001, exact P value not available].

References

    1. Dumitriu B, et al. Alemtuzumab in T-cell large granular lymphocytic leukaemia: interim results from a single-arm, open-label, phase 2 study. Lancet Haematol. 2016;3:e22–e29. - PMC - PubMed
    1. Lamy T, Moignet A, Loughran TP., Jr LGL leukemia: from pathogenesis to treatment. Blood. 2017;129:1082–1094. - PubMed
    1. Shah MV, et al. Molecular profiling of LGL leukemia reveals role of sphingolipid signaling in survival of cytotoxic lymphocytes. Blood. 2008;112:770–781. - PMC - PubMed
    1. Giudice V, et al. Deep sequencing and flow cytometric characterization of expanded effector memory CD8(+)CD57(+) T cells frequently reveals T-cell receptor Vbeta oligoclonality and CDR3 homology in acquired aplastic anemia. Haematologica. 2018;103:759–769. - PMC - PubMed
    1. Sandberg Y, et al. Lack of common TCRA and TCRB clonotypes in CD8(+)/TCRalphabeta(+) T-cell large granular lymphocyte leukemia: a review on the role of antigenic selection in the immunopathogenesis of CD8(+) T-LGLL. Blood Cancer J. 2014;4:e172. - PMC - PubMed

Publication types

MeSH terms