Meta-Analysis
. 2022 Apr 11;12(1):6030.
doi: 10.1038/s41598-022-09821-6.

rs-fMRI and machine learning for ASD diagnosis: a systematic review and meta-analysis

Affiliations
Meta-Analysis

rs-fMRI and machine learning for ASD diagnosis: a systematic review and meta-analysis

Caio Pinheiro Santana et al. Sci Rep. .

Abstract

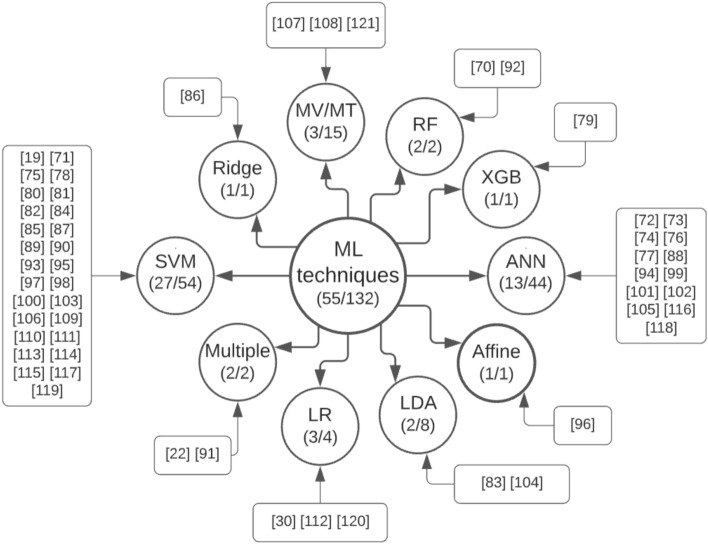
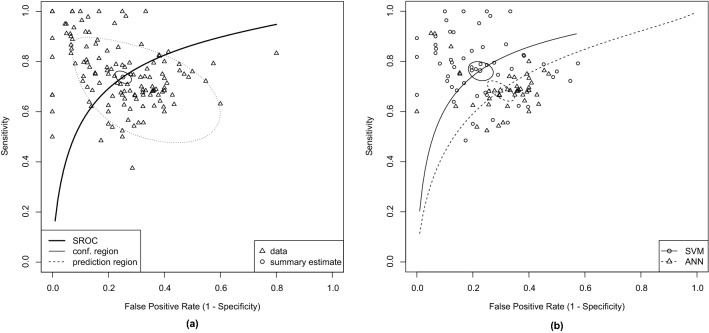
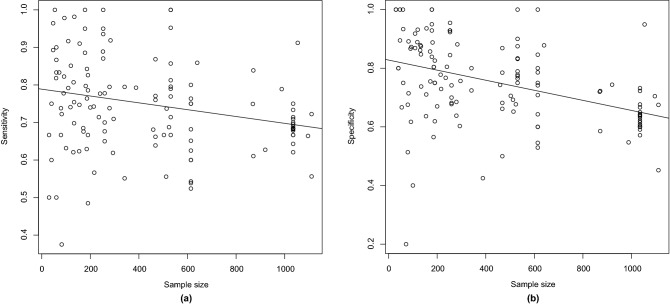
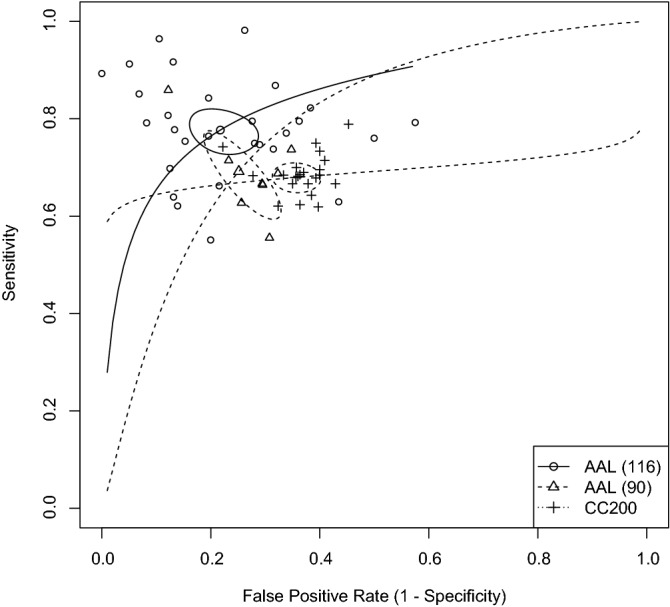
Autism Spectrum Disorder (ASD) diagnosis is still based on behavioral criteria through a lengthy and time-consuming process. Much effort is being made to identify brain imaging biomarkers and develop tools that could facilitate its diagnosis. In particular, using Machine Learning classifiers based on resting-state fMRI (rs-fMRI) data is promising, but there is an ongoing need for further research on their accuracy and reliability. Therefore, we conducted a systematic review and meta-analysis to summarize the available evidence in the literature so far. A bivariate random-effects meta-analytic model was implemented to investigate the sensitivity and specificity across the 55 studies that offered sufficient information for quantitative analysis. Our results indicated overall summary sensitivity and specificity estimates of 73.8% and 74.8%, respectively. SVM stood out as the most used classifier, presenting summary estimates above 76%. Studies with bigger samples tended to obtain worse accuracies, except in the subgroup analysis for ANN classifiers. The use of other brain imaging or phenotypic data to complement rs-fMRI information seems promising, achieving higher sensitivities when compared to rs-fMRI data alone (84.7% versus 72.8%). Finally, our analysis showed AUC values between acceptable and excellent. Still, given the many limitations indicated in our study, further well-designed studies are warranted to extend the potential use of those classification algorithms to clinical settings.


Conflict of interest statement

The authors declare no competing interests.

Figures

Figure 1
Figure 1
Screening and selection of studies according to inclusion and exclusion criteria at different stages of the meta-analysis. The numbers between parentheses indicate the total of articles remaining after each step. The numbers separated by + indicate the count of articles from the first and second search, respectively. Created with Lucidchart Free https://www.lucidchart.com.
Figure 2
Figure 2
Distribution of the selected studies by year of publication and type of ML technique used (MV/MT multiview/multitask learning, RF Random Forest, LR Logistic Regression; LDA Linear Discriminant Analysis). The numbers inside the bars indicate each article. Created with Microsoft Excel 2019.
Figure 3
Figure 3
Conceptual map of ML techniques used throughout the articles selected for meta-analysis (number of articles/number of samples). Created with Lucidchart Free https://www.lucidchart.com.
Figure 4
Figure 4
Risk of bias and applicability concerns by domain in QUADAS-2 for all the studies selected for the systematic review (left) and considering only the ones included in the meta-analysis (right). Created with Microsoft Excel 2019.
Figure 5
Figure 5
SROC curves of all the included studies with summary estimate (a) and the studies using SVM and ANN with their summary estimates and confidence region (b). Created with R Statistics version 4.1.1 using the package mada version 0.5.10.
Figure 6
Figure 6
Linear regression models with sample size predicting sensitivity (a) and specificity (b) for all the studies. Created with R Statistics version 4.1.1 using the package mada version 0.5.10.
Figure 7
Figure 7
SROC curves of the studies using AAL90, AAL116, or CC200 with their summary estimates and confidence regions. Created with R Statistics version 4.1.1 using the package mada version 0.5.10.

References

    1. Rapin I, Tuchman RF. Autism: Definition, neurobiology, screening, diagnosis. Pediatr. Clin. N. Am. 2008;55:1129–1146. doi: 10.1016/j.pcl.2008.07.005. - DOI - PubMed
    1. Hahler E-M, Elsabbagh M. Autism: A global perspective. Curr. Dev. Disord. Rep. 2015;2:58–64. doi: 10.1007/s40474-014-0033-3. - DOI
    1. American Psychiatric Pub . Diagnostic and Statistical Manual of Mental Disorders. 5. American Psychiatric Pub; 2013.
    1. Geschwind DH, State MW. Gene hunting in autism spectrum disorder: On the path to precision medicine. The Lancet Neurol. 2015;14:1109–1120. doi: 10.1016/S1474-4422(15)00044-7. - DOI - PMC - PubMed
    1. Jahedi A, Nasamran CA, Faires B, Fan J, Müller R-A. Distributed intrinsic functional connectivity patterns predict diagnostic status in large autism cohort. Brain Connect. 2017;7:515–525. doi: 10.1089/brain.2017.0496. - DOI - PMC - PubMed

Publication types