. 2022 Apr;28(4):752-765.
doi: 10.1038/s41591-022-01749-8. Epub 2022 Apr 11.

Stratification of radiosensitive brain metastases based on an actionable S100A9/RAGE resistance mechanism

Cátia Monteiro #  1 Lauritz Miarka #  1 María Perea-García  1 Neibla Priego  1 Pedro García-Gómez  1 Laura Álvaro-Espinosa  1 Ana de Pablos-Aragoneses  1 Natalia Yebra  1 Diana Retana  1 Patricia Baena  1 Coral Fustero-Torre  2 Osvaldo Graña-Castro  2 Kevin Troulé  2 Eduardo Caleiras  3 Patricia Tezanos  4 Pablo Muela  4 Elisa Cintado  4 José Luis Trejo  4 Juan Manuel Sepúlveda  5 Pedro González-León  6 Luis Jiménez-Roldán  6   7 Luis Miguel Moreno  6 Olga Esteban  6 Ángel Pérez-Núñez  6   7 Aurelio Hernández-Lain  8 José Mazarico Gallego  9 Irene Ferrer  10   11 Rocío Suárez  10   11 Eva M Garrido-Martín  10   11 Luis Paz-Ares  9   10   11   12 Celine Dalmasso  13 Elizabeth Cohen-Jonathan Moyal  13 Aurore Siegfried  14 Aisling Hegarty  15 Stephen Keelan  15 Damir Varešlija  15 Leonie S Young  15 Malte Mohme  16 Yvonne Goy  17 Harriet Wikman  18 Jose Fernández-Alén  19 Guillermo Blasco  19 Lucía Alcázar  19 Clara Cabañuz  20 Sergei I Grivennikov  21   22 Andrada Ianus  23 Noam Shemesh  23 Claudia C Faria  24   25 Rebecca Lee  26   27 Paul Lorigan  26   27 Emilie Le Rhun  28 Michael Weller  28 Riccardo Soffietti  29 Luca Bertero  30 Umberto Ricardi  31 Joaquim Bosch-Barrera  32   33   34 Elia Sais  32   33 Eduard Teixidor  32   33 Alejandro Hernández-Martínez  32   33 Alfonso Calvo  11   35 Javier Aristu  36 Santiago M Martin  37 Alvaro Gonzalez  38 Omer Adler  39 Neta Erez  39 RENACERManuel Valiente  40
Collaborators, Affiliations

Stratification of radiosensitive brain metastases based on an actionable S100A9/RAGE resistance mechanism

Cátia Monteiro et al. Nat Med. 2022 Apr.

Abstract

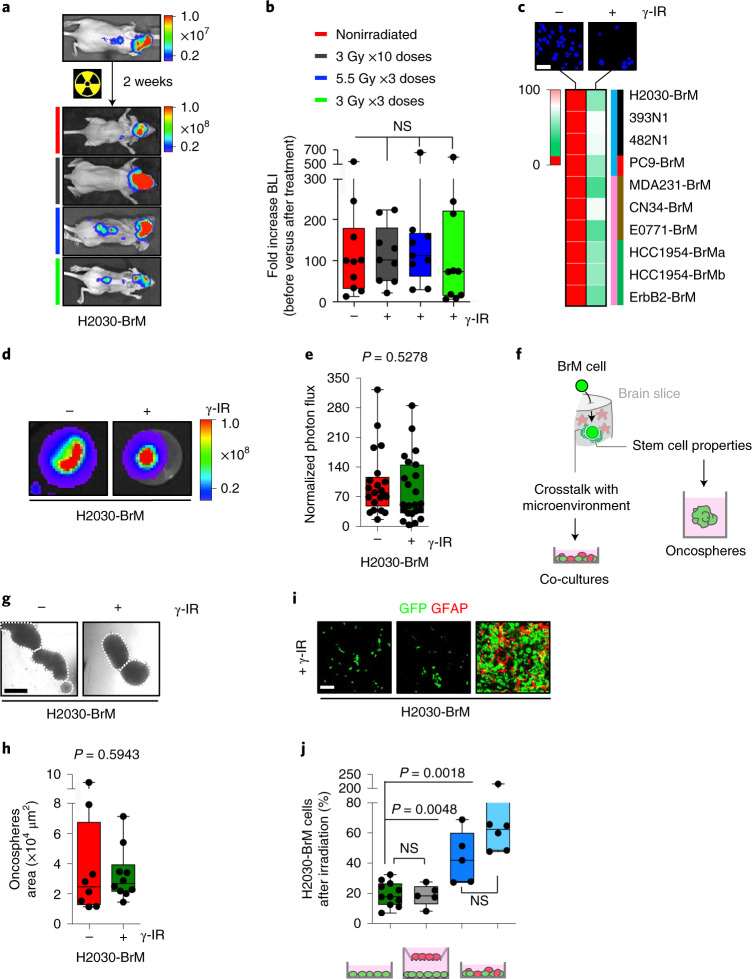
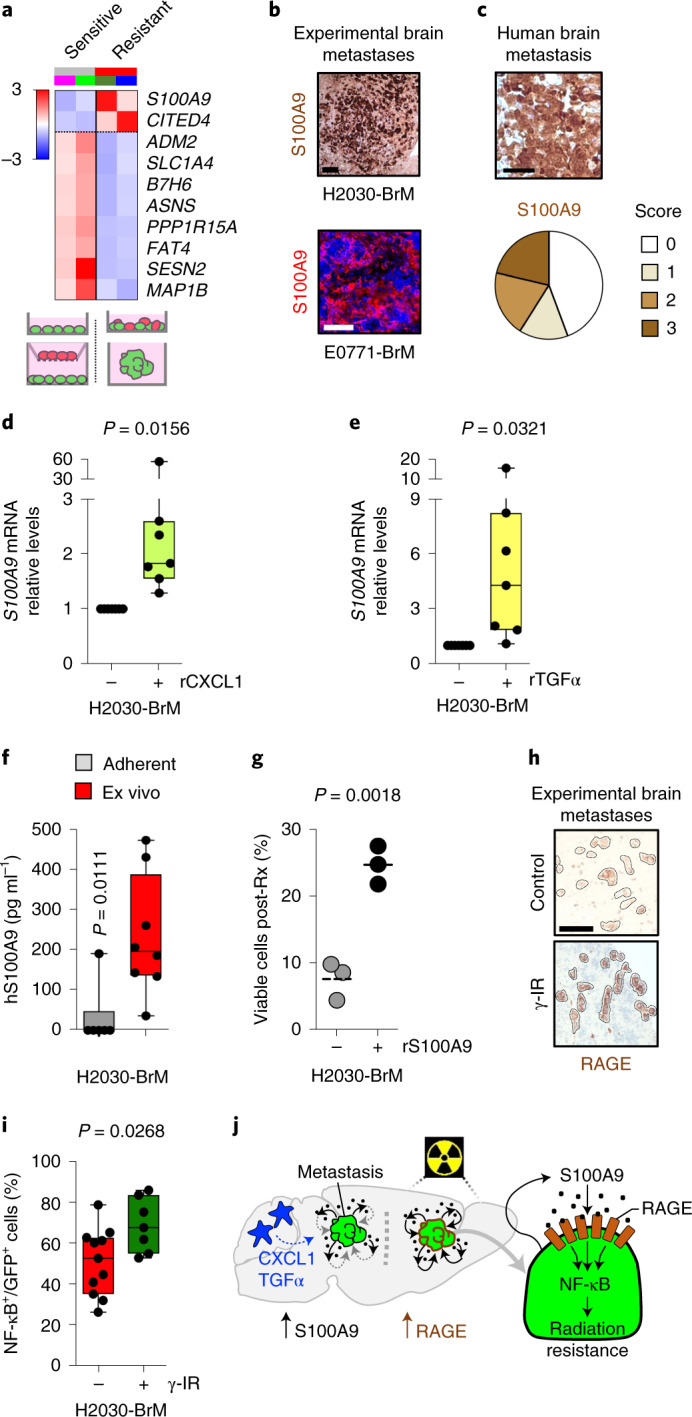
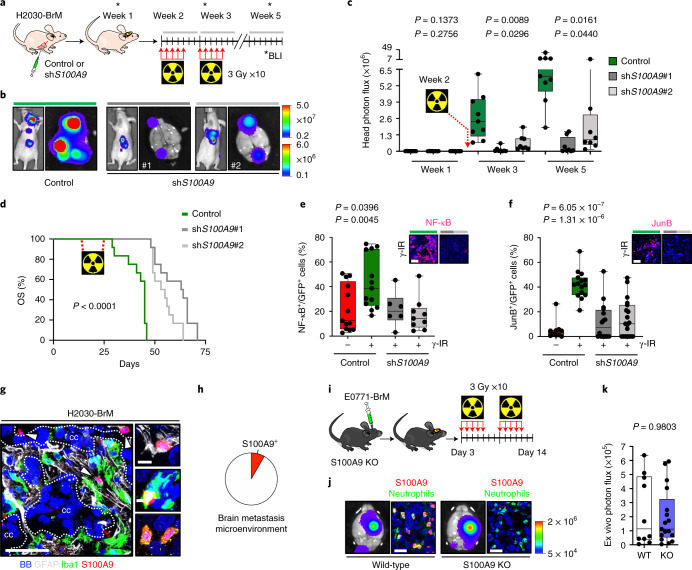
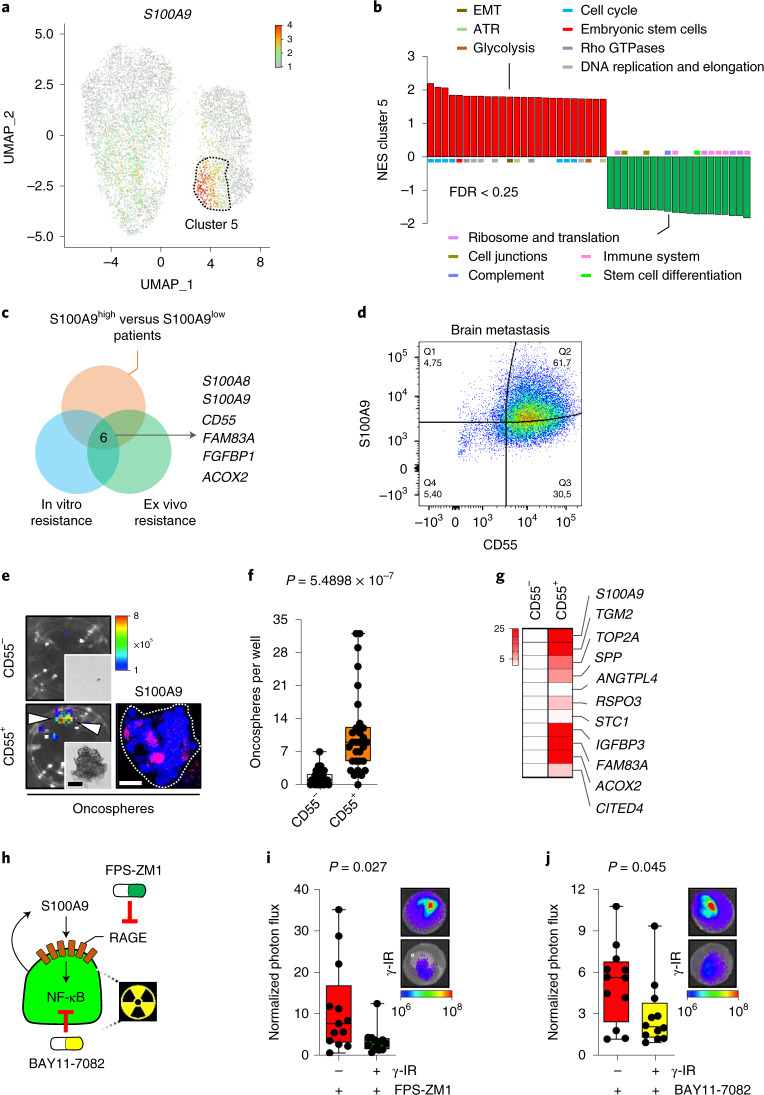
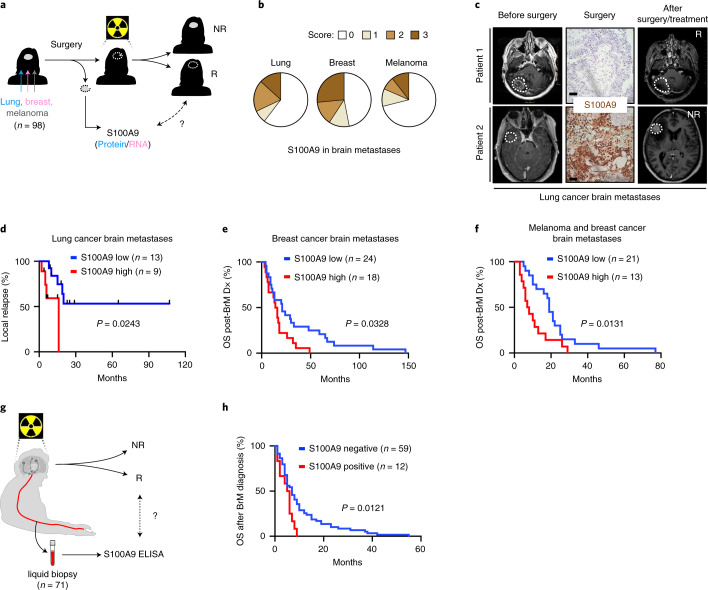
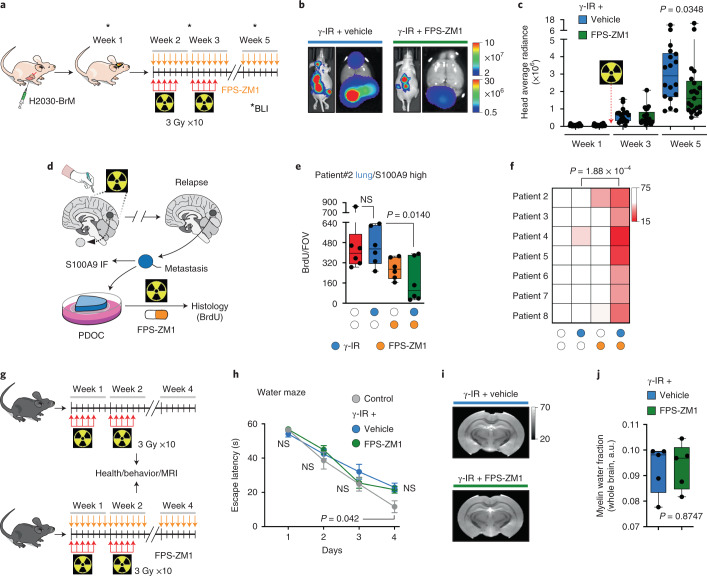
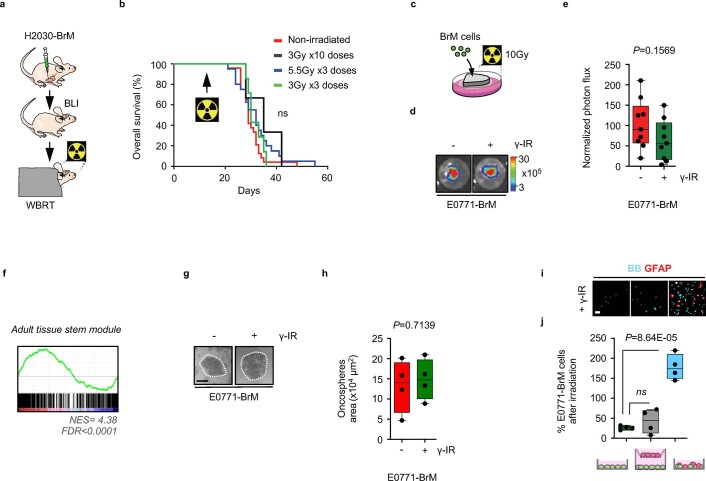
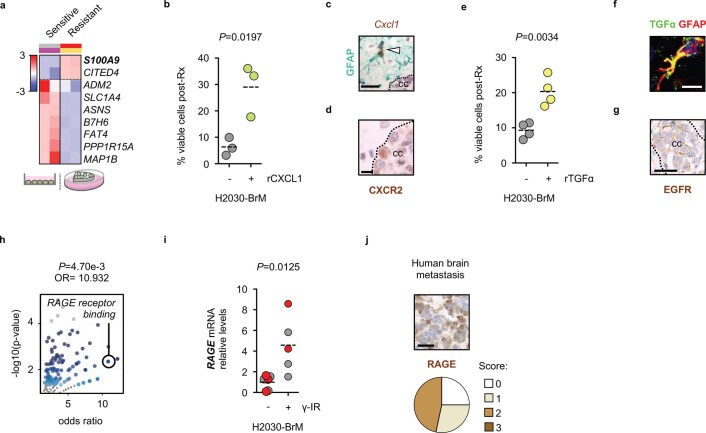
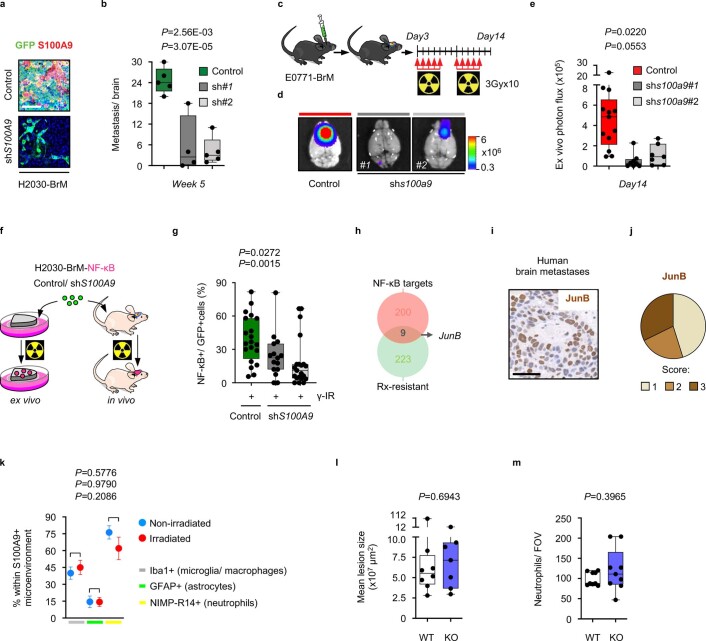
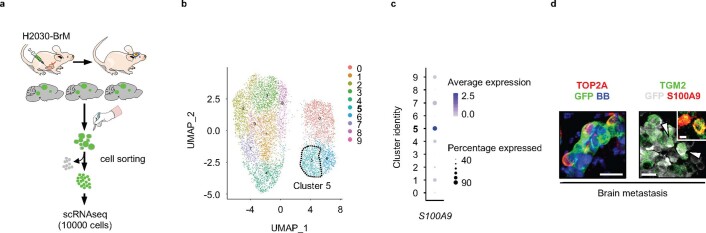
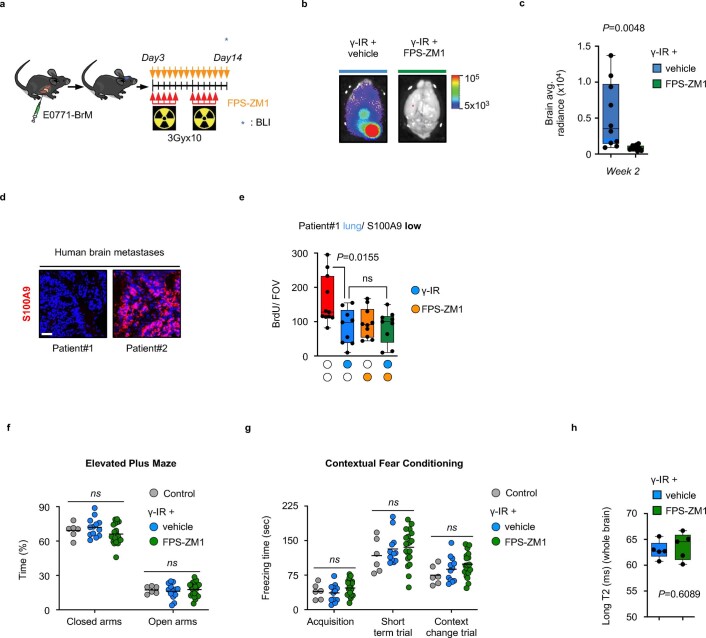
Whole-brain radiotherapy (WBRT) is the treatment backbone for many patients with brain metastasis; however, its efficacy in preventing disease progression and the associated toxicity have questioned the clinical impact of this approach and emphasized the need for alternative treatments. Given the limited therapeutic options available for these patients and the poor understanding of the molecular mechanisms underlying the resistance of metastatic lesions to WBRT, we sought to uncover actionable targets and biomarkers that could help to refine patient selection. Through an unbiased analysis of experimental in vivo models of brain metastasis resistant to WBRT, we identified activation of the S100A9-RAGE-NF-κB-JunB pathway in brain metastases as a potential mediator of resistance in this organ. Targeting this pathway genetically or pharmacologically was sufficient to revert the WBRT resistance and increase therapeutic benefits in vivo at lower doses of radiation. In patients with primary melanoma, lung or breast adenocarcinoma developing brain metastasis, endogenous S100A9 levels in brain lesions correlated with clinical response to WBRT and underscored the potential of S100A9 levels in the blood as a noninvasive biomarker. Collectively, we provide a molecular framework to personalize WBRT and improve its efficacy through combination with a radiosensitizer that balances therapeutic benefit and toxicity.


Conflict of interest statement

R.L. receives research funding from Bristol Myers Squibb, Pierre Fabre and AstraZeneca; P.L. serves as a paid advisor/speaker for Bristol Myers Squibb, Merck Sharp and Dohme, Roche, Novartis, Amgen, Pierre Fabre, Nektar and MelaGenix. P.L. receives travel support from Bristol Myers Squibb and Merck Sharp and Dohme. P.L. receives research support from Bristol Myers Squibb and Pierre Fabre. The other authors declare no competing interests.

Figures

Fig. 1
Fig. 1. Acquired radioresistance in experimental brain metastasis.
a, Representative BLI of mice injected IC with H2030-BrM before and after completing different radiation schedules. The colored lines indicate the specific condition/irradiation protocol as specified in b. Color bars show BLI intensity in p s−1 cm2 sr−1). b, Quantification of BLI in the head of mice. Values correspond to the fold increase for each mouse before, week 2 after IC injection of H2030-BrM and after completing each radiation schedule week 4 after IC injection. Values are shown in box-and-whisker plots, where each dot is a mouse and the line in the box corresponds to the median. The boxes go from the upper to the lower quartiles, and the whiskers go from the minimum to the maximum value (n = 10, mice nonirradiated; n = 9, mice irradiated with 10 × 3 Gy; n = 9, mice irradiated with 3 × 5.5 Gy; n = 10, mice irradiated with 3 × 3 Gy). P value was calculated using two-tailed t-test between nonirradiated and irradiated experimental groups (nonirradiated versus 10 × 3 Gy, P = 0.7065; nonirradiated versus 3 × 5.5 Gy, P = 0.7109; nonirradiated versus 3 × 3 Gy, P = 0.9556). γ-IR, gamma irradiation; NS, not significant. c, Representative images of the cell density (blue, bisbenzimide) 72 h after irradiating H2030-BrM cells compared with nonirradiated control. Heatmap showing the sensitivity of ten different brain tropic cancer cell lines to irradiation 72 h after a single dose of 10 Gy. Heatmap colors correspond to the percentage of cells remaining after irradiation normalized to the nonirradiated control. Values were obtained from three replicates per experimental condition (mean percentage of viable cells after irradiation ± s.e.m.; P value was calculated using a two-tailed t-test (1, H2030-BrM: 27.63 ± 1.25, P = 0.0046; 2, 393N1: 48.77 ± 12.34, P = 0.0200; 3, 482N1: 47.25 ± 2.57, P = 0.0154; 4, PC9-BrM: 28.66 ± 6.81, P = 0.0013; 5, MDA231-BrM: 14.12 ± 3.35, P = 0.0010; 6, CN34-BrM: 47.46 ± 1.98, P = 0.0068; 7, E0771-BrM: 27.63 ± 1.25, P = 0.0046; 8, HCC1954-BrMa: 28.28 ± 3.87, P = 0.0023; 9, HCC1954-BrMb: 29.78 ± 1.25, P = 0.0064; 10, ErbB2-BrM: 34.38 ± 4.78, P = 0.0155)). Colored bars: blue, lung cancer-derived brain tropic models (1, H2030-BrM and 4, PC9-BrM: human cell lines; 2, 393N1 and 3, 482N1: mouse cell lines); pink, breast cancer-derived brain tropic models (5, MDA231-BrM, 6, CN34-BrM, 8, HCC1954-BrMa and 9, HCC1954-BrMb: human cell lines; 7, E0771-BrM and 10, ErbB2-BrM: mouse cell lines); black, KRAS/Kras and TRP53/Trp53 mutants; red, EGFR mutant; brown, TNBC; green, HER2+ breast cancer. Scale bar, 5 μm. d, Representative images of brain organotypic cultures with metastatic cells 72 h after irradiation at 10 Gy. Color bar shows BLI intensity in p s−1 cm−2 sr−1). e, Quantification of photon flux values from metastatic cells growing in organotypic brain cultures after irradiation normalized to preirradiated BLI values. Values are shown in box-and-whisker plots where every dot represents an independent culture and the line in the box corresponds to the median. The boxes go from the upper to the lower quartiles, and the whiskers go from the minimum to the maximum value (n = 23, nonirradiated brain slices with H2030-BrM; n = 24, irradiated brain slices with H2030-BrM). P value was calculated using a two-tailed t-test. f, Working model suggesting potential sources of radioresistance and how to model them in vitro. g, Representative images of oncospheres 72 h after irradiation at 10 Gy. Scale bar, 250 µm. h, Quantification of oncosphere area. Values are shown in box-and-whisker plots, where every dot represents a different well from which the mean area of all oncospheres were quantified, from an independent culture and the line in the box corresponds to the median. The boxes go from the upper to the lower quartiles, and the whiskers go from the minimum to the maximum value (n = 8, nonirradiated wells with H2030-BrM oncospheres; n = 10, irradiated wells with H2030-BrM oncospheres). P value was calculated using a two-tailed t-test. i, Representative images of co-cultures between H2030-BrM (GFP+) and glial cells (astrocytes, GFAP+) 72 h after irradiation (10 Gy). Scale bar, 250 μm. j, Quantification of GFP+ BrM cells after radiation normalized to their respective nonirradiated controls from the experiment shown in i. Values are shown in box-and-whisker plots, where every dot represents an independent culture and the line in the box corresponds to the median. The boxes go from the upper to the lower quartiles, and the whiskers go from the minimum to the maximum value (n = 11, H2030-BrM; n = 5 H2030-BrM in indirect co-culture with glia cells; n = 5, H2030-BrM in direct co-culture with glia cells; n = 6, H2030-BrM in direct co-culture with astrocytes). P values were calculated using a two-tailed t-test.
Fig. 2
Fig. 2. Contact-dependent astrocyte-released cytokines induce S100A9 secretion in cancer cells, triggering NF-κB activation.
a, Heatmap representing color-coded expression levels of commonly deregulated genes in H2030-BrM cell line when cultured under radiosensitive (purple line, adherent; light green line, co-culture with inserts) compared with radioresistant (dark green line, oncospheres; blue line, cell–cell co-culture) conditions in vitro. Only genes with false discovery rate (FDR) < 0.05 and a log2 ratio >1 were considered. b, Representative images of S100A9 protein expression levels in metastatic lesions growing in brains from mice IC injected with H2030-BrM and E0771-BrM. Three brains were analyzed in each BrM model. Scale bars, 120 µm (H2030-BrM) and 50 µm (E0771-BrM). c, Sixty-six human brain metastases from patients with lung cancer (33 cases) or breast cancer (30 cases) or other primary tumors (3 cases) were stained for S100A9 by immunohistochemistry. Representative images are shown. Scale bar, 50 µm. Quantification of different histological scoring of cancer cells is shown in pie charts. Five cases had to be excluded; 27 of 61 were scored with no staining (score 0), 9 of 61 with weak staining (score 1), 12 of 61 with moderate staining (score 2) and 13 of 61 with strong staining (score 3). d, Quantification of S100A9 expression levels in H2030-BrM after stimulation with 100 ng ml−1 recombinant CXCL1 (rCXCL1) or control. Values are shown in dot plots, and dots represent independent experiments. The line in the box corresponds to the median. The boxes go from the upper to the lower quartiles, and the whiskers go from the minimum to the maximum value (n = 7, each experimental condition). P value was calculated Wilcoxon signed rank test, two sided. e, Quantification of S100A9 expression levels in H2030-BrM after stimulation with recombinant transforming growth factor α (rTGF-α) or control. Values are shown in dot plots and dots represent independent experiments. The line in the box corresponds to the median. The boxes go from the upper to the lower quartiles, and the whiskers go from the minimum to the maximum value (n = 7, each experimental condition). P value was calculated using two-tailed t-test. f, Quantification by enzyme-linked immunosorbent assay (ELISA) of human S100A9 (hS100A9) in the supernatant of H2030-BrM grown either under adherent conditions in vitro or in organotypic cultures ex vivo. Values are shown in box-and-whisker plots, where every dot represents an independent experiment and the line in the box corresponds to the median. The boxes go from the upper to the lower quartiles, and the whiskers go from the minimum to the maximum value (n = 6, H2030-BrM adherent cultures; n = 8, H2030-BrM growing in organotypic brain cultures). P value was calculated using two-tailed Mann–Whitney test. g, Quantification of in vitro viable cell fraction after irradiation at 10 Gy and 200 ng ml−1 recombinant hS100A9 or control, as determined by manual cell counting of bisbenzimide-positive nuclei. Values are percentages of viable cells respect to unirradiated controls and shown in a dot plot, where each dot represents an independent experiment and the line in the box corresponds to the median (n = 3, each experimental condition). P value was calculated using a two-tailed t-test. h, Representative pictures of RAGE immunohistochemistry from unirradiated or irradiated established H2030-BrM metastases in vivo. Scale bar, 50 µm. i, Quantification of the percentage of NF-κB+ GFP+ H2030-BrM cells identified by the expression of an engineered mCherry NF-κB activity reporter. Brain slices with cancer cells were evaluated 72 h after treatment with radiotherapy. Values are shown in box-and-whisker plots where each dot is a brain organotypic culture (n = 11, nonirradiated; n = 7, irradiated with a single dose of 10 Gy) and the line in the box corresponds to the median. The boxes go from the upper to the lower quartiles and the whiskers go from the minimum to the maximum value. P value was calculated using a two-tailed t-test. j, Schema of working model of radioresistance in brain metastasis.
Fig. 3
Fig. 3. Targeting S100A9 in cancer cells radiosensitizes experimental lung and breast cancer brain metastases in a NF-κB–JunB-dependent manner.
a, Schema of experimental design. b, Representative BLI of mice 5 weeks after being inoculated IC with H2030-BrM control (left), shS100A9#1 (middle) or shS100A9#2 (right) cells and treated with 10 × 3 Gy irradiation using the WBRT protocol depicted in a. Ex vivo brain BLI is also shown for each condition. Color bars show BLI intensity in p s−1 cm−2 sr−1. BLI colour bars correspond to in vivo (top) and ex vivo (bottom). c, Quantification of in vivo photon flux values from the head of mice inoculated with H2030-BrM control, shS100A9#1 or shS100A9#2 cells that received WBRT, as depicted in a. BLI was performed at three different time points during the course of treatment (weeks 1, 3 and 5). Values are shown in box-and-whisker plots, where every dot represents a different brain and the line in the box corresponds to the median. The boxes go from the upper to the lower quartiles, and the whiskers go from the minimum to the maximum value (n = 9, H2030-BrM control; n = 8, H2030-BrM shS100A9#1; n = 8, H2030-BrM shS100A9#2). P value was calculated using two-tailed t-test. d, Kaplan–Meier plot showing survival proportions of mice inoculated with H2030-BrM control, shS100A9#1 or shS100A9#2 cells that received WBRT as depicted in a (n = 12, each experimental condition). P value was calculated using a log-rank (Mantel–Cox) test. OS, overall survival. e, Quantification of the percentage of NF-κB+ GFP+ positive H2030-BrM control, shS100A9#1 or shS100A9#2 cells in organotypic cultures, which received no or 10 Gy irradiation. Values are shown in box-and-whisker plots, where every dot represents an independent culture and the line in the box corresponds to the median. The boxes go from the upper to the lower quartiles and the whiskers go from the minimum to the maximum value (n = 13, H2030-BrM control; n = 13, H2030-BrM control + γ-IR; n = 6, shS100A9#1 + γ-IR; n = 9, shS100A9#2 + γ-IR). P values were calculated using two-tailed t-tests. Upper panel shows representative organotypic cultures from the experiment in the panel. Scale bar, 75 µm. f, Quantification of the percentage of JunB+ GFP+ BrM cells in nonirradiated H2030-BrM control and irradiated H2030-BrM control, H2030-BrM shS100A9#1 or H2030-BrM shS100A9#2 brain metastatic lesions. Values are shown in box-and-whisker plots, where every dot represents a metastatic lesion and the line in the box corresponds to the median. The boxes go from the upper to the lower quartiles, and the whiskers go from the minimum to the maximum value (n = 10 metastases from 2 animals, H2030-BrM control; n = 15 metastases from 2 animals, H2030-BrM control + γ-IR; n = 16 metastases from 3 animals, H2030-BrM shS100A9#1 + γ-IR; n = 19 metastases from 3 animals, H2030-BrM shS100A9#2 + γ-IR). P values were calculated using two-tailed Mann–Whitney tests. Upper panel shows representative organotypic cultures from the experiment in the panel. Scale bar, 75 µm. g, Representative images of an established H2030-BrM brain metastasis and its microenvironment. The S100A9 antibody used for this staining is rodent specific to stain only the microenvironment and not human cancer cells. Arrowheads point to S100A9+ cells in the microenvironment. CC, cancer cells. The image is representative of the five independent brains evaluated. Scale bars, 50 µm (left panel) and 10 µm (right panels). h, Quantification of S100A9+ BB+ cells in the microenvironment of brain metastasis. Only GFP cells were quantified to exclude cancer cells. Pie chart represents S100A9+ GFP BB+ cells as the red slice (8.29%) and S100A9 GFP BB+ cells as the white slice. Cells were quantified in nine fields of view (FOVs) representing equally different sizes of metastasis from three mice brains. i, Schema of experimental design. j, Representative bioluminescence and immunofluorescent images of ex vivo brains from S100A9+/+ or S100A9−/− mice 2 weeks after intracranial injection of E0771-BrM cells. After inoculation, mice were consequently treated with WBRT as shown in i. Neutrophils are labeled with NIMP-R14 antibody (green). The bioluminescence images are representative of the 15 brains analyzed, and the immunofluorescence images are representative of the six brains analyzed. Color bar shows BLI intensity in p s−1 cm−2 sr−1). Scale bar, 25 µm. k, Quantification of ex vivo brain photon flux values from S100A9+/+ or S100A9−/− mice inoculated with E0771-BrM cells and treated with WBRT as depicted in i. Values are shown in box-and-whisker plots, where every dot represents a different brain and the line in the box corresponds to the median. The boxes go from the upper to the lower quartiles, and the whiskers go from the minimum to the maximum value (n = 10, S100A9+/+ mice; n = 16, S100A9−/− mice). P value was calculated using Mann–Whitney test, two sided. KO, knockout; WT, wild-type.
Fig. 4
Fig. 4. S100A9-mediated radioresistance is linked to cancer stem cell properties and sensitivity to RAGE and NF-κB inhibition.
a, Uniform manifold approximation and projection (UMAP) plot of all analyzed cancer cells showing S100A9 gene expression. Color corresponds to the gene expression in each cell. Dotted line surrounds cluster 5. b, GSEA of genes deregulated in cluster 5 versus all other clusters, corresponding to Supplementary Table 10. Displayed gene sets are the 25 highest ranking up- or downregulated gene sets according to the normalized enrichment score (NES) and a cutoff of P value < 0.05 and FDR < 0.25. Colored bars correspond to the biological category these gene sets belong to. EMT, epithelial–mesenchymal transition. ATR, ataxia aelangiectasia and Rad3-related protein. c, Venn diagram showing the strategy delineating CD55 by intersecting genes upregulated in S100A9high patients with genes upregulated in in vitro and ex vivo radioresistant culture conditions (Supplementary Table 11). d, Representative flow cytometry dot plot illustrating the double staining CD55/S100A9 in permeabilized cancer cells sorted from H2030-BrM brain metastases. Q, quartile. e, Left: representative BLI images of oncospheres generated from CD55 and CD55+ sorted cells from H2030-BrM brain metastases. Representative brightfield images of respective oncospheres are also shown in the smaller panels. Arrowheads point to oncospheres. Scale bar, 125 µm. Right: representative immunofluorescent image of S100A9 staining in CD55+ oncospheres. Color bar shows BLI intensity in p s−1 cm−2 sr−1). Scale bar, 25 µm. f, Quantification of numbers of oncospheres per well from CD55 and CD55+ sorted cells. Values are shown in box-and-whisker plots, where every dot represents an individual well from three independent experiments and the line in the box corresponds to the median. The boxes go from the upper to the lower quartiles, and the whiskers go from the minimum to the maximum value (n = 30 wells, each experimental condition). P value was calculated using a two-tailed t-test. g, Heatmap displaying gene expression values of 11 genes, selected from highly upregulated genes of cluster 5 of the single-cell analysis in a, in CD55+ and CD55 oncospheres. Color-coded values depicted are fold-changes normalized to CD55 oncospheres (fold increase, CD55+/CD55: S100A9, 36.91; TGM2, 50.96; TOP2A, 10.01; SPP, 7.52; ANGPTL4, 0.82; RSPO3, 4.63; STC1, 1.32; IGFBP3, 167.68; FAM83A, 148.97; ACOX2, 34.60; CITED4, 4.19). h, Schema illustrating pharmacological approaches to evaluate the working model of radioresistance. i, Representative images and quantification of photon flux values from H2030-BrM cells growing in organotypic brain cultures treated with 10 µM of FPS-ZM1 after irradiation. Values at endpoint (day 3) were first normalized to values from the same culture before treatment (day 0). Values are shown in box-and-whisker plots, where every dot represents an independent culture and the line in the box corresponds to the median. The boxes go from the upper to the lower quartiles, and the whiskers go from the minimum to the maximum value (n = 13, nonirradiated H2030-BrM; n = 12, irradiated H2030-BrM, both treated with FPS-ZM1). P value was calculated using a two-tailed t-test. j, Representative images and quantification of brain organotypic cultures with H2030-BrM cells 72 h after treatment with 50 µM BAY-117081, an inhibitor of IκB-α phosphorylation, and 10 Gy irradiation or no irradiation. Quantification of photon flux values at endpoint (day 3) were normalized to values from the same culture before treatment (day 0). Values are shown in box-and-whisker plots, where every dot represents an independent culture and the line in the box corresponds to the median. The boxes go from the upper to the lower quartiles, and the whiskers go from the minimum to the maximum value (n = 12, nonirradiated H2030-BrM; n = 12, irradiated H2030-BrM, both treated with BAY-117081). P value was calculated using a two-tailed t-test. Color bar in i and j shows BLI intensity in p s−1 cm−2 sr−1).
Fig. 5
Fig. 5. S100A9 is a brain metastasis biomarker of therapeutic response to WBRT.
a, Schema of study design. S100A9 protein or mRNA levels, respectively, were assessed in 22 patients with lung cancer brain metastases, 62 patients with breast cancer brain metastases and 14 patients with melanoma brain metastases who underwent neurosurgery and were subsequently treated with radiotherapy. S100A9 was correlated with response to radiotherapy. R, responder; NR, nonresponder. b, A total of 140 human brain metastases from patients with lung cancer (53 cases), breast cancer (49 cases) or melanoma (38 cases) were stained for S100A9 by immunohistochemistry. Quantification of different histological scoring of cancer cells is shown in pie charts separate for each primary tumor. For lung cancer, 32 of 53 were scored with no staining (score 0), 4 of 53 with weak staining (score 1), 10 of 53 with moderate staining (score 2) and 7 of 53 with strong staining (score 3). For breast cancer, 23 of 49 were scored with no staining, 6 of 49 with weak staining, 7 of 49 with moderate staining and 13 of 49 with strong staining. For melanoma, 27 of 38 were scored with no staining, 4 of 38 with weak staining, 3 of 38 with moderate staining and 4 of 38 with strong staining. c, Representative MRI images of two lung cancer brain metastasis patients before and after neurosurgery and WBRT. For each patient the corresponding S100A9 immunohistochemical staining is shown. The images shown are representative of the 22 patients analyzed. Scale bar, 100 µm. d, Analysis of time to local relapse, as evaluated by follow-up MRI, after neurosurgery and WBRT in a cohort of 22 patients with lung cancer brain metastases. Data are shown as a Kaplan–Meier plot, and two groups of patients (S100A9 low/high) were delineated by using 5% of S100A9 immunohistochemical staining positivity as a cutoff. P value was calculated using a log-rank (Mantel–Cox) test. e, Analysis of survival after brain metastasis diagnosis in a cohort of 42 patients with breast cancer brain metastases. Only patients who received adjuvant radiotherapy were included. Data are shown as a Kaplan–Meier plot, and two groups of patients (S100A9 low/high) were delineated according to their S100A9 mRNA expression levels in brain metastasis. P value was calculated using a log-rank (Mantel–Cox) test. f, Analysis of survival after brain metastasis diagnosis in a cohort of 34 patients with brain metastasis from breast cancer (20 cases) and melanoma (14 cases). Data are shown as a Kaplan–Meier plot, and two groups of patients (S100A9 low/high) were delineated by using 5% of S100A9 immunohistochemical staining positivity as a cutoff. P value was calculated using a log-rank (Mantel–Cox) test. g, Schema of study design. S100A9 protein was measured in liquid biopsy specimens from 71 patients with brain metastases who received WBRT. S100A9 positivity in serum was correlated with response to radiotherapy. h, Analysis of survival after brain metastasis diagnosis in a cohort of 71 patients with brain metastases from lung cancer (43 cases), breast cancer (14 cases), melanoma (10 cases) or other primary tumors (4 cases). Data are shown as a Kaplan–Meier plot, and two groups of patients (positive/negative) were delineated according to their S100A9 positivity in serum samples, collected before or within 2.5 months of receiving WBRT. P value was calculated using log-rank (Mantel–Cox) test. BrM, brain metastasis.
Fig. 6
Fig. 6. FPS-ZM1 radiosensitizes experimental and human brain metastases.
a, Schema of experimental design. H2030-BrM cells were inoculated IC into nude mice, and 2 weeks later, mice received 10 doses of 3 Gy WBRT plus 500 mg kg−1 per day FPS-ZM1 or vehicle until the end of the experiment. Intracranial tumor growth was monitored weekly with BLI. b, Representative bioluminescence images in vivo and ex vivo (brains) of control and experimental arms at endpoint, 5 weeks after IC injection. BLI scale bars correspond to in vivo (top) and ex vivo (bottom). Colors bar show BLI intensity in p s−1 cm−2 sr−1). c, Quantification of in vivo photon flux values from the head of mice inoculated with H2030-BrM cells that received WBRT plus vehicle or FPS-ZM1, as depicted in a. BLI was performed at three different time points during the course of treatment (weeks 1, 3 and 5). Values are shown in box-and-whisker plots, where every dot represents a different brain and the line in the box corresponds to the median. The boxes go from the upper to the lower quartiles, and the whiskers go from the minimum to the maximum value (n = 18, vehicle + γ-IR; n = 21, FPS-ZM1 + γ-IR). P value was calculated using two-tailed Mann–Whitney test. d, Schema of experimental design. Surgically resected human brain metastases from patients who relapsed after receiving previous local treatments, including WBRT, were used to measure S100A9 levels by immunofluorescence (IF) and establish PDOCs, which were treated with FPS-ZM1 (10 µM) with or without irradiation and the therapeutic benefit evaluated 3 days later by 5-bromodeoxyuridine (BrdU) incorporation in cancer cells. e, Quantification of BrdU+ cancer cells in PDOCs from patient 2 treated with FPS-ZM1 and/or irradiation. Values are shown in box-and-whisker plots, where every dot represents an independent culture and the line in the box corresponds to the median. The boxes go from the upper to the lower quartiles, and the whiskers go from the minimum to the maximum value (n = 6, DMSO; n = 6, FPS-ZM1, n = 6, γ-IR; n = 6, FPS-ZM1 + γ-IR). P values were calculated using a two-tailed t-test. f, Heatmap depicting the quantification of BrdU+ cancer cells in PDOCs derived from seven patients with relapsed brain metastases, which have S100A9 high levels. Each row represents an individual patient, and each column represents different treatment conditions. Color-coded values are percentages of BrdU+ cancer cells normalized to the DMSO condition of each patient. P value was calculated using a two-tailed t-test. g, Schema of experimental design. Tumor-naive C57BL/6 mice received 10 doses of 3 Gy WBRT plus 500 mg kg−1 per day FPS-ZM1 or vehicle for 3 weeks. One month later, mice underwent health assessment, imaging and behavioral testing. h, Quantification of the time spent to escape the water to the platform (escape latency) from different groups of mice. Values are shown in a temporal scale, where each dot represents the mean value for each group in a given day of the test and the error bars represent s.e.m. (n = 6, control; n = 13, vehicle + γ-IR, n = 20, FPS-ZM1 + γ-IR). Calculation of P values is detailed in Supplementary Table 24. i, Representative ex vivo ultrahigh-field MRI images of brains from mice treated with either WBRT + vehicle or WBRT + FPS-ZM1 are shown. Greyscale shows the values from the long T2 component by ex vivo ultrahigh-field MRI. j, Quantification of whole-brain myelin water fraction by ex vivo ultrahigh-field MRI in brains from experiment depicted in i. Values are shown in box-and-whisker plots, where every dot represents a brain and the line in the box corresponds to the median. The boxes go from the upper to the lower quartiles, and the whiskers go from the minimum to the maximum value (n = 5, each experimental condition). P value was calculated using a two-tailed t-test.
Extended Data Fig. 1
Extended Data Fig. 1. Acquired radioresistance in experimental brain metastasis.
a, Schema of the experimental design. BLI: bioluminescence imaging. b, Kaplan–Meier curves showing survival in nonirradiated and irradiated experimental groups described in Fig. 1b (n = 10, mice nonirradiated; n = 9, mice irradiated with 10 x 3 Gy; n = 9, mice irradiated with 3 × 5.5 Gy; n = 10, mice irradiated with 3 x 3 Gy). P value was calculated using log-rank (Mantel–Cox) test between nonirradiated and irradiated experimental groups (nonirradiated versus 10 x 3 Gy, P = 0.2019; nonirradiated versus 3 × 5.5 Gy, P = 0.1649; nonirradiated versus 3 x 3 Gy, P = 0.3057). c, Schema of experimental design. d, Representative images of brain organotypic cultures with metastatic cells 72 hours after irradiation at 10 Gy. e, Quantification of photon flux values from metastatic cells growing in organotypic brain cultures after irradiation normalized to preirradiated BLI values. Values are shown in box-and-whisker plots where every dot represents an independent culture and the line in the box corresponds to the median. The boxes go from the upper to the lower quartiles and the whiskers go from the minimum to the maximum value (n = 9, nonirradiated brain slices with E0771-BrM; n = 9, irradiated brain slices with E0771-BrM). P value is calculated using two-tailed t test. f, Representative graph of positively enriched gene sets depicting induction of a stem cell signature among a preranked list of differentially expressed genes from resistant culture preparations ex vivo (Supplementary Table 1). The green curve corresponds to the Enrichment Score, while the normalized enrichment score (NES) and the FDR are shown below the graph. g, Representative images of oncospheres 72 hours after irradiation at 10 Gy. Scale bar, 250 µm. h, Quantification of oncosphere area. Values are shown in box-and-whisker plots where every dot represents a different well from which the mean area of all oncospheres were quantified, from an independent culture and the line in the box corresponds to the median. The boxes go from the upper to the lower quartiles and the whiskers go from the minimum to the maximum value (n = 4, nonirradiated wells with E0771-BrM oncospheres; n = 4, irradiated wells with E0771-BrM oncospheres). P value is calculated using two-tailed t test. i, Representative images of co-cultures between E0771-BrM and astrocytes (GFAP + ) 72 h after irradiation (10 Gy). Scale bar, 100 μm j, Quantification of GFAP- BrM cells after irradiation normalized to their respective nonirradiated controls from experiment in i. Values are shown in box-and-whisker plots where every dot represents an independent culture and the line in the box corresponds to the median. The boxes go from the upper to the lower quartiles and the whiskers go from the minimum to the maximum value (n = 4, in each respective experimental condition). P value is calculated using two-tailed t test.
Extended Data Fig. 2
Extended Data Fig. 2. Contact-dependent astrocyte-released cytokines induce S100A9 secretion in cancer cells triggering NF-κB activation.
a, Heatmap depicting the gene signature in Fig. 2a scored in the comparison between H2030-BrM growing in adherent conditions in vitro and in brain organotypic cultures ex vivo. Only genes with FDR < 0.05 and a log2 ratio >1 were considered. b, Quantification of in vitro viable cell fraction after irradiation at 10 Gy and stimulation with 100 ng/ml rCXCL1 or control, as determined by manual cell counting of bisbenzimide+ nuclei. Values are percentages of viable cells respect to unirradiated controls and shown in a dot plot where each dot represents an independent experiment and the line in the box corresponds to the median and whiskers go from the minimum to the maximum value (n = 3, each experimental condition). P value was calculated using two-tailed t test. c, Representative image of the peritumoral microenvironment where CXCL1 mRNA is labelled by RNA in situ hybridization (brown) and GFAP by immunohistochemistry (purple). The dotted line surrounds the metastasis. cc: cancer cells. Scale bar: 50 µm. The experiment was independently repeated three times with similar results. d, Representative image of CXCR2 protein in H2030-BrM brain metastasis. The dotted line surrounds the metastasis. cc: cancer cells. Scale bar: 25 µm. The experiment was independently repeated three times with similar results. e, Quantification of in vitro viable cell fraction after irradiation at 10 Gy and stimulation with rTGFα or control, as determined by manual cell counting of bisbenzimide+ nuclei. Values are percentages of viable cells respect to unirradiated controls and shown in a dot plot where each dot represents an independent experiment and the line in the box corresponds to the median median and whiskers go from the minimum to the maximum value (n = 4, each experimental condition). P value was calculated using two-tailed t test. f, Representative image of the peritumoral microenvironment where TGFα co-localizes with astrocytes (GFAP + ). Scale bar: 10 µm. The experiment was independently repeated three times with similar results. g, Representative image of EGFR immunohistochemistry in experimental H2030-BrM brain metastasis. Scale bar: 50 µm. The experiment was independently repeated three times with similar results. h, Differentially expressed genes in resistant culture preparations (2 biological independent replicas used for each radioresistant preparation (oncospheres, n = 2; co-cultures (cell–cell contact), n = 2), and for radiosensitive preparations, (adherent cultures, n = 2; co-cultures (insert), n = 2)) were used to perform Gene Ontology (GO) analysis using the EnrichR software. The volcano plot represents the significance of each gene set from GO Molecular Function versus its odds ratio. P value is computed from the Fisher exact test. Larger blue points represent significant terms (P value<0.05); smaller grey points represent non-significant terms. The darker the blue color of a point, the more significant it is. i, Quantification of RAGE expression levels in H2030-BrM 24 hours after a single dose (10 Gy) of radiation. Both adherent (grey) and oncospheres (red) are plotted together. Each circle represents independent cultures (n = 3 nonirradiated adherent cells, n = 3 nonirradiated oncospheres, n = 3 nonirradiated adherent cells, n = 2 nonirradiated oncospheres). Expression values were normalized to their respective nonirradiated control for each culture condition and the line represents the mean. P value was calculated using two-tailed t test. Nonirradiated adherent cells versus irradiated adherent cells, P = 0.1521; nonirradiated oncospheres versus irradiated oncospheres, P = 0.0522. j, 66 human brain metastases from lung cancer patients (33 cases), breast cancer patients (30 cases) or patients with other primary tumors (3 cases) were stained for RAGE by immunohistochemistry. Representative images are shown. Scale bar: 50 µm. Quantification of different histological scoring of cancer cells is shown in pie charts. 6 cases had to be excluded, 15/60 were scored with no staining, 17/60 with weak staining and 28/60 with moderate staining.
Extended Data Fig. 3
Extended Data Fig. 3. Targeting S100A9 in cancer cells radiosensitizes experimental lung and breast cancer brain metastases in a NF-κB–JunB-dependent manner.
a, Representative images of histology of brain metastatic lesions from experiment in Fig. 3a-c. GFP: cancer cells. Scale bar: 100 µm. b, Quantification of the number of brain metastatic lesions in mice inoculated with H2030-BrM control, shS100A9#1 or shS100A9#2 cells and treated with WBRT. Metastatic burden was assessed at endpoint by histology. Values are shown in box-and-whisker plots where every dot represents a different brain and the line in the box corresponds to the median. The boxes go from the upper to the lower quartiles and the whiskers go from the minimum to the maximum value (n = 5, H2030-BrM Control; n = 4, H2030-BrM shS100A9#1; n = 5, H2030-BrM shS100A9#2). P value is calculated using two-tailed t test. c, Schema of experimental design. d, Representative bioluminescence images of ex vivo brains from mice two weeks after intracranial injection of E0771-BrM cells transduced with either a scrambled shRNA as Control, or one of two different shRNA against murine S100a9 sh#1 or sh#2. After inoculation, mice were consequently treated with WBRT as shown in (c). e, Quantification of ex vivo brain photon flux values from irradiated mice inoculated with E0771-BrM Control, shS100a9#1 or shS100a9#2. Values are shown in box-and-whisker plots where every dot represents a different brain and the line in the box corresponds to the median. The boxes go from the upper to the lower quartiles and the whiskers go from the minimum to the maximum value (n = 13, E0771-BrM Control; n = 8, E0771-BrM shs100a9#1; n = 7, E0771-BrM shs100a9#2). P value is calculated using two-tailed t test. f, Schema of experimental design. H2030-BrM control or shS100A9 cells engineered with a NF-κB-mCherry reporter were used ex vivo in organotypic cultures or IC injected in mice. g, Quantification of the percentage of NF-κB + GFP + positive cells in irradiated brain metastatic lesions in vivo, generated from IC injection of H2030-BrM control, H2030-BrM shS100A9#1 or H2030-BrM shS100A9#2 cells (n = 4 mice, each experimental condition). Values are shown in box-and-whisker plots where every dot represents a metastatic lesion and the line in the box corresponds to the median. The boxes go from the upper to the lower quartiles and the whiskers go from the minimum to the maximum value (n = 20 FOV, H2030-BrM Control + γ-IR; n = 13 FOV, H2030-BrM shS100A9#1 + γ-IR; n = 21 FOV, H2030-BrM shS100A9#2 + γ-IR). P value was calculated using two-tailed Mann–Whitney Test. h, Venn diagram showing the overlap of 9 genes (including JunB) between established NF-κB targets and genes significantly upregulated in both in vitro and ex vivo radioresistant culture preparations (Supplementary Table 12). i, Representative image of JunB staining by immunohistochemistry in human brain metastases. Scale bar: 50 µm. This analysis was repeated 62 independent samples. j, 62 human brain metastases from lung cancer patients (33 cases), breast cancer patients (27 cases) or patients with other primary tumors (2 cases) were stained for JunB. Quantification of histological scoring of cancer cells is shown in a pie chart. 28/62 were scored with weak staining (score 1), 14/62 with moderate staining (score 2) and 20/62 with strong staining (score 3). k, Quantification of S100A9 + GFAP + , S100A9 + Iba1+ and S100A9 + NIMP-R14 + cells in the microenvironment of H2030-BrM brain metastasis by double-immunofluorescent staining of unirradiated and irradiated mice brains. Values shown are percentages of all microenvironmental S100A9 + cells. Dots correspond to the mean and error bars correspond to sem. 6-10 FOV per condition from 3 (nonirradiated) and 2 (irradiated) brains were quantified. P values were calculated using two-tailed t test. l, Quantification of brain metastatic lesion size by histology of brains obtained from experiment depicted in Fig. 3i. Values are shown in box-and-whisker plots where every dot represents a different brain and the line in the box corresponds to the median. Whiskers go from the minimum to the maximum value (n = 8, S100A9+/+ mice; n = 7, S100A9-/- mice). P value was calculated using Mann–Whitney test, two sided. m, Quantification of neutrophils by histology of brains obtained from experiment depicted in Fig. 3i. Values are shown in box-and-whisker plots where every dot represents a different field of view and the line in the box corresponds to the median. Whiskers go from the minimum to the maximum value (n = 9 fields of view obtained from 3 S100A9+/+ and 3 S100A9+/+ mice). P value was calculated using Mann–Whitney test, two sided.
Extended Data Fig. 4
Extended Data Fig. 4. S100A9-mediated radioresistance is linked to cancer stem cell properties and sensitivity to RAGE and NF-κB inhibition.
a, Schema of experimental design. b, UMAP plot of all cancer cells analyzed showing the existence of 9 clusters. Colors represent each cluster. Dotted line surrounds cluster 5. c, Expression of S100A9 in each cluster. In a given cluster, size of the circle corresponds to the percentage of cells expressing the gene, while the shade of blue indicates the average expression of the gene. d, Representative images of immunofluorescent staining of selected candidates from single-cell analysis of Fig. 1a in H2030-BrM brain metastasis. Scale bars: 25 µm (low magnification) and 12.5 µm (high magnification). This experiment was repeated three times with similar results.
Extended Data Fig. 5
Extended Data Fig. 5. FPS-ZM1 radiosensitizes experimental and human brain metastases.
a, Schema of experimental design. E0771-BrM were inoculated IC into C57BL/6 mice and three days later mice received 10 doses of 3 Gy WBRT plus 500 mg/Kg/day FPS-ZM1 or vehicle until the end of the experiment. Intracranial tumor growth was measured ex vivo at the end of the experiment. b, Representative bioluminescence images of ex vivo brains of control and experimental arms at endpoint, 2 weeks after IC injection. c, Quantification of ex vivo photon flux values from brains from mice inoculated with E0771-BrM that received WBRT plus vehicle or FPS-ZM1, as depicted in (a). Values are shown in box-and-whisker plots where every dot represents a different brain and the line in the box corresponds to the median. The boxes go from the upper to the lower quartiles and the whiskers go from the minimum to the maximum value (n = 10, Vehicle + γ-IR; n = 11, FPS-ZM1 + γ-IR). P value was calculated using two-tailed t test. d, Representative S100A9 immunofluorescence from two human brain metastasis that were processed as PDOCs. Patient#1 corresponds to a previously untreated brain metastasis that was negative for S100A9. Patient#2 corresponds to a relapsed metastasis. Scale bar: 50 µm. e, Quantification of BrdU+ cancer cells in PDOC from patient#1 treated with FPS-ZM1 and/or γ-IR. Values are shown in box-and-whisker plots where every dot represents an independent culture and the line in the box corresponds to the median. The boxes go from the upper to the lower quartiles and the whiskers go from the minimum to the maximum value (n = 11, DMSO; n = 9, FPS-ZM1; n = 10, γ-IR; n = 9, FPS-ZM1 + γ-IR). P value was calculated using two-tailed t test. f, Quantification of percentage of time mice from different groups spent in open or closed arms in the elevated plus maze. Values are shown in a scatter dot plot where every dot represents a mouse and the line corresponds to the mean (n = 6, Control; n = 13, Vehicle + γ-IR, n = 20, FPS-ZM1 + γ-IR). Calculation of P values are detailed in Supplementary Table 24. g, Quantification of freezing time comparing different groups when trained (acquisition), when they were tested for the association between the context and the mild electric shock, recalling the information during the short-term trial, and when a substantial change of context was used to test a reduction in the behavior (Context change trial). Values are shown in a scatter dot plot where every dot represents a mouse and the line corresponds to the mean (n = 6, Control; n = 13, Vehicle + γ-IR, n = 20, FPS-ZM1 + γ-IR). Calculation of P values are detailed in Supplementary Table 24. h, Quantification of the brains long T2 component by ex vivo ultrahigh-field MRI in brains from experiment depicted in Fig. 6i. Values are shown in box-and-whisker plots where every dot represents a brain and the line in the box corresponds to the median. The boxes go from the upper to the lower quartiles and the whisker go from the minimum to the maximum value (n = 5, each experimental condition). P value was calculated using two-tailed t test.

References

    1. Cagney DN, et al. Incidence and prognosis of patients with brain metastases at diagnosis of systemic malignancy: a population-based study. Neuro. Oncol. 2017;19:1511–1521. doi: 10.1093/neuonc/nox077. - DOI - PMC - PubMed
    1. Berghoff AS, et al. Descriptive statistical analysis of a real life cohort of 2419 patients with brain metastases of solid cancers. ESMO Open. 2016;1:e000024. doi: 10.1136/esmoopen-2015-000024. - DOI - PMC - PubMed
    1. Valiente M, et al. The evolving landscape of brain metastasis. Trends Cancer. 2018;4:176–196. doi: 10.1016/j.trecan.2018.01.003. - DOI - PMC - PubMed
    1. Eichler AF, et al. The biology of brain metastases-translation to new therapies. Nat. Rev. Clin. Oncol. 2011;8:344–356. doi: 10.1038/nrclinonc.2011.58. - DOI - PMC - PubMed
    1. Le Rhun E, et al. EANO-ESMO Clinical Practice Guidelines for diagnosis, treatment and follow-up of patients with brain metastasis from solid tumours. Ann. Oncol. 2021;32:1332–1347. doi: 10.1016/j.annonc.2021.07.016. - DOI - PubMed

Publication types