. 2022 Apr;24(4):538-553.
doi: 10.1038/s41556-022-00881-4. Epub 2022 Apr 11.

Unchecked oxidative stress in skeletal muscle prevents outgrowth of disseminated tumour cells

Affiliations

Unchecked oxidative stress in skeletal muscle prevents outgrowth of disseminated tumour cells

Sarah B Crist et al. Nat Cell Biol. 2022 Apr.

Erratum in

Abstract

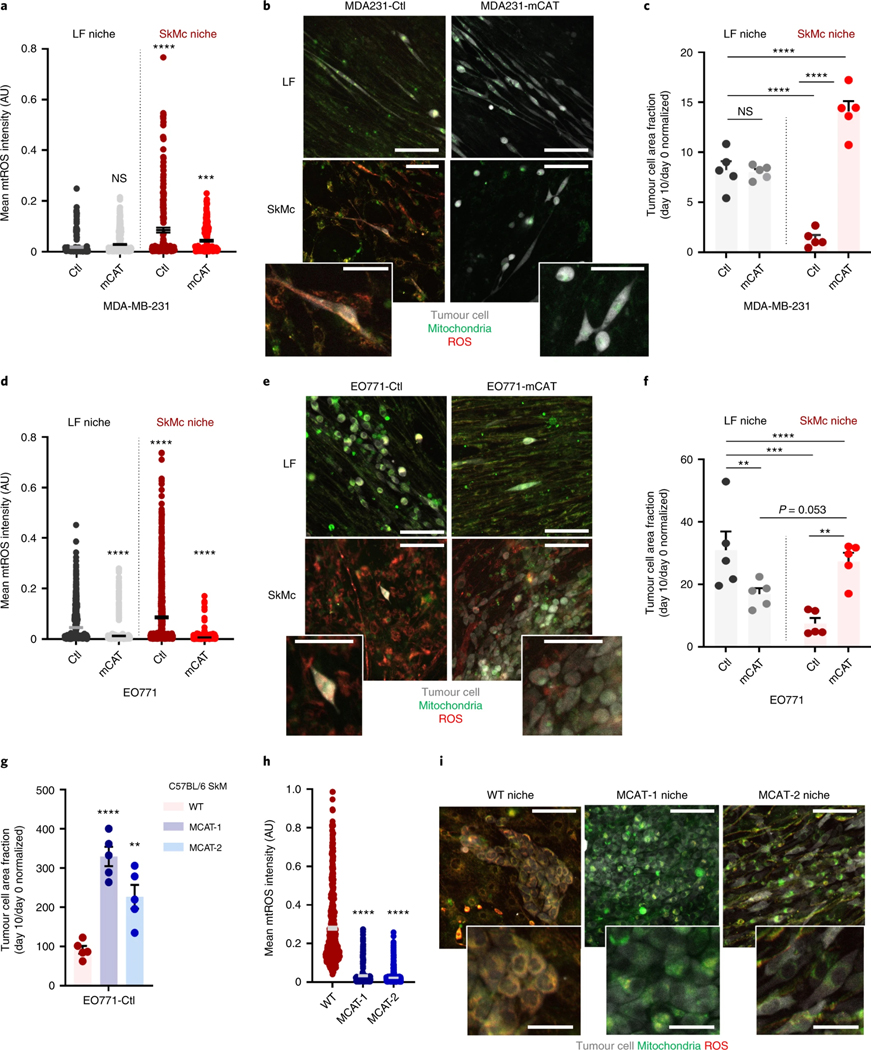
Skeletal muscle has long been recognized as an inhospitable site for disseminated tumour cells (DTCs). Yet its antimetastatic nature has eluded a thorough mechanistic examination. Here, we show that DTCs traffic to and persist within skeletal muscle in mice and in humans, which raises the question of how this tissue suppresses colonization. Results from mouse and organotypic culture models along with metabolomic profiling suggested that skeletal muscle imposes a sustained oxidative stress on DTCs that impairs their proliferation. Functional studies demonstrated that disrupting reduction-oxidation homeostasis via chemogenetic induction of reactive oxygen species slowed proliferation in a more fertile organ: the lung. Conversely, enhancement of the antioxidant potential of tumour cells through ectopic expression of catalase in the tumour or host mitochondria allowed robust colonization of skeletal muscle. These findings reveal a profound metabolic bottleneck imposed on DTCs and sustained by skeletal muscle. A thorough understanding of this biology could reveal previously undocumented DTC vulnerabilities that can be exploited to prevent metastasis in other more susceptible tissues.


Conflict of interest statement

Competing interests

The authors declare no competing interests.

Figures

Extended Data Fig. 1 |
Extended Data Fig. 1 |. Human SkM from a metastatic breast cancer patient harbours panCK+/eR+/PR+ breast cancer cells.
a) Representative multiplex IHC images from an ER+/PR+ primary breast tumour specimen, used as a positive staining control. ER/PR (breast cell marker) staining in purple, pan-cytokeratin (panCK, epithelial cell marker) staining in yellow. Scale bar: 1 mm (left), 100 μm (centre) and 10 μm (right). b) Representative multiplex IHC images from human SkM, used as a negative staining control. ER/PR staining in purple, panCK staining in yellow. Scale bar, 10 μm. c) Representative IHC image of the three human SkM sites sampled (tibialis anterior, quadriceps and gastrocnemius) from a patient with metastatic breast cancer (MBC). Scale bar, 1 cm. d) Multiplex IHC panels of three panCK+/ER+/PR+ cells located inside the quadriceps muscle. ER/PR staining in purple, pan-cytokeratin staining in yellow. Scale bar 100 μm, Inset 10 μm. e-f) Two micropictographs of serial sections (4 μm) of FFPE SkM tissue from an individual with metastatic breast cancer. The slides were stained with hematoxylin and eosin or sequentially stained with a multiplex IHC panel consisting of ER/PR (purple) and panCK (yellow). Two ER+/PR+/panCK+ breast cancer cells were identified in a vessel located within the quadriceps muscle. Scale bar, 10 μm.
Extended Data Fig. 2 |
Extended Data Fig. 2 |. Aluyb8 qPCR reveals that DTCs travel to and persist within multiple mouse SkMs following intracardiac injection of breast cancer cells.
a) Schematic of mouse study to examine frequency of DTCs across organ site at early and late timepoints. b) AluYb8 amplification (fold change) at Day 3 post ic injection. n = 11 inoculated and 3 uninoculated mice. Lung, brain and TA, P < 0.0001 when multiple unpaired two-tailed t-tests, followed by the Holm-Sidak method, were run for comparison of tumour-bearing tissues to uninoculated controls. c) Representative IF images of matched brain, lung, SkM and bone marrow (BoMa) with DTCs at the early timepoint. Scale bar: 100 μm for lung, brain and BoMa. 10 μm for muscle. d) AluYb8 amplification (fold change) at Week 7. n = 11 inoculated and 3 uninoculated mice. Lung, brain, liver, BoMa and TA, **** P < 0.0001 when multiple unpaired two-tailed t-tests, followed by Holm-Sidak method, were run for comparison of tumour-bearing tissues to uninoculated controls. e) Representative IF images of matched brain, lung, SkM and BoMa with DTCs at the late timepoint. Scale bar: 100 μm for lung, brain and BoMa; 10 μm for muscle. f) Representative IF images of DTCs or clusters of tumour cells in the brain, lung or SkM. Ki67+ marks proliferating cells. Scale bar: 100 μm for lung, brain and BoMa; 10 μm for muscle. n = 15 cells each. For c, e and g, centre line represents the mean, and error bars the standard error of the mean (s.e.m.).
Extended Data Fig. 3 |
Extended Data Fig. 3 |. Metabolic comparison of SkM-metastatic 4T1 cells pre- and post-injection reveal that 4T1-SkM adapt to SkM.
a) PLS-DA score plot comparing 4T1-parental and 4T1-SkM cells in tissue culture against 4T1-SkM SkM metastases, 4T1-SkM lung metastases, healthy SkM and healthy lung. b) Fold change enrichment of GSH-related metabolites (defined by KEGG’s GSH metabolism set) for 4T1-SkM v. 4T1-parental in culture, SkM metastases v. 4T1-SkM in culture, and lung metastases v. 4T1-SkM in culture. c) Metabolite Set Enrichment of the metabolites that were 2-fold enriched in healthy SkM versus healthy lung. Over Representation Analysis used the hypergeometric test; one-tailed P-values were provided after adjusting for multiple testing. d) Table displaying the mean values for the GSH-related metabolites in healthy SkM and healthy lung, followed by the fold-change difference between the two. e) Dot-plot of the ratio of reduced to oxidized glutathione (GSH:GSSG) for 4T1-SkM and 4T1-parental in culture, healthy SkM and healthy lung, and SkM- and lung- metastases. n = 3 replicates for 4T1-parental and 4T1-SkM culture samples. n = 4 muscle- and 3 lung- metastases, 6 healthy muscle and 3 healthy lung. An one-way ANOVA, followed by uncorrected Fisher’s LSD, was performed where *** P = 0.0004 for 4T1-parental v 4T1-SkM, **** P < 0.0001 for healthy SkM v. lung, * P = 0.037 for SkM metastases v. lung metastases. For e, centre line represents the mean, and error bars the standard error of the mean (s.e.m.).
Extended Data Fig. 4 |
Extended Data Fig. 4 |. H2o2 is generated upon D-alanine treatment in a dose-dependent fashion in DAAo-expressing tumour cells and lung fibroblasts.
a) Workflow to test if D-/L-alanine stimulated H2O2 in MDA231-WT and -DAAO. b) Extracellular H2O2 of MDA231-WT and -DAAO treated with D-/L-alanine. n = 3 replicates, performed twice. Two-way ANOVA was used, followed by Dunnett’s test. Compared against untreated MDA231-DAAO mean- 1 h: *P = 0.028,100 mM D-ala. 4 h: ***P = 0.0001, 100 mM D-ala; **P = 0.0017, 20 mM D-ala; **P = 0.0019, 100 mM D-ala MDA231-WT. 8 h: ***P = 0.0001, 100 mM L-ala, 20 mM L-ala. *P = 0.023, 100 mM D-ala MDA231-WT; * P = 0.018, 20 mM D-ala MDA231-WT. 24 h: ***P = 0.000, 100 mM D-ala; *P = 0.011, 100 mM L-ala. 48 h: ***P = 0.000, 100 mM D-ala. All other P > 0.05. c) MDA231-WT and -DAAO outgrowth with D-/L-alanine. n = 3 replicates, performed twice. Two-way ANOVA, followed by Dunnett’s test: compared against untreated MDA231-DAAO- 48 h: ***P = 0.0001, 100 mM D-ala; **P = 0.0011, 100 mM D-ala MDA231-WT; **P = 0.0036, 20 mM D-ala MDA231-WT; *P = 0.04, untreated MDA231-WT. 72 h: ***P = 0.0001, 100 mM D-ala, untreated MDA231-WT, 20 mM L-ala MDA231-WT. All others P > 0.05. d) Workflow to test if D-/L-alanine stimulates H2O2 in LF-DAAO. e) Extracellular H2O2 in LF-DAAO and LF treated with D-/L-alanine. n = 3 replicates per condition, performed twice. Two-way ANOVA, followed by uncorrected Fisher’s LSD: ****P < 0.0001, LF-DAAO 100 mM D-ala v. LF 100 mM D-ala, LF-DAAO 100 mM D-ala v. LF-DAAO 100 mM L-ala (4 h). 8 h: *P = 0.03, LF-DAAO 50 mM D-ala v. LF 50 mM D-ala; ****P < 0.0001, 70-, 100-mM D-ala LF-DAAO v. LF. 24 h: * P = 0.033, LF-DAAO 20 mM D-ala v. LF 20 mM D-ala; ** P = 0.004, LF-DAAO 30 mM D-ala v. LF 30 mM D-ala. **** P < 0.0001, 40-, 50-, 70-, 100-mM D-ala LF-DAAO v. LF. 48 h: *** P = 0.0006, LF-DAAO 30 mM D-ala v. LF 30 mM D-ala. **** P < 0.0001, 40-, 50-, 70-, 100-mM D-ala LF-DAAO v. LF. Other LF-DAAO v. LF comparisons with D-ala P > 0.05. For b-c and e, error bars represent the s.e.m.
Extended Data Fig. 5 |
Extended Data Fig. 5 |. Targeting catalase to the tumour cell mitochondria does not promote lung colonization.
a) Representative Western blots of MDA231 and EO771 -Ctl, -mCAT and -cCAT. b) Dot-plots of MDA231 and EO771 -Ctl, -mCAT or -cCAT outgrowth on LF. n = 10–15 replicates, performed in triplicate. One-way ANOVA, followed by Dunnett’s test, was performed. Mean of each condition compared against Ctl mean: P = 0.43, MDA231-Ctl v mCAT; P = 0.35, MDA231-Ctl v cCAT,; **** P < 0.0001, EO771-Ctl v mCAT, EO771-Ctl v cCAT. c) NOD-SCID study to examine if ectopic catalase promoted lung colonization. d) BLI measurements (total flux, photon/second) for MDA231-Ctl, -mCAT and -cCAT. n = 5 mice per cohort. Two-way ANOVA, followed by Tukey’s test, was performed. Week5- *P = 0.032, MDA231-Ctl v mCAT; *P = 0.027, MDA231-Ctl v cCAT. Week6- ****P < 0.0001, MDA231-Ctl v. mCAT, Ctl v. cCAT, e) BLI total flux for MDA231-Ctl, -mCAT and -cCAT in lung ex vivo. n = 5 mice per cohort. One-way ANOVA, followed by Tukey’s test, was performed: *P = 0.028, Ctl v mCAT; *P = 0.026, Ctl v cCAT. f) Quantification of MDA231-Ctl, -mCAT and -cCAT lesions in lung, with representative images of tumour burden. Arrows point to small GFP+ lesions. n = 5 mice per cohort. Scale bar, 1 mm. One-way ANOVA was performed, followed by Dunnett’s test, to determine **P = 0.0044, MDA231-Ctl v. mCAT; *** P = 0.0008, MDA231-Ctl v. cCAT. g) C57BL/6 study to examine if ectopic catalase promoted lung colonization. h) BLI total flux for EO771-Ctl and -mCAT. n = 5 mice per cohort. Two-way ANOVA, followed by Sidak’s test, was performed. Week2- *P = 0.039, EO771-Ctl v mCAT. i) BLI total flux for EO771-Ctl and -mCAT tumours in lung ex vivo. n = 5 mice per cohort. Unpaired two-tailed t-test was performed, where EO771-Ctl v mCAT, *P = 0.026. j) Quantification of EO771-Ctl and -mCAT lesions in lung, with representative images of tumour burden. Scale bar, 1 mm. Unpaired two-tailed t-test was performed where **P = 0.0036. For b, e-f and i-j, centre line represents mean, and error bars the s.e.m.
Fig. 1 |
Fig. 1 |. Breast cancer cells traffic to and persist within SkM.
a, Locations surveyed for the identification of human breast cancer cells in SkM from patients with MBC. b, Images of a multiplex immunohistochemistry panel of a breast tumour and SkM with disseminated breast cancer cells. ER and PR in purple, pan-CK in yellow. Haematoxylin and eosin (H&E)-stained muscle in second panel from the left. Scale bars, 20 μm (tumour cells in SkM), 50 μm (primary tumour) or 500 μm (SkM H&E). c, Schematic of the orthotopic (mammary fat pad, MFP) mouse study used to determine whether tumour cells spontaneously traffic to SkM. d, Schematic of the experiment used to determine the sensitivity of detection of the AluYb8 qPCR method. e, AluYb8 qPCR limit of detection, reflected by cycle of quantification (Cq) and log of the starting quantity (SQ). n = 3 replicates, repeated in triplicate. One-way analysis of (ANOVA), followed by an uncorrected Fisher’s least significant difference (LSD), was used to analyse the OP-9-only negative control against all others, where ****P < 0.0001 for all comparisons, except OP-9 only versus no template control (NTC). f, AluYb8 amplification (fold-change) in tumours 3 weeks after tumour resection. n = 5 inoculated and 3 uninoculated mice. Two-way ANOVA was performed, followed by uncorrected Fisher’s LSD, where P < 0.0001 for lung and quadriceps when comparing tumour-bearing tissue against uninoculated controls. P = 0.007 for tumour-bearing TA versus uninoculated and P = 0.002 for tumour-bearing gastrocnemius versus uninoculated. n = 5 inoculated and 3 uninoculated mice. g, Representative images for Ce3D-cleared lung and TA of MDA-MB-231-bearing mice. Insets are GFP+ tumours cells in lung and TA. Scale bars, 100 μm (insets) or 1 mm (whole tissue). h, Percentage of GFP+ tumour area normalized by total tissue area for lung, TA, gastrocnemius and quadriceps. One-tailed unpaired t-tests, with Welch’s correction, were performed for comparison of GFP area in tumour-bearing tissue against uninoculated, where P = 0.0003 for lung, P = 0.051 for TA, P = 0.039 for gastrocnemius and P = 0.084 for quadriceps. n = 5 inoculated and 3 uninoculated mice. For e, f and h, the centre line represents the mean, and error bars the s.e.m.
Fig. 2 |
Fig. 2 |. Myotubes suppress breast and mammary cancer cells in culture, but not through a secreted or deposited factor.
a, Schematic of the experiment used to determine whether organotypic culture models of SkM suppress breast and mammary cancer cell outgrowth. b, Representative images of human lung (LF) and SkM (SkMc) organotypic niches. Scale bar, 10 mm. c, Outgrowth (YFP area fraction) of a panel of breast and mammary cancer cell lines on SkMcs and LFs. n = 8–10 replicates, repeated in triplicate. Multiple two-sided unpaired t-tests were performed, followed by Holm–Sidak’s multiple comparison test, where outgrowth on SkMcs versus LFs was ****P < 0.0001 for all comparisons. d, Representative images of breast and mammary cancer outgrowth on the SkMc niche. Scale bar, 10 mm. e, MDA-MB-231 outgrowth on LF and SkMc niches when treated daily with CM from LF or SkMc monoculture. n = 10–15 replicates, performed in triplicate. One-way ANOVA was performed, followed by Dunnett’s multiple comparisons test, to find P > 0.05. NS, not significant. f, MDA-MB-231 outgrowth on LFs and SkMcs when treated with EVs collected from SkMc monoculture. n = 7 replicates, performed in duplicate. Compared against untreated control, P > 0.1 for all conditions when one-way ANOVA, followed by Dunnett’s multiple comparisons test, was performed. g, MDA-MB-231 outgrowth on decellularized LFs or SkMcs, compared with outgrowth on intact LFs and SkMcs. n = 5–8 replicates, performed in triplicate. ****P < 0.0001 for the following when two-way ANOVA, followed by Sidak’s multiple comparisons test, was performed: intact LFs versus intact SkMcs, intact LFs versus decellularized LFs, intact SkMcs versus decellularized SkMcs. ***P = 0.0004 for intact LFs versus decellularized SkMcs, **P = 0.005 for intact SkMcs versus decellularized LFs, **P = 0.0088 for decellularized LFs versus decellularized SkMcs, ***P = 0.0005 for decellularized LFs versus decellularized SkMcs, and ****P < 0.0001 for intact LFs versus intact SkMcs when unpaired two-tailed t-tests were performed. h, MDA-MB-231 outgrowth when co-cultured on a LF–SkMc mixture, LF-only or SkMc-only. n = 5–8 replicates, performed in triplicate. ****P < 0.0001 when all conditions compared against LF-only using one-way ANOVA, followed by Dunnett’s multiple comparisons test. For c, eh, the centre line represents the mean, and error bars the s.e.m.
Fig. 3 |
Fig. 3 |. GSH metabolism is enriched in SkM metastases.
a, Schematic of the derivation of a SkM-metastatic 4T1 subline (4T1-SkM). b, Schematic of the collected tissue samples and comparisons made for metabolomics analysis. c, KEGG MSEA of (SkM metastasis versus healthy SkM)/(lung metastasis versus healthy lung), referred to as comparison 3. Over representation analysis used the hypergeometric test; one-tailed P values were provided after adjusting for multiple testing. d, Heatmap displaying the row minimum (min) and maximum (max) for the raw values of the healthy SkM and SkM metastasis (Met) samples. Metabolites in the heatmap represent those that were at least 2-fold increased or 50% decreased in comparison 3, P < 0.1. Black circles denote the GSH metabolism metabolite set from KEGG. e, Heatmap displaying the row min–max for the raw values of the healthy lung and lung metastasis samples. Metabolites in the heatmap represent those that were at least 2-fold increased or 50% decreased in comparison 3, P < 0.1. Black circles denote the GSH metabolism metabolite set from KEGG. f, Schematic of the chemical reaction for GSH-mediated H2O2 detoxification. g, Dot plot of the ratio of reduced to oxidized glutathione (GSH:GSSG) for healthy SkM and lung. n = 6 healthy SkM, 3 healthy lung. Unpaired two-sided t-test was performed, where ****P < 0.0001 for healthy lung versus healthy SkM. h, Dot plot of GSH:GSSG ratio for SkM metastasis and lung metastasis. n = 4 SkM metastasis and 3 lung metastasis. Metastasis samples were collected from seven mice. Unpaired two-sided t-test was performed, where *P = 0.038 for lung metastasis versus muscle metastasis. i, Dot plot of the GSH:GSSG ratio in SkM compared with the GSH:GSSG in lung for both healthy and metastasis samples. Unpaired two-sized t-test was used, where ****P = 0.003. n = 3–5 per condition. For eh, the centre line represents the mean, and error bars the s.e.m.
Fig. 4 |
Fig. 4 |. The SkMc niche causes unchecked oxidative stress in DTCs.
a, Schematic of the Grx1-roGFP2 redox biosensor used to measure GSH-specific oxidative stress. b, Left: MDA231-roGFP2 oxidation state on LFs and SkMcs. n = 8 replicates, performed in triplicate. Two-way ANOVA, followed by Sidak’s test: *P = 0.036, 4 days; ****P < 0.0001, 6, 8 and 10 days. P = 0.07, 2 days. Right: representative image of MDA231-roGFP2 on SkMcs (oxidized) and LFs (reduced). Scale bar, 100 μm. c, MDA231-roGFP2 outgrowth on LFs and SkMcs. n = 10 replicates, performed in triplicate. Two-way ANOVA, followed by Sidak’s test: *P = 0.02, 0 day; ***P < 0.0001, 6, 8 and 10 days. P > 0.05, 2 and 4 days. d, MDA-MB-231 mean ROS intensity (arbitrary units (AU)) on LFs and SkMcs. n = 852 cells (LFs), 39 cells (SkMcs); repeated in triplicate. Unpaired two-tailed t-test, ****P < 0.0001. e, Representative MDA-MB-231 ROS on SkMcs and LFs. Scale bars, 50 μm (SkMc) or 100 μm (LF). f, ROS mean intensity for LFs, SkMcs and myotubes. n = 24 negative control, 23 LF, 24 SkMc wells. One-way ANOVA, followed by uncorrected Fisher’s LSD: ****P < 0.0001, negative control versus myotubes, LF versus myotubes, SkMc versus myotubes. All other *P > 0.05. g, Extracellular H2O2 in LFs and SkMcs. n = 8 replicates, repeated in triplicate. Two-way ANOVA, followed by Tukey’s test: ****P < 0.0001, LF versus SkMc (3 and 7 days); *P = 0.011, LF versus SkMc (10 days). h, Extracellular H2O2 in LF-only, SkMc-only or LF–SkMc mixture. n = 5 replicates, repeated in duplicate. Two-way ANOVA, followed by Sidak’s test: mean compared against LF-only: *P = 0.049, 1:20; *P = 0.04, 1:50; **P = 0.0002, 1:100; ***P = 0.0001, SkMc-only. All other P > 0.05. i, Timeline of the NOD-SCID mouse study to determine whether DTCs are oxidized in vivo. j, MDA231-roGFP2 oxidation in SkM and lung. n = 13 cells (muscle), 35 cells per lesions (lung). One-way ANOVA, followed by Dunnett’s test: compared against single cells- lung, P = 0.053, doublets; ***P = 0.0001; 3–10 and 11+ cells clusters. k, Visualization of metastases/DTCs in lung (reduced) and muscle (oxidized). Scale bar, 50 μm. n = 13 cells (muscle), 35 cells per lesions (lung). For c, d, fh and j, the centre line represents mean, and error bars the s.e.m.
Fig. 5 |
Fig. 5 |. Sustained oxidative stress prevents DTC outgrowth in lung and muscle.
a, MDA231-roGFP2 outgrowth on LFs and SkMcs with 75 μM, 125 μM H2O2. n = 6 replicates, repeated in triplicate. Two-way ANOVA, with Dunnett’s test: compared to untreated LF, *P = 0.029, untreated SkMc; *P = 0.032, 125 μM/LFs (8 days). ***P = 0.0001, untreated SkMc; *P = 0.033, 75 μM/LFs; ***P = 0.0001, 125 μM/LFs (10 days). b, MDA231-roGFP2 oxidation state on LFs and SkMcs with 75 μM or 125 μM H2O2. n = 5 replicates, repeated in duplicate. Two-way ANOVA, with uncorrected Fisher’s LSD: compared against untreated LF, ****P < 0.0001, untreated SkMc (1, 5 and 10 days). *P = 0.011, 125 μM/LF (1 day). **P = 0.0096, 75 μM/LFs; ****P < 0.0001, 125 μM/LFs (10 days). c, Schematic of H2O2 generator DAAO biochemistry. d, Schematic of the experiment used to test whether increased tumoural H2O2 stunts outgrowth on niches. e, MDA231-DAAO or MDA231-WT cell outgrowth on LFs with l-alanine (l-ala) or d-alanine (d-ala) treatment. n = 4–5 replicates, repeated in triplicate. One-way ANOVA, with Tukey’s test: day 10, compared to untreated DAAO+, all d-alanine ****P < 0.0001. ****P < 0.0001, 10 mM d-alanine versus l-alanine, 10 mM d-alanine DAAO versus WT. All others P > 0.05. f, Representative images of MDA231-DAAO cell outgrowth on LFs. Scale bar, 10 mm. g, MDA231-DAAO or MDA231-WT cell outgrowth on SkMcs following l-alanine or d-alanine treatment. n = 4–5 replicates, repeated in triplicate. One-way ANOVA, with Tukey’s test: day 5, compared to untreated DAAO+, all d-alanine ****P < 0.0001 (SkMc). ***P = 0.0004, 10 mM d-alanine DAAO versus WT; *P = 0.012, 10 mM d-alanine versus l-ala. Day 10, compared to untreated DAAO+, all d-alanine ****P < 0.0001 (SkMc). *P = 0.01, 10 mM d-alanine in DAAO versus WT. **P = 0.0006, 10 mM d-alanine versus l-alanine. ****P < 0.0001, 20 mM d-alanine DAAO versus WT. **P = 0.0007, 20 mM d-alanine versus l-alanine. ****P < 0.0001, 100 mM d-alanine DAAO versus WT, 100 mM d-alanine versus l-alanine. h, Representative images of MDA231-DAAO cell outgrowth on SkMcs. Scale bar, 10 mm. i, Schematic of the experiment used to test whether increased H2O2 in LF stunts tumour outgrowth. j, MDA231-WT cell outgrowth on LFs, LF-DAAO or SkMcs following d-alanine treatment. n = 3 replicates, repeated in triplicate. Two-way ANOVA, with uncorrected Fisher’s LSD: day 2.5, **P = 0.0013, untreated LF-DAAO versus LF; P = 0.06, untreated LF-DAAO versus SkMc; **P = 0.007, 30 mM LF-DAAO versus LF; ****P < 0.0001, 50 mM LF-DAAO versus LF. Day 5, ****P < 0.0001, untreated LF-DAAO versus LF, untreated LF-DAAO versus SkMc, 30 mM LF-DAAO versus LF, 50 mM LF-DAAO versus LF. For a, b, e, g and j, the centre line represents the mean, and error bars the s.e.m.
Fig. 6 |
Fig. 6 |. Enhanced tumoural antioxidant capacity enables SkM colonization in culture and in vivo.
a, ROS mean intensity of MDA231-Ctl, MDA231-mCAT and MDA231-cCAT cells in co-culture with LFs or SkMcs. For SkM, n = 39 (Ctl), 137 (mCAT) and 199 (cCAT). For LFs, n = 851 (Ctl), 200 (mCAT) and 233 (cCAT). Repeated in triplicate. One-way ANOVA, with Tukey’s test, where all comparisons ****P < 0.0001 except LF/mCAT versus LF/cCAT, P = 0.53. b, Dot plot of MDA231-Ctl, MDA231-mCAT and MDA231-cCAT cell outgrowth on SkMcs. n = 10 replicates, repeated in triplicate. One-way ANOVA, followed by Dunnett’s test: MDA231-Ctl versus mCAT, **P = 0.009; MDA231-Ctl versus cCAT, ****P = 0.0001. c, Representative images of MDA231-Ctl, MDA231-mCAT and MDA231-cCAT cell outgrowth on SkMcs. Scale bar, 20 mm. d, EO771-Ctl, EO771-mCAT and EO771-cCAT cell outgrowth on SkMcs. n = 10 replicates, repeated in triplicate. One-way ANOVA, with Dunnett’s test where ***P = 0.0001, MDA231-Ctl versus mCAT; **P = 0.001, MDA231-Ctl versus cCAT. e, Representative EO771-Ctl, -mCAT or -cCAT outgrowth on SkMc. Scale bar, 20 mm. f, Schematic of the NOD-SCID mouse study to examine whether ectopic catalase promoted muscle colonization in vivo. g, BLI total flux for MDA231-Ctl, MDA231-mCAT and MDA231-cCAT cells. n = 10 mice. Two-way ANOVA, followed by Dunnett’s test: week 11, ****P < 0.0001, Ctl versus mCAT. All others P > 0.05. h, Images of MDA231 total flux of TA ex vivo (week 11 for mCAT, week 16 for Ctl and cCAT). i, Immunofluorescence quantification (number of lesions per lesion size) of MDA231 at endpoint. n = 4 tissues. Chi-square test for trend performed, Ctl versus CAT (catalase cohorts grouped) *P = 0.016. jl, Representative immunofluorescence images of MDA231-Ctl (j), MDA231-mCAT (j) and MDA231-cCAT (l) DTCs/lesions in SkM. Scale bar, 100 μm. m, Schematic of the C57BL/6 mouse study to examine whether ectopic catalase promoted colonization of SkM. n, BLI total flux for EO771-Ctl and EO771-mCAT cells. n = 14 mice. Two-way ANOVA, followed by uncorrected Fisher’s LSD: **P = 0.0032, week 3; P = 0.09, week 4. All other P > 0.8. o, Representative BLI total flux and immunofluorescence images for EO771-Ctl and EO771-mCAT cells. Scale bar, 100 μm. For a, b and d, the centre line represents the mean, and error bars the s.e.m. For i, the centre line represents the median, and whiskers the smallest and largest values.
Fig. 7 |
Fig. 7 |. Reduction of tumoural or environmental mtRoS stimulates SkM colonization but hinders lung colonization.
a, Schematic of the C57BL/6 mouse study to examine whether ectopic catalase in the muscle environment promotes colonization. b, Representative BLI total flux images for EO771-Ctl and EO771-mCAT cells SkM in WT (left) and MCAT (right) mice. cf, Quantification of BLI total flux for EO771-Ctl (c,e) and EO771-mCAT (d,f) in WT (c,d) or MCAT (e,f) mice. n = 19 mice per WT cohort, 9 mice per MCAT cohort. Two-way ANOVA, followed by uncorrected Fisher’s LSD: **P = 0.0065, EO771-Ctl versus EO771-mCAT in WT mice (week 3); P = 0.07, EO771-Ctl/WT mice versus EO771-mCAT/MCAT mice (week 4). ****P < 0.0001, EO771-Ctl/WT mice versus EO771-Ctl/MCAT mice (week 5). All other EO771-Ctl/WT mouse comparisons P > 0.15. g, Schematic of the C57BL/6 mouse study to examine whether ectopic catalase in the lung environment promotes colonization. h, BLI quantification for EO771-Ctl and EO771-mCAT cell injected into WT or MCAT mice. n = 15 WT, 10 MCAT mice per cohort. Two-way ANOVA, followed by Dunnett’s test: **P = 0.0003, EO771-Ctl in WT versus MCAT mice; ***P = 0.0001, EO771-Ctl versus EO771-mCAT in WT mice, EO771-Ctl/WT mice versus EO771-mCAT/MCAT mice (week 2). All others P > 0.05. i, Representative BLI images for EO771-Ctl and EO771-mCAT cells in WT and MCAT mice. j, BLI quantification of lungs ex vivo from WT and MCAT mice with EO771-Ctl and EO771-mCAT cells. n = 15 WT, 10 MCAT mice per cohort. One-way ANOVA, followed by Dunnett’s test: *P = 0.038, EO771-Ctl versus EO771-mCAT in WT mice; *P = 0.018, EO771-Ctl/WT mice versus EO771-mCAT/MCAT mice. P = 0.069, EO771-Ctl in WT versus MCAT mice. k, Quantification of EO771-Ctl and EO771-mCAT lesions in WT or MCAT mouse lungs. n = 15 WT, 10 MCAT mice per cohort. One-way ANOVA, followed by Dunnett’s test: ***P = 0.0001, EO771-Ctl versus EO771-mCAT in WT mice; **P = 0.005, EO771-Ctl/WT mice versus EO771-mCAT/MCAT mice. P = 0.996, EO771-Ctl in WT versus MCAT mice. l, Representative images of lung ex vivo (mCherry) from WT and MCAT mice with EO771-Ctl and EO771-mCAT. Scale bar, 1 mm. n = 15 WT, 10 MCAT mice per cohort. For cf, h, j and k, the centre line represents the mean, and error bars the s.e.m.
Fig. 8 |
Fig. 8 |. mtRoS induced by the SkM niche resolves with mitochondrial catalase expression in tumour cells or in myocytes.
a, Mean mtROS intensity for MDA231-Ctl and MDA231-mCAT cells on LFs or SkMc. n = 208 MDA231-Ctl (LFs), 662 MDA231-mCAT (LFs), 202 MDA231-Ctl (SkMc), 229 MDA231-mCAT (SkMc); repeated in triplicate. One-way ANOVA, with Tukey’s test: ****P < 0.0001, MDA231-Ctl on LFs versus SkMc, MDA231-Ctl/LFs versus MDA231-mCAT/SkMc. P = 0.17, MDA231-Ctl versus MDA231-mCAT (LFs). b, Representative images of mtROS in MDA231-Ctl and MDA231-mCAT cells. Scale bar, 50 μm (inset) or 100 μm. c, MDA231 outgrowth on LFs or SkMc. n = 5 wells, repeated in triplicate. One-way ANOVA, with uncorrected Fisher’s LSD: ****P < 0.0001 for all except MDA231-Ctl versus MDA231-mCAT (LF, P = 0.84). d, Mean mtROS intensity for EO771-Ctl and EO771-mCAT cells on LFs or SkM. n = 1,129 EO771-Ctl (LFs), 980 EO771-mCAT (LFs), 1080 EO771-Ctl (SkMc), 1133 EO771-mCAT (SkMc); repeated in triplicate. One-way ANOVA, with Tukey’s test: ****P < 0.0001, MDA231-Ctl versus MDA231-mCAT (LFs), MDA231-Ctl on LFs versus SkMc, MDA231-Ctl/LFs versus MDA231-mCAT/SkMc, MDA231-Ctl versus MDA231-mCAT (SkMc). e, Representative images of mtROS in EO771-Ctl and EO771-mCAT cells. Scale bar, 50 μm (inset) or 100 μm. f, EO771 outgrowth on LFs or SkMc. n = 5 wells per cohort, repeated in triplicate. One-way ANOVA, with uncorrected Fisher’s LSD: P = 0.13, EO771-Ctl versus EO771-mCAT (LFs); **P = 0.0002, MDA231-Ctl on LFs versus SkMc; **P = 0.0011, EO771-Ctl versus EO771-mCAT (SkMc). P = 0.053, EO771-mCAT on LFs versus SkMc; P = 0.78, EO771-mCAT/LFs versus EO771-Ctl/SkMc; P = 0.48, EO771-Ctl/LFs versus EO771-mCAT/SkMc. g, EO771-Ctl outgrowth on WT, MCAT-1 or MCAT-2. n = 5 wells, repeated twice. One-way ANOVA, with Dunnett’s test: ****P < 0.0001, WT versus MCAT-1; **P = 0.0027, WT versus MCAT-2. h, Mean mtROS intensity for EO771-Ctl on WT, MCAT-1 and MCAT-2. n = 540 EO771-Ctl (WT), 346 EO771-Ctl (MCAT-1), 750 EO771-Ctl (MCAT-2); performed twice. One-way ANOVA, with Tukey’s test: ****P < 0.0001, WT versus MCAT-1, WT versus MCAT-2. P = 0.37, MCAT-1 versus MCAT-2. i, Representative images of mtROS in EO771-Ctl on WT, MCAT-1 or MCAT-2. Samples sizes same as h. Scale bars, 50 μm (inset) or 100 μm. For a, c, d and fh, the centre line represents the mean, and error bars the s.e.m.

References

    1. Paget S. The distribution of secondary growths in cancer of the breast. Lancet 133, 571–573 (1889). - PubMed
    1. Elia I. et al. Breast cancer cells rely on environmental pyruvate to shape the metastatic niche. Nature 568, 117–121 (2019). - PMC - PubMed
    1. Elia I. et al. Proline metabolism supports metastasis formation and could be inhibited to selectively target metastasizing cancer cells. Nat. Commun. 8, 15267 (2017). - PMC - PubMed
    1. Dupuy F. et al. PDK1-dependent metabolic reprogramming dictates metastatic potential in breast cancer. Cell Metab. 22, 577–589 (2015). - PubMed
    1. Tasdogan A. et al. Metabolic heterogeneity confers differences in melanoma metastatic potential. Nature 577, 115–120 (2020). - PMC - PubMed

Publication types

Substances