. 2022 Apr;24(4):554-564.
doi: 10.1038/s41556-022-00877-0. Epub 2022 Apr 11.

Genome-wide CRISPR screen identifies PRC2 and KMT2D-COMPASS as regulators of distinct EMT trajectories that contribute differentially to metastasis

Affiliations

Genome-wide CRISPR screen identifies PRC2 and KMT2D-COMPASS as regulators of distinct EMT trajectories that contribute differentially to metastasis

Yun Zhang et al. Nat Cell Biol. 2022 Apr.

Abstract

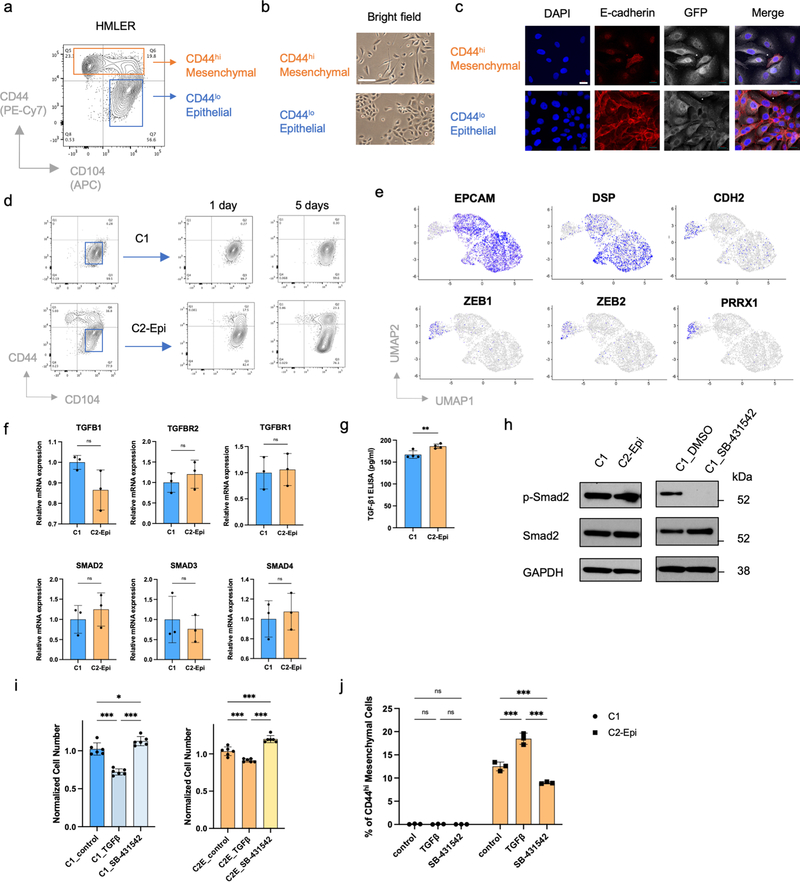
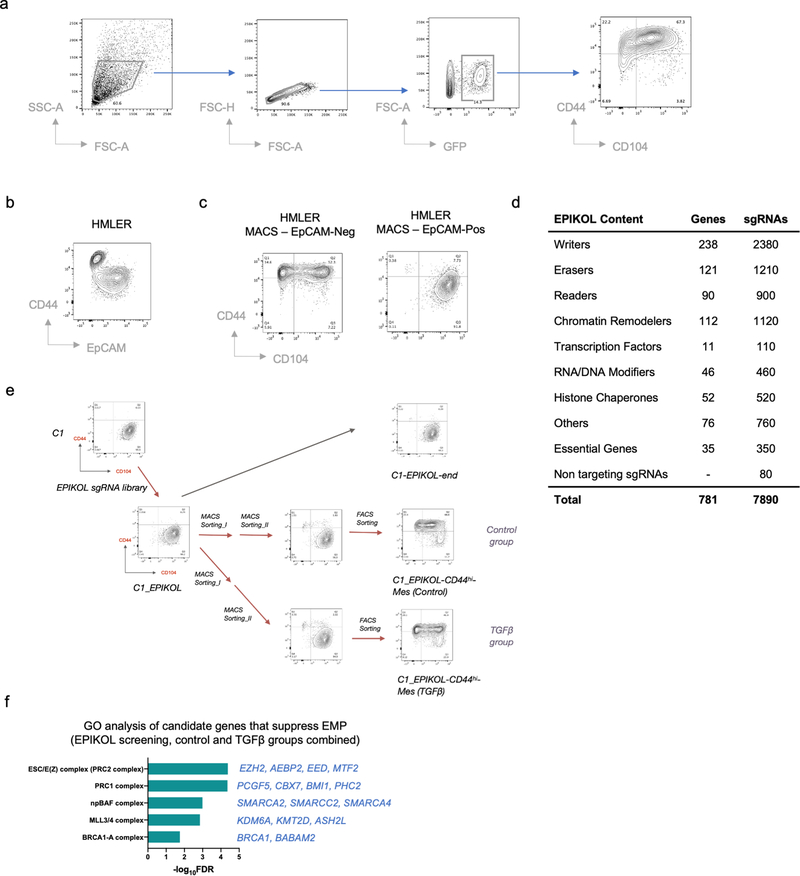
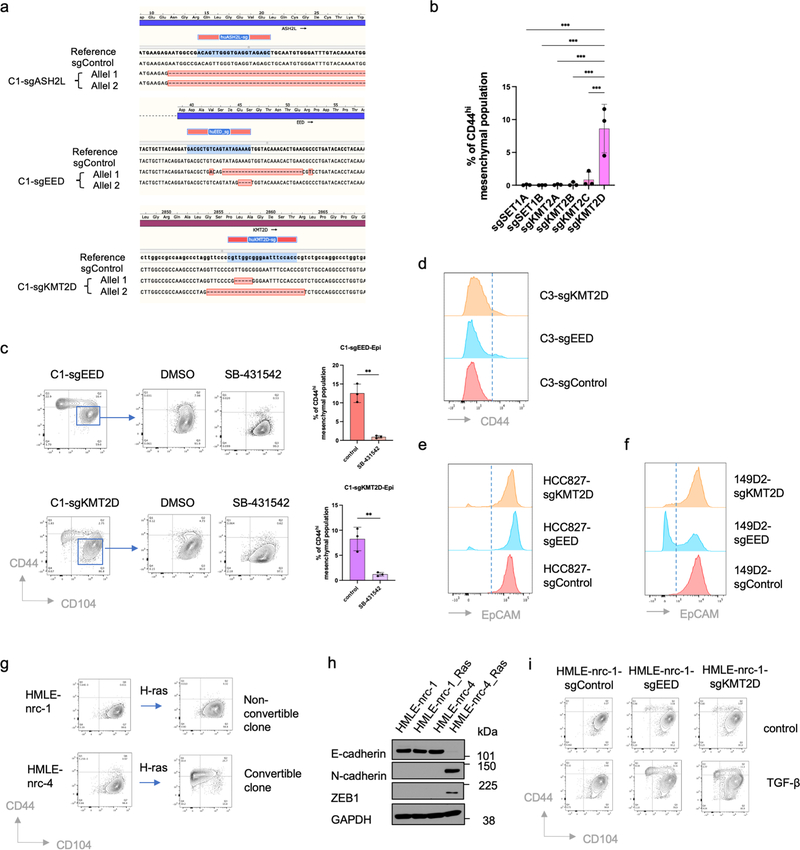
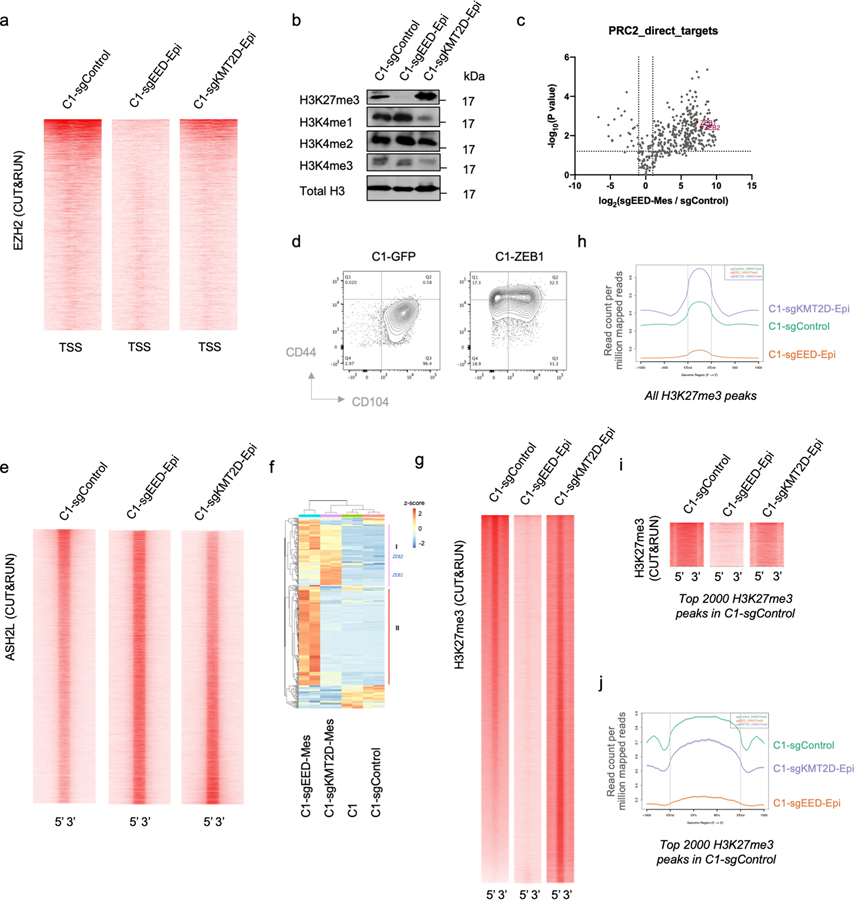
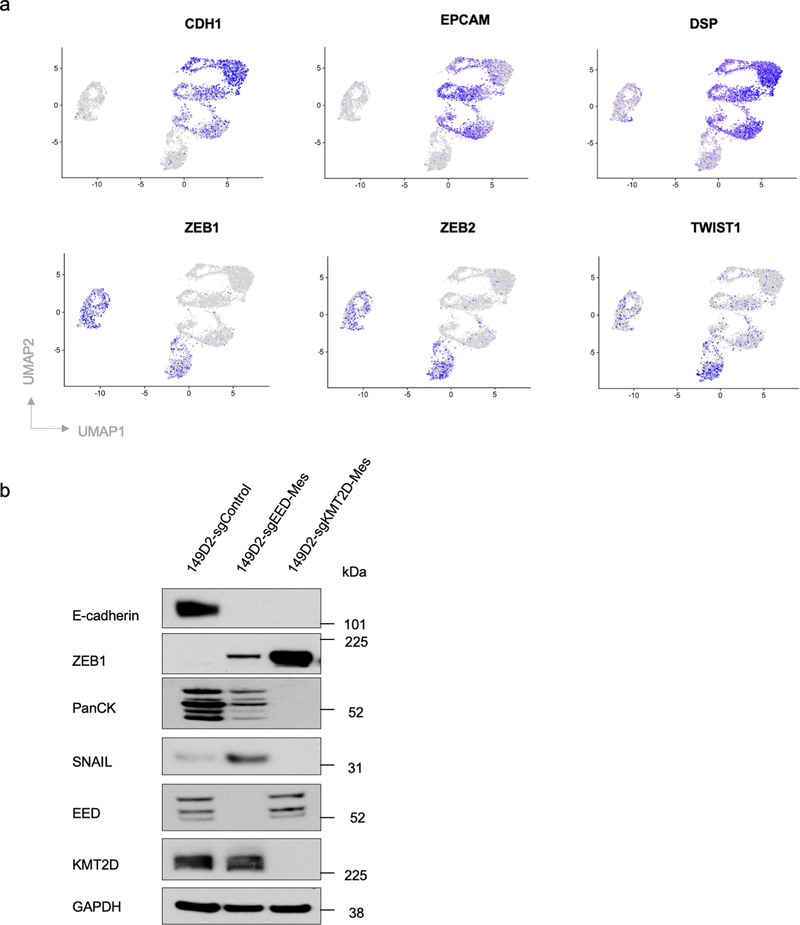
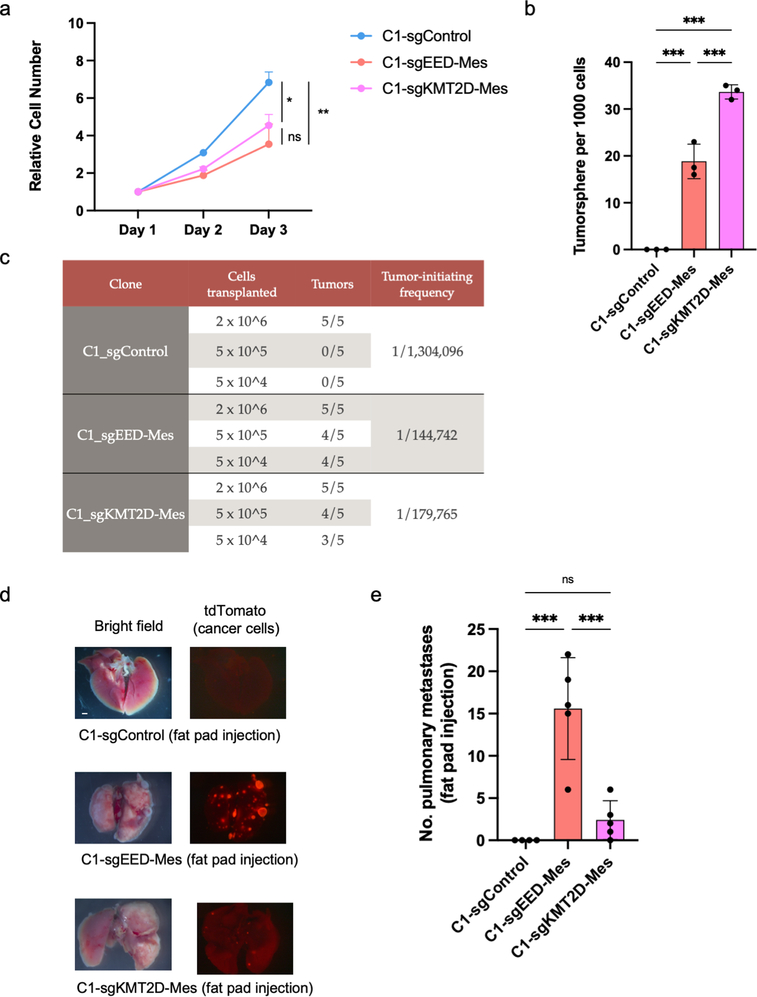
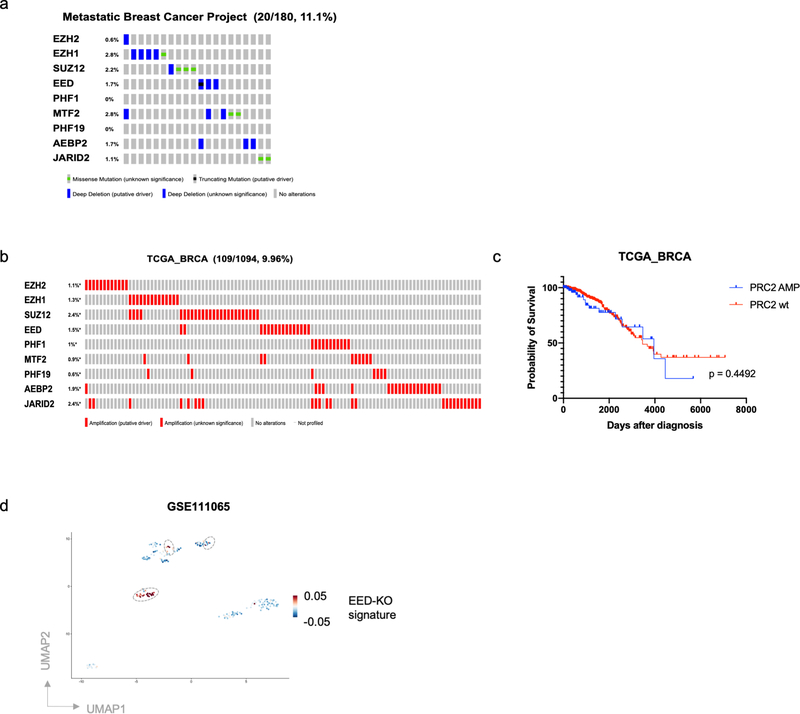
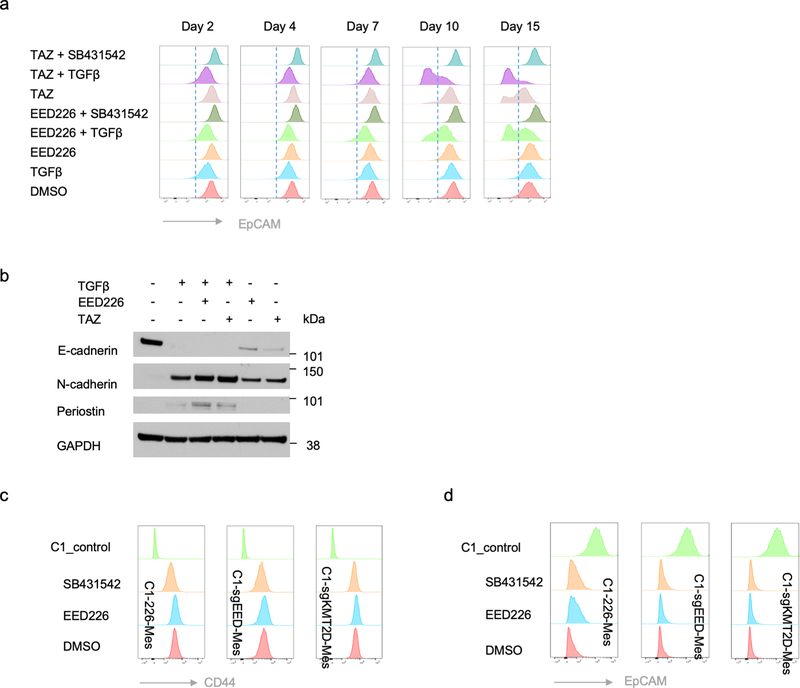
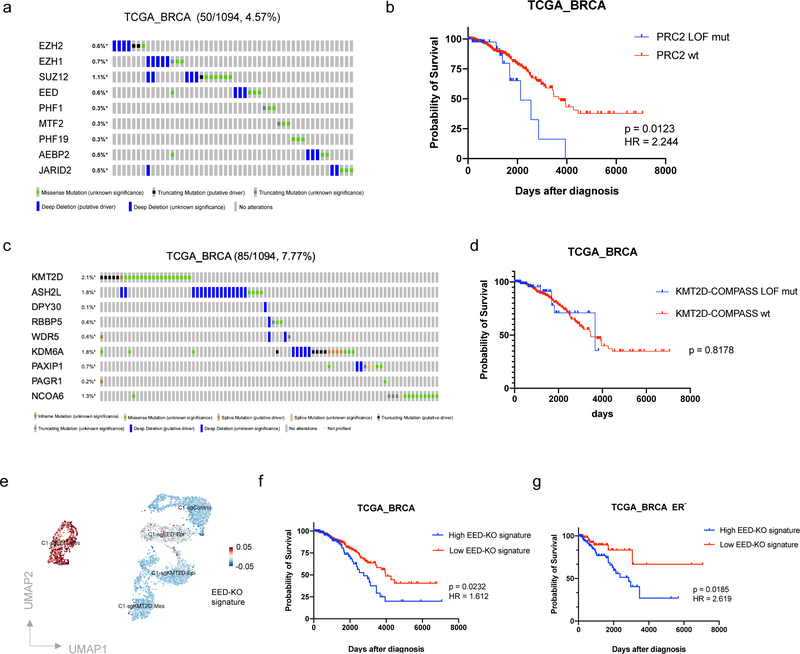
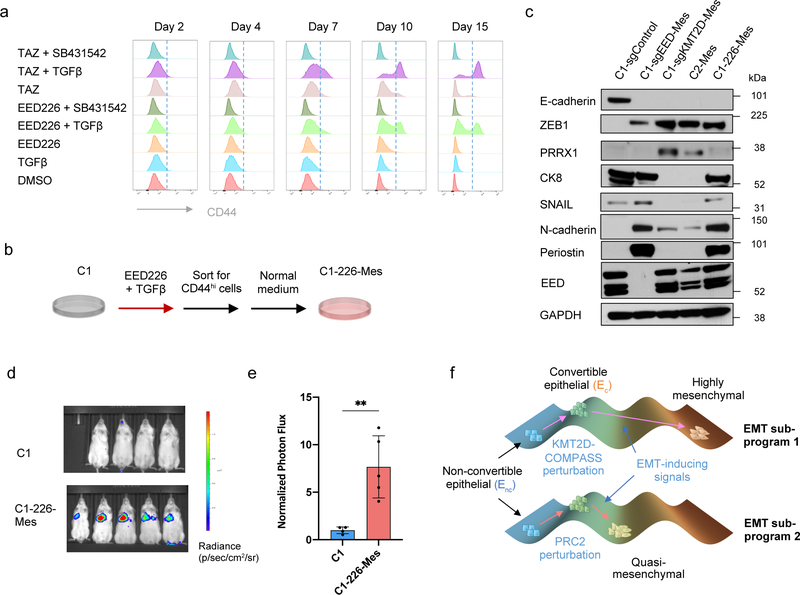
Epithelial-mesenchymal transition (EMT) programs operate within carcinoma cells, where they generate phenotypes associated with malignant progression. In their various manifestations, EMT programs enable epithelial cells to enter into a series of intermediate states arrayed along the E-M phenotypic spectrum. At present, we lack a coherent understanding of how carcinoma cells control their entrance into and continued residence in these various states, and which of these states favour the process of metastasis. Here we characterize a layer of EMT-regulating machinery that governs E-M plasticity (EMP). This machinery consists of two chromatin-modifying complexes, PRC2 and KMT2D-COMPASS, which operate as critical regulators to maintain a stable epithelial state. Interestingly, loss of these two complexes unlocks two distinct EMT trajectories. Dysfunction of PRC2, but not KMT2D-COMPASS, yields a quasi-mesenchymal state that is associated with highly metastatic capabilities and poor survival of patients with breast cancer, suggesting that great caution should be applied when PRC2 inhibitors are evaluated clinically in certain patient cohorts. These observations identify epigenetic factors that regulate EMP, determine specific intermediate EMT states and, as a direct consequence, govern the metastatic ability of carcinoma cells.


Conflict of interest statement

Competing Interests

A.R. is a cofounder and equity holder of Celsius Therapeutics, an equity holder of Immunitas and was an SAB member of Neogene Therapeutics, Thermo Fisher Scientific, Asimov and Syros Pharmaceuticals until 31 July 2020. Since 1 August 2020, A.R. is an employee of Genentech, a member of the Roche group. R.A.W. has a consulting agreement with Verastem Inc together with holding shares of this company. No other authors declare competing interests.

Figures

Extended Data Figure 1.
Extended Data Figure 1.. HMLER epithelial cells show differential EMP which is associated with different TGF-β responses.
a,b, Flow cytometry of the CD44 and CD104 cell-surface staining of HMLER cells (a) and Bright-phase microscopy (b) of FACS-sorted CD44hi mesenchymal cells and CD44lo epithelial cells. Scale bar, 20 μm. n = 3 biologically independent experiments. c, Immunofluorescence staining shows adherent junction protein E-cadherin in FACS-sorted CD44hi mesenchymal cells and CD44lo epithelial cells. Scale bar, 20 μm. n = 2 biologically independent experiments. d, Flow cytometry of the CD44 and CD104 cell-surface staining using CD44lo epithelial population sorted from C1 and C2 cells. Data were collected at 1 and 5 days after sorting. e, UMAP plots showing expression levels of epithelial marker genes EPCAM, DSP and mesenchymal marker genes CDH2, ZEB1, ZEB2 and PRRX1 in HMLER/C1/C2 cells. f, mRNA expression levels of TGFB1, TGFBR2, TGFBR1, SMAD2, SMAD3 and SMAD4 in C1, and C2-Epi cells. n=3. n.s., not significant. g. ELISA assay shows TGF-β1 protein secreted by C1 and C2-Epi cells. n=3. **, p = 0.009. h, Immunoblot of phosphor-Smad2 and total Smad2 in C1 and C2-Epi cells, as well as C1 cells treated with DMSO or SB-431542 (5 μM). GAPDH as loading control. n = 2 biologically independent experiments. i, Normalized cell number of C1 and C2-Epi cells after five-day culture in control, TGF-β (2 ng/ml) and SB-431542 (5 μM) treated conditions. n=6. *, p = 0.03; ***, p < 0.001. j, Percentage of CD44hi mesenchymal population of C1 and C2-Epi cells after five-day culture in control, TGF-β (2 ng/ml) and SB-431542 (5 μM) treated conditions. n=3. ***, p < 0.001. Statistical analysis was performed using unpaired two-tailed Student t-tests (f,g) or one-way ANOVA followed by Tukey multiple-comparison analysis (i,j). Data are presented as mean ± SEM. Numerical source data are provided.
Extended Data Figure 2.
Extended Data Figure 2.. CRISPR screening identifies EMP regulators.
a, Gating strategies used in FACS analysis and the CRISPR screens. One C2-Epi initiated primary tumor was used as an example. b, Flow cytometry of the CD44 and EpCAM cell-surface staining of HMLER cells, demonstrating CD44hi mesenchymal cell population does not express EpCAM. c, EpCAM-based magnetic-activated cell sorting (MACS) enriches CD44lo epithelial cells in MACS-EpCAMpos population and CD44hi mesenchymal cells in MACS-EpCAMneg population. d, A summary of EPIKOL sgRNA library content. e, Diagram of the EPIKOL CRISPR screening using nonconvertible C1 cells to identify possible regulators of E-M plasticity. f, List of significantly enriched GO cellular components terms from the EPIKOL CRISPR screening. Numerical source data are provided.
Extended Data Figure 3.
Extended Data Figure 3.. PRC2 and KMT2D-COMPASS regulate EMP.
a, Sanger sequencing demonstrate complete knock-out of ASH2L, EED and KMT2D genes in the corresponding clonal cells. b, Percentage of CD44hi mesenchymal population in C1 cells transduced with sgRNAs targeting SETD1A, SETD1B, KMT2A, KMT2B, KMT2C and KMT2D respectively. n=3. ***, p<0.001. Statistical analysis was performed using one-way ANOVA followed by Dunnett multiple-comparison analysis. Data are presented as mean ± SEM. c, Flow cytometry analysis shows the CD44 and CD104 cell-surface staining of sorted epithelial subpopulation from C1-sgEED and C1-sgKMT2D cells (left) and the quantification of CD44hi mesenchymal population in different culture conditions (right). Cells were cultured in control (DMSO) or SB-431542 (5 μM) treated condition in vitro for 5 days. n=3. **, p = 0.001 (C1-sgEED-Epi), 0.007 (C1-sgKMT2D-Epi). Statistical analysis was performed using unpaired two-tailed Student t-tests. Data are presented as mean ± SEM. d, Flow cytometry of the CD44 cell-surface staining of C3-sgControl, C3-sgEED and C3-sgKMT2D cells at the population level. e, Flow cytometry of the EpCAM cell-surface staining of HCC827-sgControl, HCC827-sgEED and HCC827-sgKMT2D cells at the population level. f. Flow cytometry of cell-surface EpCAM in SUM149D2-sgControl, SUM149D2-sgEED and SUM149D2-sgKMT2D cells at the population level. g, Immortalized but not transformed HMLE epithelial cells contain convertible (nrc-4) and non-convertible (nrc-1) single cell clones. RAS transformation promotes EMT in convertible clone but not in non-convertible clone. h, Immunoblot of E-cadherin, N-cadherin, and ZEB1 in representative HMLE clones before and after RAS oncogene transformation. GAPDH as loading control. n = 2 biologically independent experiments. i, Flow cytometry of the CD44 and CD104 cell-surface staining of HMLE-nrc-1-sgControl, HMLE-nrc-1-sgEED and HMLE-nrc-1-sgKMT2D cells in control or TGF-β treated (2 ng/ml) conditions for 7 days. HMLE-nrc-1 is a clonal cell population generated from HMLE that stably reside in an epithelial state. Numerical source data are provided.
Extended Data Figure 4.
Extended Data Figure 4.. PRC2 directly binds to the promoters of several EMT-TF genes and KMT2D-KO changes H3K27me3 genomic distribution.
a, Heatmap showing the global binding pattern of PRC2 (as measured by EZH2 CUT&RUN profiles) at promoter regions in C1-sgControl, C1-sgEED-Epi and C1-sgKMT2D-Epi cells. b, Immunoblot of H3K27me3 and H3K3me1/2/3 in C1-sgControl, C1-sgEED-Epi and C1-KMT2D-Epi cells. Total H3 as loading control. n = 2 biologically independent experiments. c, Majority of PRC2 direct target genes were up-regulated after EED knockout. d, Ectopic expression of EMT-TF ZEB1 is sufficient to activate an EMT program in C1 cells. e, Heatmap displaying the global COMPASS (as measured by ASH2L CUT&RUN profiles) occupancy in C1-sgControl, C1-sgEED-Epi, and C1-sgKMT2D-Epi cells. f, Heatmap showing mRNA expression levels of the 413 PRC2 direct genes. g, Heatmap showing all H3K27me3 peaks in C1-sgControl, C1-sgEED-Epi and C1-sgKMT2D-Epi cells. h, Average H3K27me3 signal of all H3K27me3 peaks in C1-sgControl, C1-sgEED-Epi and C1-sgKMT2D-Epi cells. i, Heatmap showing the top 2000 H3K27me3 peaks in C1-sgControl cells and the H3K27me3 signals in these same regions in C1-sgEED-Epi and C1-sgKMT2D-Epi cells. j, Average H3K27me3 signal of the top 2000 H3K27me3 peaks in C1-sgControl cells and average H3K27me3 signal in these regions in C1-sgEED-Epi and C1-sgKMT2D-Epi cells.
Extended Data Figure 5.
Extended Data Figure 5.. EED-KO and KMT2D-KO generate distinct mesenchymal cell states.
a, UMAP plots showing expression levels of epithelial marker genes CDH1, EPCAM, DSP and mesenchymal marker genes ZEB1, ZEB2 and TWIST1 in C1-sgControl, C1-sgEED and C1-sgKMT2D cells. b, Immunoblot of EMT-TFs SNAIL, ZEB1, EMT marker genes E-cadherin, pan-cytokeratines and EED, KMT2D in SUM149D2-sgControl, SUM149D2-sgEED-Mes and SUM149D2-sgKMT2D-Mes cells. n = 2 biologically independent experiments.
Extended Data Figure 6.
Extended Data Figure 6.. EED-KO quasi-mesenchymal cells show elevated ability in forming metastases.
a, Growth curve of C1-sgControl, C1-sgEED-Mes and C1-sgKMT2D-Mes cells in vitro. n=3. *, p = 0.03; **, p = 0.005. n.s., not significant.. b, Quantification of mammosphere formation by C1-sgControl, C1-sgEED-Mes and C1-sgKMT2D-Mes cells. n=3. ***, p<0.001. c, Differences in primary tumor-initiating ability of C1-sgControl, C1-sgEED-Mes and C1-sgKMT2D-Mes cells upon transplantation with limiting dilution into NSG mice. Tumors that arose from transplantation of 2 × 10⁶ cells were of similar size. n=5 in each group. d,e, Representative bright-phase and fluorescence microscopy (d) and number of metastatic nodules (e) shows metastatic outgrowths in the lung of C1-sgControl, C1-sgEED-Mes and C1-sgKMT2D-Mes cells 8 weeks after fat pad implantation. n=5 in each group. ***, p<0.001. n.s., not significant. Statistical analysis was performed using one-way ANOVA followed by Tukey multiple-comparison analysis. Data are presented as mean ± SEM. Numerical source data are provided.
Extended Data Figure 7.
Extended Data Figure 7.. PRC2 loss of function mutations and the EED-KO gene signature associate with poor prognosis in breast cancer patients.
a, OncoPrint (cBioPortal) showing patients with loss of function mutations of PRC2 component genes in Metastatic Breast Cancer Project patient cohort. b, OncoPrint (cBioPortal) showing patients with amplification of PRC2 component genes in TCGA breast patient cohort. c, Kaplan-Meier survival (log rank Mantel-Cox test) of TCGA breast cancer patients with or without amplification of PRC2 component genes. d, A proportion of breast cancer patient-derived CTCs was associated with the EED-KO gene signature. scRNA-seq data were derived from GSE111065 dataset. Grey circles highlight CTCs associated with the EED-KO signature.
Extended Data Figure 8.
Extended Data Figure 8.. PRC2 inhibitor treatment induces a metastatic, quasi-mesenchymal cell state.
a, Time-course flow cytometry analysis of the EpCAM cell-surface staining of C1 cells treated with different combinations of TGF-β (2ng/ml), SB-431542 (5μM), EED226 (10μM) and Tazemetostat (TAZ) (10μM). b, Immunoblot of E-cadherin, N-cadherin, Periostin in MCF10A cells treated with different combinations of TGF-β (2ng/ml), EED226 (10μM) and Tazemetostat (TAZ) (10μM) for 10 days. GAPDH as loading control. c,d, Flow cytometry analysis of the CD44 (c) and EpCAM (d) cell surface staining of C1 parental cells or C1–226-Mes, C1-sgEED-Mes and C1-sgKMT2D-Mes cells upon withdrawal of PRC2 inhibitors and addition of SB-431542 (5μM).
Figure 1.
Figure 1.. HMLER epithelial cells contain two subpopulations with different EMP.
a, Flow cytometry of the CD44 and CD104 cell-surface staining showing six representative single cell clones isolated from HMLER CD44lo epithelial subpopulation. In the HMLER model, CD104 represents a marker expressing at epithelial state and getting gradually lost after cells entered CD44hi mesenchymal state. b, Immunofluorescent microscopy shows epithelial hallmark E-cadherin expression in in vitro cultured C1 and C2 cells. Scale bar, 20 μm. n = 3 biologically independent experiments. c, Immunoblot of E-cadherin, and N-cadherin in C1, C2-Epi (CD44lo) and C2-Mes (CD44hi) cells, GAPDH as loading control. n = 2 biologically independent experiments. d, Uniform Manifold Approximation and Projection (UMAP) plot of parental HMLER cells mixed with representative single cell clones C1 and C2. Expression levels of epithelial hallmark gene CDH1/E-cadherin were shown in the right panel. Clusters are assigned to indicate cell subpopulations by differentially expressed genes. e, Distribution of representative single cell clones in the UMAP plot shown in panel d. f, UMAP plots showing co-culture of C1, C2 and parental HMLER cells does not change their respective cell states and EMP. C1, C2 and parental HMLER cells were barcoded before co-culture and all cells were sequenced simultaneously. g, Immunofluorescence staining shows E-cadherin expression in the primary tumors initiated from C1 or C2-Epi cells. Scale bar, 20 μm. GFP represents tumor cells. Representative of n=3 biologically independent experiments. h. Flow cytometry of the CD44 and CD104 cell-surface staining of GFP+ cancer cells from primary tumors initiated from C1 or C2-Epi cells. Representative of n=3 biologically independent experiments.
Figure 2.
Figure 2.. CRISPR screening identifies PRC2 and KMT2D-COMPASS as regulators of EMP.
a, Diagram of the CRISPR screening using non-convertible C1 cells to identify potential regulators of EMP. Enc, non-convertible epithelial cells. Ec, convertible epithelial cells. b, List of GO terms that were enriched in identified genes from the genome-wide CRISPR screening as guardians of the stable epithelial state. c, Plot showing the enrichment scores of genes examined using the EPIKOL CRISPR screening. Red and Purple dots indicate PRC2 and KMT2D-COMPASS components respectively. d, Flow cytometry analysis of the CD44 and CD104 cell-surface staining of single cell clones of C1-derived cells with control guide RNA or complete knock-out of ASH2L, EED or KMT2D genes. e, Heatmap displaying PRC2 occupancy (as measured by EZH2 CUT&RUN profiles) at gene promoters in C1-sgControl, C1-sgEED-Epi, C1-sgKMT2D-Epi and C2-Epi cells. 998 identified PRC2 direct target genes were shown in the plots. f, Average binding intensity of PRC2 in the promoter region of identified targets in C1-sgControl, C1-sgEED-Epi, C1-sgKMT2D-Epi and C2-Epi cells. The error bands represent the standard error of mean. g, Status of PRC2 occupancy at the promoters of EMT-TF genes ZEB1 and ZEB2, signal quantified as counts per million mapped reads. h, ZEB1 and ZEB2 were up-regulated in mouse epithelial cells after PRC2 core component SUZ12 knock-out. Red dots represent genes identified as PRC2 direct targets in HMLER-C1 cells. Numerical source data are provided.
Figure 3.
Figure 3.. Knocking-out PRC2 or KMT2D-COMPASS generates two distinct (quasi-)mesenchymal cell states.
a, UMAP plot showing different clusters of C1-sgControl, C1-sgEED and C1-sgKMT2D cells. b, Cell trajectory analysis revealed knocking-out EED and KMT2D specified two distinct EMT subprograms. Colors represent pseudotime along the learned trajectories, rooted in epithelial C1-sgControl cells. c, GSEA analysis showing the Hallmark EMT gene set was enriched in both C1-sgEED-Mes and C1-sgKMT2D-Mes cells compared with C1-sgControl cells. d, Heatmap of RNA-seq data, showing expression patterns of genes within the Hallmark EMT gene set in parental C1, C1-sgControl C1-sgEED-Mes, and C1-sgKMT2D-Mes cells. e, PCA analysis of samples examined in panel d, using all the genes within the Hallmark EMT gene set. Three representative genes including PRRX1, CDH2 and POSTN were shown for their contribution to determine the PCA plot. f, mRNA levels of EMT-TF genes SNAI1, ZEB1, PRRX1 and EMT marker genes CDH1, EPCAM, KRT8, CDH2 and POSTN showed different expression patterns in C1-sgControl, C1-sgEED-Mes and C1-sgKMT2D-Mes cells. n=2. *, p < 0.05; **, p < 0.01; ***, p < 0.001. n.s., not significant. Statistical analysis was performed using one-way ANOVA followed by Tukey multiple-comparison analysis. Data are presented as mean ± SEM. g, Immunoblot of EMT-TFs SNAIL, ZEB1, PRRX1, EMT marker genes E-cadherin, pan-cytokeratines, N-cadherin and periostin and EED, EZH2, KMT2D in C1-sgControl, C1-sgEED-Mes, C1-sgEZH2-Mes and C1-sgKMT2D-Mes cells. C1-sgEED(2)-Mes, C1-sgEZH2(2)-Mes, C1-sgKMT2D(2)-Mes were generated using alternative guide RNAs targeting different genomic segments of their corresponding genes. n = 2 biologically independent experiments. h, GSEA analysis showing C1-sgEED-Mes cells were enriched for multiple transcriptional signatures associated with stemness, elevated metastasis and poor prognosis. Numerical source data are provided.
Figure 4.
Figure 4.. EED-KO quasi-mesenchymal cells and KMT2D-KO highly mesenchymal cells show different abilities of metastatic colonization.
a,b, Representative bright-phase and fluorescence microscopy (a) and number of metastatic nodules (b) showing metastatic outgrowths in the lung of C1-sgControl, C1-sgEED-Mes and C1-sgKMT2D-Mes cells 6 weeks after tail vein injection. n=5 in each group. ***, p<0.001. n.s., not significant. Scale bar, 1000 μm. c, d, Representative data from flow cytometry analysis (c) and quantification (d) of tdTomato+ (cancer cells) in mouse lung tissue 6 weeks after intravenous cell inoculation. CD45+ and CD31+ stromal cells were removed by MACS sorting before analysis. n=3 biologically independent experiments. **, p = 0.005. e, Representative pictures of mouse lung tissues showing metastases initiated by C1-sgEED-Mes cells and dormant C1-sgKMT2D-Mes cells. Scale bar, 1000 μm (whole lung section) and 20 μm (insert). n = 5 biologically independent experiments. f. Immunofluorescence staining shows expression of GFP (cancer cells), pan-cytokeratin, E-cadherin, periostin and α-SMA in the primary tumor initiated by C1-sgControl, C1-sgEED-Mes and C1-sgKMT2D-Mes cells and lung metastases initiated by C1-sgEED-Mes cells. Scale bar, 20 μm. n = 3 biologically independent experiments. Statistical analysis was performed using one-way ANOVA followed by Tukey multiple-comparison analysis. Data are presented as mean ± SEM. Numerical source data are provided.
Figure 5.
Figure 5.. PRC2 dysfunction is associated with poor prognosis of breast cancer patients.
a, OncoPrint (cBioPortal) showing patients with loss of function mutations of PRC2 component genes in the TCGA breast cancer patient cohort. b, Kaplan-Meier survival (log rank Mantel-Cox test) of TCGA breast cancer patients with or without loss of function mutations of PRC2 component genes. c, OncoPrint (cBioPortal) showing patients with loss of function mutations of KMT2D-COMPASS component genes in TCGA breast patient cohort. d, Kaplan-Meier survival (log rank Mantel-Cox test) of TCGA breast cancer patients with or without loss of function mutations of KMT2D-COMPASS component genes. e, The EED-KO gene signature consisting PRC2 direct target genes that were uniquely up-regulated in C1-sgEED quasi-mesenchymal cell population. f,g, Kaplan-Meier survival (log rank Mantel-Cox test) of total (f) or ER-negative (g) breast cancer patients with high or low EED-KO signature scores.
Figure 6.
Figure 6.. Transient inhibition of PRC2 is sufficient to generate a metastatic, quasi-mesenchymal cell state.
a, Time-course flow cytometry analysis of the CD44 cell-surface staining of C1 cells treated with different combinations of TGF-β (2ng/ml), SB-431542 (5μM), EED226 (10μM) and Tazemetostat (TAZ) (10μM). b, C1–226-Mes cells were generated by treating C1 cells with EED226 and TGF-β for 10 days and then FACS-sorting the CD44hi population. c, Immunoblot of PRC2 component EED, EMT-TFs SNAIL, ZEB1, PRRX1 and EMT markers E-cadherin, Keratin 8, N-cadherin and Periostin in C1-sgControl, C1-sgEED-Mes, C1-sgKMT2D-Mes cells, C2-Mes and C1–226-Mes cells. n = 2 biologically independent experiments. d,e, Mice images (d) and quantification of bioluminescence (e) of mice intravenously injected with parental C1 or C1–226-Mes cells expressing luciferase reporter. Data were collected 14 days after cell injection. n=5. **, p = 0.005. Statistical analysis was performed using unpaired two-tailed Student t-tests. Data are presented as mean ± SEM. f, Schematic representation of the model in which loss of PRC2 and KMT2D-COMPASS enables EMP and specifies two EMT subprograms to generates distinct mesenchymal cell states. Numerical source data are provided.

References

    1. Tirosh I et al. Dissecting the multicellular ecosystem of metastatic melanoma by single-cell RNA-seq. Science 352, 189–196 (2016). - PMC - PubMed
    1. Patel AP et al. Single-cell RNA-seq highlights intratumoral heterogeneity in primary glioblastoma. Science 344, 1396–1401 (2014). - PMC - PubMed
    1. Puram SV et al. Single-Cell Transcriptomic Analysis of Primary and Metastatic Tumor Ecosystems in Head and Neck Cancer. Cell 171, 1611.e1–1611.e24 (2017). - PMC - PubMed
    1. McGranahan N & Swanton C Clonal Heterogeneity and Tumor Evolution: Past, Present, and the Future. Cell 168, 613–628 (2017). - PubMed
    1. Meacham CE & Morrison SJ Tumour heterogeneity and cancer cell plasticity. Nature 501, 328–337 (2013). - PMC - PubMed

Publication types

MeSH terms