. 2022 Apr;24(4):483-496.
doi: 10.1038/s41556-022-00869-0. Epub 2022 Apr 11.

Aggresome assembly at the centrosome is driven by CP110-CEP97-CEP290 and centriolar satellites

Affiliations

Aggresome assembly at the centrosome is driven by CP110-CEP97-CEP290 and centriolar satellites

Suzanna L Prosser et al. Nat Cell Biol. 2022 Apr.

Abstract

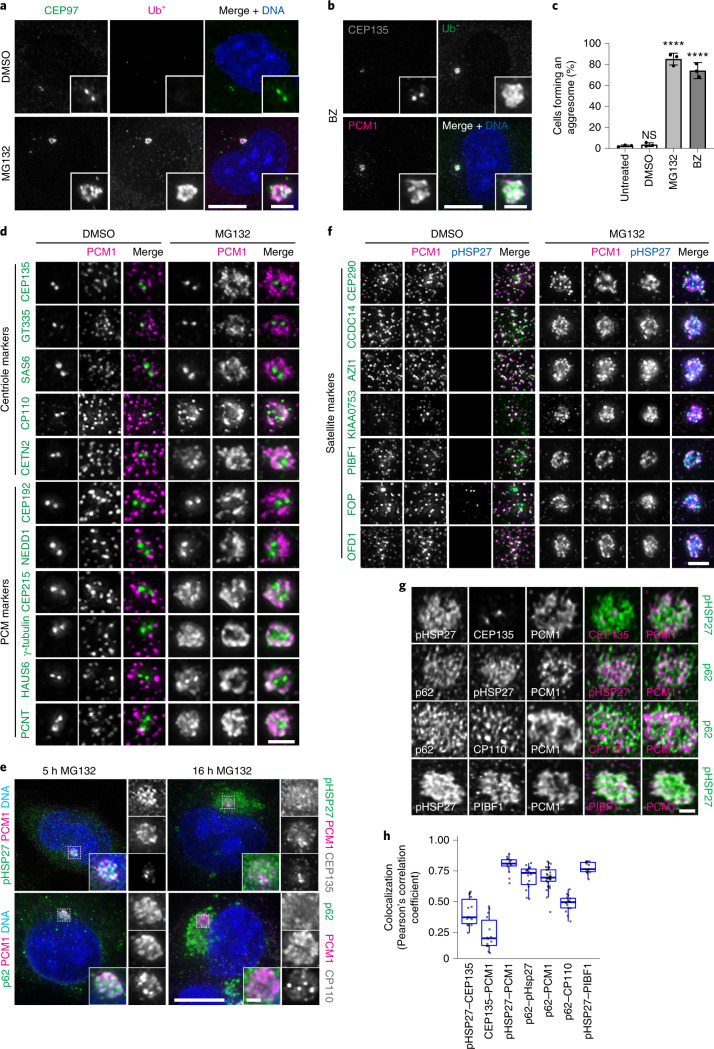
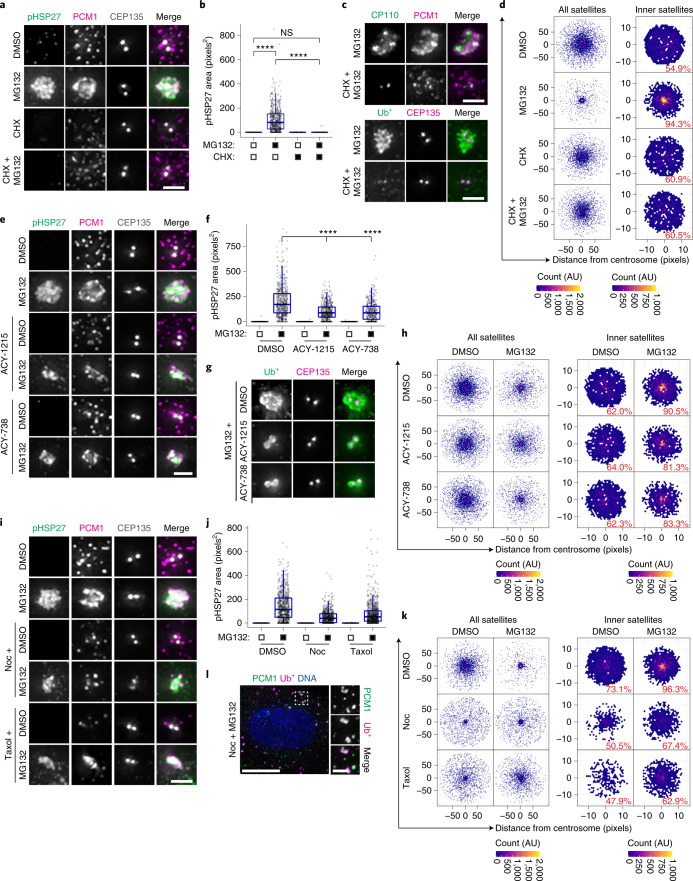
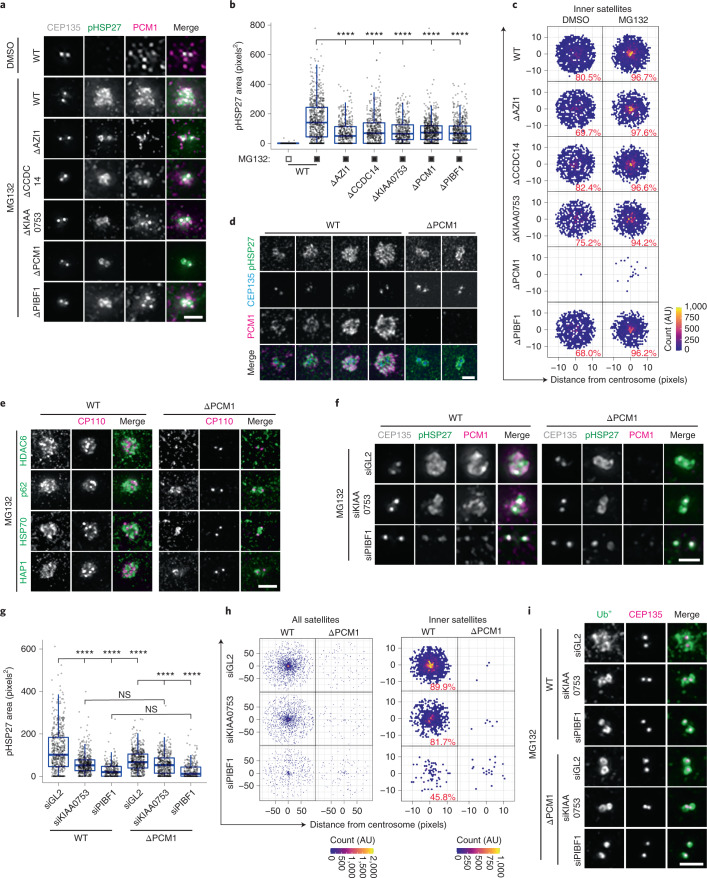
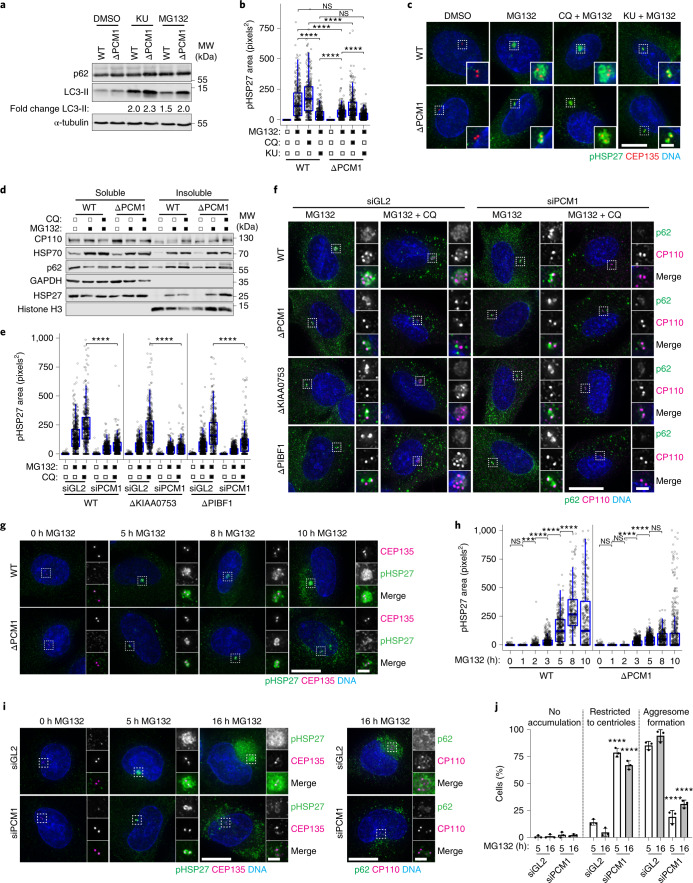
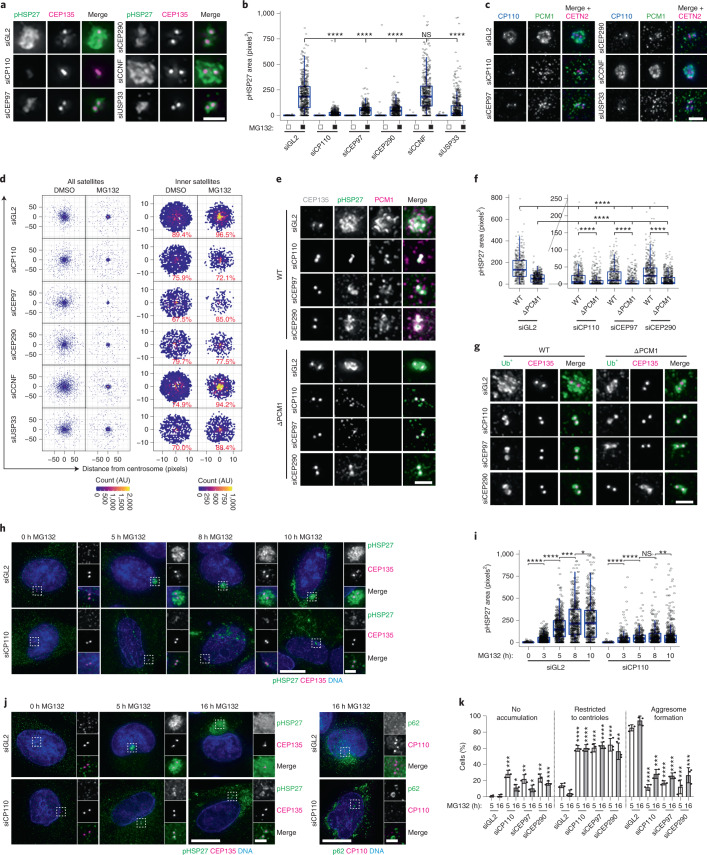
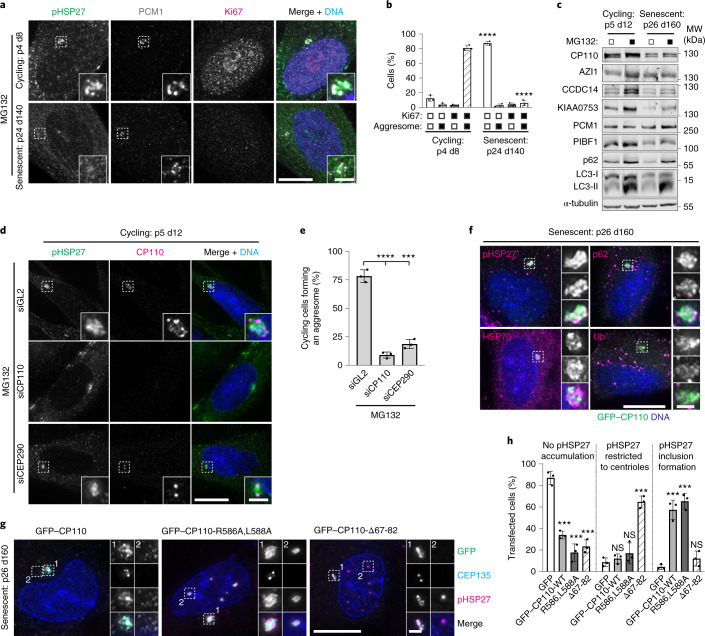
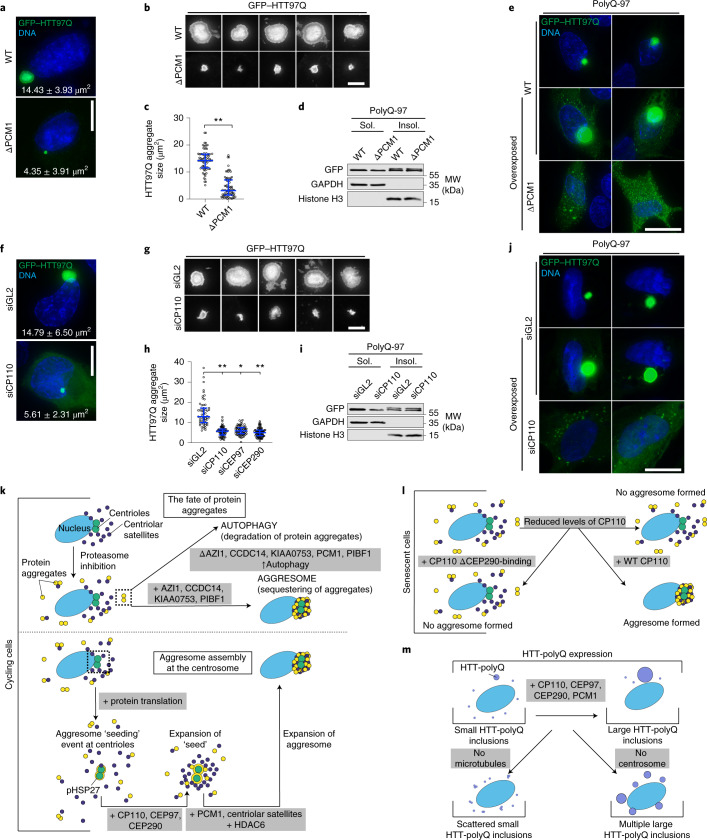
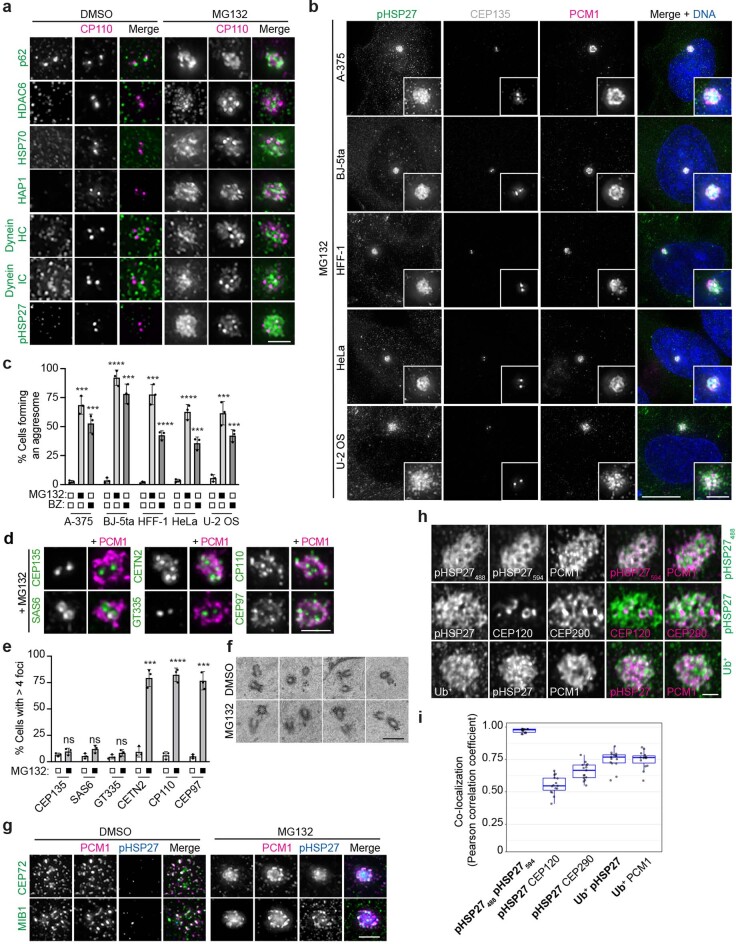
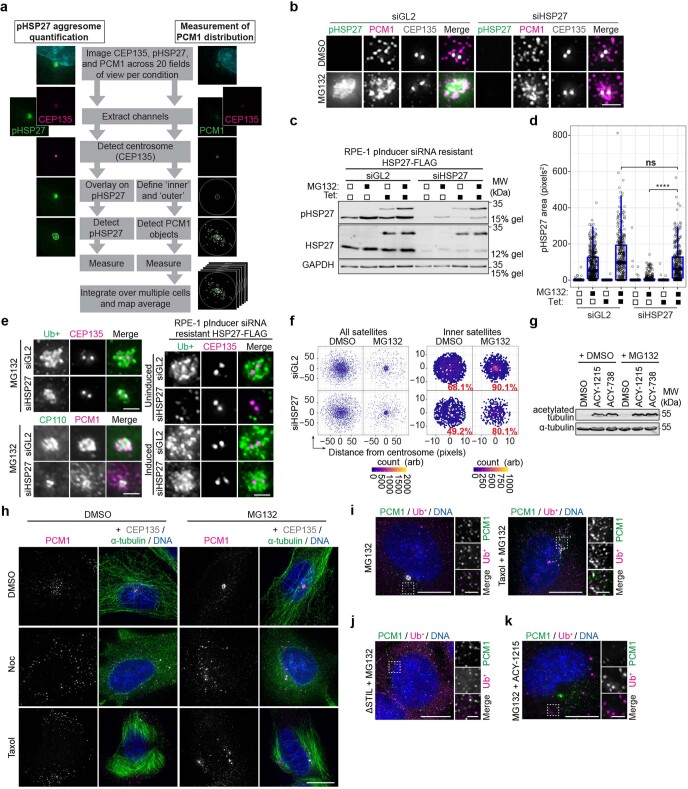
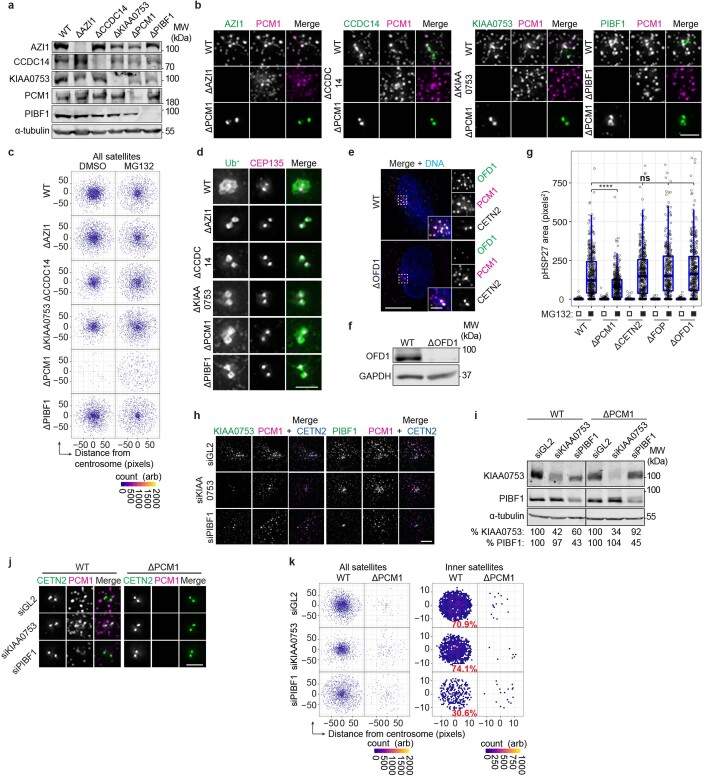
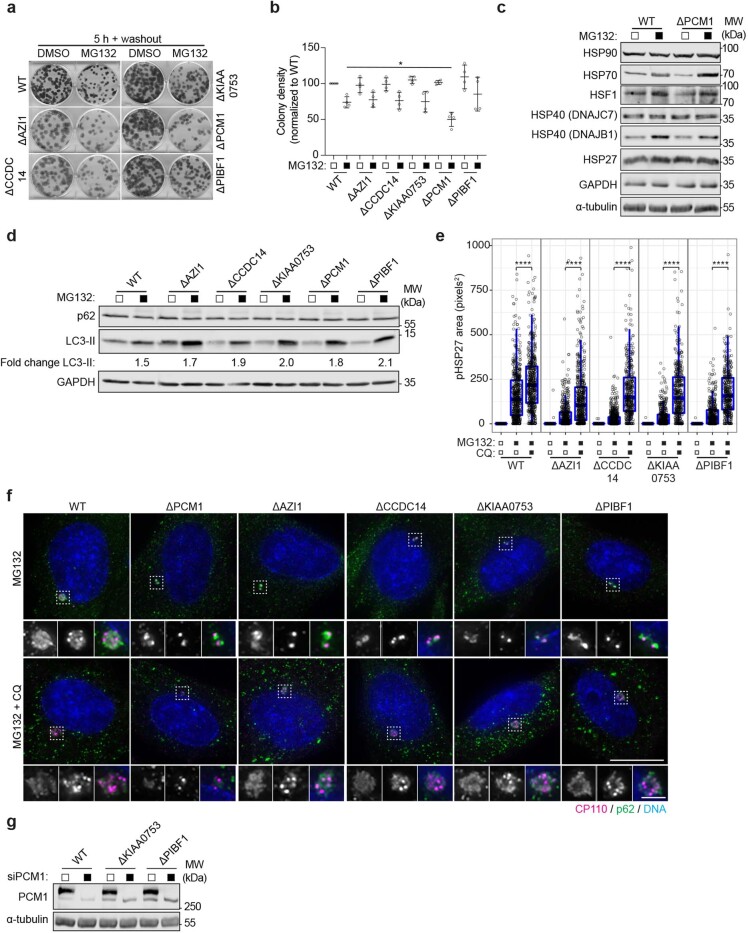
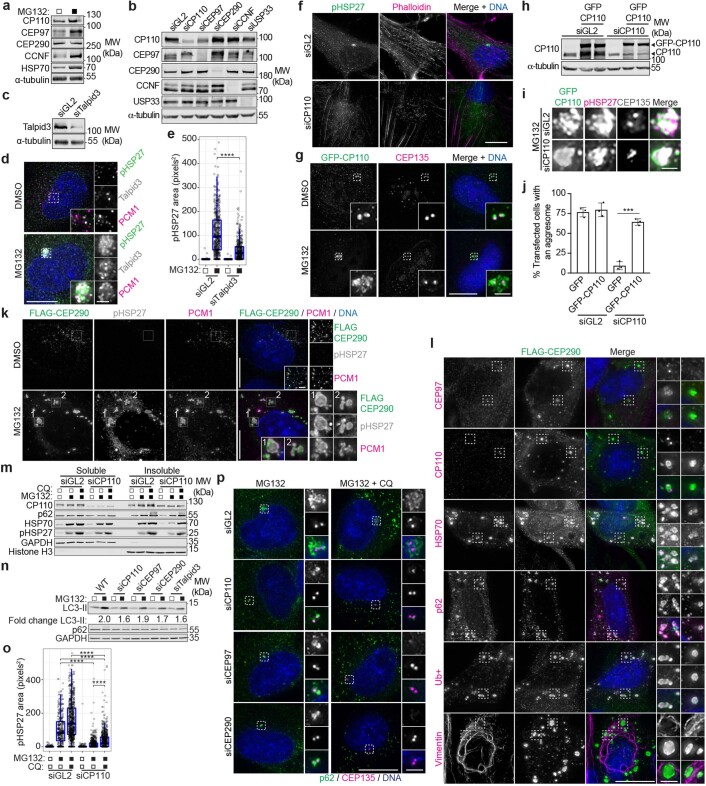
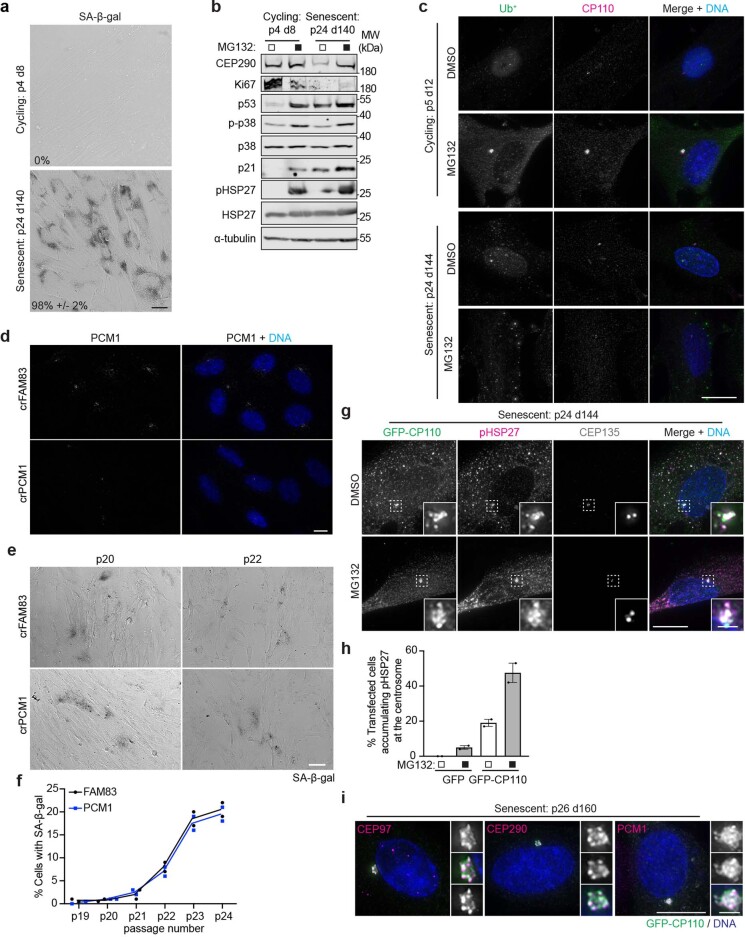
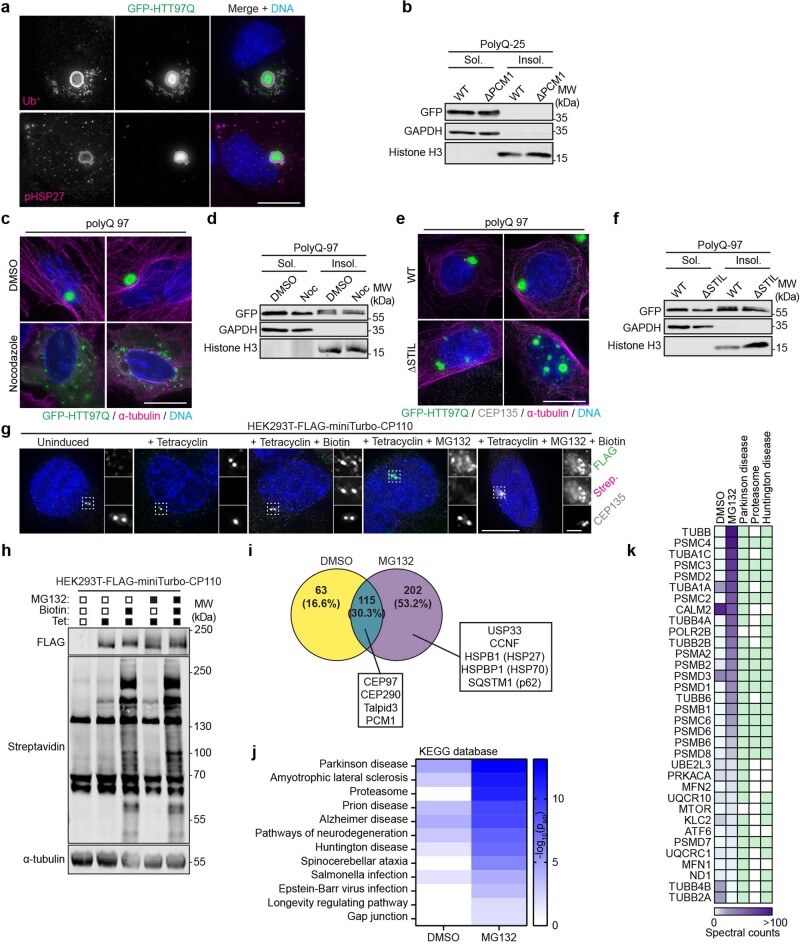
Protein degradation is critical to maintaining cellular homeostasis, and perturbation of the ubiquitin proteasome system leads to the accumulation of protein aggregates. These aggregates are either directed towards autophagy for destruction or sequestered into an inclusion, termed the aggresome, at the centrosome. Utilizing high-resolution quantitative analysis, here, we define aggresome assembly at the centrosome in human cells. Centriolar satellites are proteinaceous granules implicated in the trafficking of proteins to the centrosome. During aggresome assembly, satellites were required for the growth of the aggresomal structure from an initial ring of phosphorylated HSP27 deposited around the centrioles. The seeding of this phosphorylated HSP27 ring depended on the centrosomal proteins CP110, CEP97 and CEP290. Owing to limiting amounts of CP110, senescent cells, which are characterized by the accumulation of protein aggregates, were defective in aggresome formation. Furthermore, satellites and CP110-CEP97-CEP290 were required for the aggregation of mutant huntingtin. Together, these data reveal roles for CP110-CEP97-CEP290 and satellites in the control of cellular proteostasis and the aggregation of disease-relevant proteins.


Conflict of interest statement

The authors declare no competing interests.

Figures

Fig. 1
Fig. 1. Centrosome and centriolar satellite proteins localize to the aggresome after proteasome inhibition.
a, RPE-1 cells treated with DMSO or MG132 were stained for CEP97, ubiquitinated proteins (Ub+) and DNA (4,6-diamidino-2-phenylindole (DAPI)). b, RPE-1 cells treated with bortezomib (BZ) were stained for CEP135, Ub+, PCM1 and DNA (DAPI). c, The percentage of cells that formed an aggresome in untreated cells and in cells treated with DMSO, MG132 or BZ as revealed by Ub+ staining. Data displayed as the mean ± s.d., n = 3 independent experiments. ****P < 0.0001 or not significant (NS) by two-tailed unpaired Student’s t-test. d, RPE-1 cells treated with DMSO or MG132 were stained for PCM1 and the indicated protein. e, A-375 cells treated with MG132 for 5 or 16 h were stained as indicated. f, RPE-1 cells treated with DMSO or MG132 were stained for PCM1, pHSP27 and the indicated protein. g, Super-resolution images of aggresomes in MG132-treated RPE-1 cells stained as indicated. h, Colocalization between the indicated protein pairs from individual z-planes of super-resolution images of RPE-1 cells treated with MG132 displayed using Pearson’s correlation co-efficient. Boxes represent the median, upper and lower quartiles, whiskers represent 1.5× the interquartile range, with individual values from two independent experiments superimposed. Scale bars, 1 μm (g), 2 μm (d,f; insets of a,b,e) or 10 μm (a,b,e). Numerical data and P values are provided as source data. Source data
Fig. 2
Fig. 2. High-resolution quantitative analysis confirms the requirement for protein translation, HDAC6 and microtubules in aggresome formation.
a, RPE-1 cells treated with DMSO, MG132, cycloheximide (CHX), or CHX plus MG132 were stained as indicated. b, The area occupied by pHSP27 in cells treated as in a. n = 493 (DMSO), 630 (MG132), 459 (CHX) and 437 (CHX + MG132) aggresomes examined over 2 independent experiments. ****P < 0.0001. c, Cells treated with MG132 with or without pretreatment with CHX were stained as indicated. d, Intensity maps of PCM1 distribution relative to the centrosome in cells treated as in a. The percentage of PCM1 signal residing in the defined inner region is indicated. AU, arbitrary units. e, RPE-1 cells treated with DMSO or MG132 were treated concurrently with ACY-1215 or ACY-738 and stained as indicated. f, The area occupied by pHSP27 in cells treated as in e. n = 586 (DMSO), 566 (MG132), 470 (ACY-1215), 504 (ACY-1215 + MG132), 470 (ACY-738) and 395 (ACY-738 + MG132) aggresomes examined over 2 independent experiments. ****P < 0.0001. g, RPE-1 cells treated with MG132 with or without ACY-1215 or ACY-738 were stained as indicated. h, PCM1 distribution relative to the centrosome in cells treated as in e. i, RPE-1 cells were pretreated with nocodazole (Noc) or taxol followed by DMSO or MG132 and stained as indicated. j, The area occupied by pHSP27 in cells treated as in i. n = 554 (DMSO), 499 (MG132), 413 (Noc), 422 (Noc + MG132), 510 (taxol) and 485 (taxol + MG132) aggresomes examined over 2 independent experiments. ****P < 0.0001. k, PCM1 distribution relative to the centrosome in cells treated as in i. l, RPE-1 cells treated with MG132 and nocodazole were stained as indicated. For b, f and j, boxes represent the median, upper and lower quartiles, whiskers represent 1.5× the interquartile range, with individual values superimposed. Data were compared using Kruskal–Wallis analysis of variance (ANOVA) test, and post-hoc Dunn multiple comparison test was performed to calculate P values. Scale bars, 2 μm (a,c,e,g,i; inset of l) or 10 μm (l). Numerical data and P values are provided as source data. AU, arbitrary units. Source data
Fig. 3
Fig. 3. Centriolar satellites are required for aggresome formation.
a, WT cells and ΔAZI1, ΔCCDC14, ΔKIAA0753, ΔPCM1 and ΔPIBF1 RPE-1 cells were treated with MG132 and stained as indicated. b, The area occupied by pHSP27 in cells treated as in a. n = 518 (WT-DMSO), 705 (WT-MG132), 498 (ΔAZI1), 560 (ΔCCDC14), 468 (ΔKIAA0753), 682 (ΔPCM1) and 550 (ΔPIBF1) aggresomes examined over 2 independent experiments. ****P < 0.0001. c, Intensity maps of PCM1 distribution relative to the centrosome in cells treated as treated in a. The percentage PCM1 signal residing in the defined inner region is indicated. d, Super-resolution images of pHSP27, CEP135 and PCM1 staining in WT and ΔPCM1 cells treated with MG132. e, WT and ΔPCM1 cells treated with MG132 were stained for CP110 and the indicated protein. f, WT and ΔPCM1 cells were treated with control (GL2), KIAA0753 or PIBF1 siRNAs (siGL2, siKIAA0753 and siPIBF1, respectively) as indicated for 48 h, then treated with MG132. Cells were stained for CEP135, pHSP27 and PCM1. g, The area occupied by pHSP27 in cells treated as in f. n = 511 (WT-siGL2), 493 (WT-siKIAA0753), 324 (WT-siPIBF1), 519 (ΔPCM1-siGL2), 452 (ΔPCM1-siKIAA0753) and 291 (ΔPCM1-siPIBF1) aggresomes examined over 2 independent experiments. ****P < 0.0001. h, Intensity maps of PCM1 distribution relative to the centrosome in cells treated as in f. The percentage PCM1 signal residing in the defined ‘inner’ region is indicated. i, Ub+ and CEP135 staining in WT and PCM1 KO cells treated as in f. For b and g, boxes represent the median, upper and lower quartiles, whiskers represent 1.5× the interquartile range, with individual values superimposed. Data were compared using Kruskal–Wallis ANOVA test, and post-hoc Dunn multiple comparison test was performed to calculate P values. Scale bars, 1 μm (d) or 2 μm (a,e,f,i). Numerical data and P values are provided as source data. AU, arbitrary units. Source data
Fig. 4
Fig. 4. Centriolar satellites direct protein aggregates to the aggresome in the absence of autophagy.
a, WT and ΔPCM1 cells treated and probed as indicated. KU, KU-0063794. b, pHSP27 area in WT and ΔPCM1 cells treated as indicated. n = 360 (WT-DMSO), 368 (WT-MG132), 323 (WT-MG132 + CQ), 386 (WT-MG132 + KU), 360 (ΔPCM1-DMSO), 375 (ΔPCM1-MG132), 366 (ΔPCM1-MG132 + CQ) and 418 (ΔPCM1-MG132 + KU) aggresomes examined over 2 independent experiments. ****P < 0.0001. c, Cells treated as in b were stained as indicated. d, Fractions from WT and ΔPCM1 cells treated and probed as indicated. e, pHSP27 area in siRNA-transfected WT, ΔKIAA0753 and ΔPIBF1 cells treated as indicated. Number of aggresomes examined over 2 experiments: WT: n = 522 (siGL2-DMSO), 525 (siGL2-MG132), 433 (siGL2-MG132 + CQ), 466 (siPCM1-DMSO), 422 (siPCM1-MG132) and 460 (siPCM1-MG132 + CQ); ΔKIAA0753: n = 509 (siGL2-DMSO), 563 (siGL2-MG132), 503 (siGL2-MG132 + CQ), 474 (siPCM1-DMSO), 442 (siPCM1-MG132) and 380 (siPCM1-MG132 + CQ); ΔPIBF1: n = 680 (siGL2-DMSO), 608 (siGL2-MG132), 478 (siGL2-MG132/CQ), 497 (siPCM1-DMSO), 531 (siPCM1-MG132) and 427 (siPCM1-MG132/CQ). ****P < 0.0001. f, siRNA-transfected WT cells and ΔPCM1, ΔKIAA0753 and ΔPIBF1 cells were treated and stained as indicated. g, WT and ΔPCM1 cells were treated and stained as indicated. h, pHSP27 area in WT and ΔPCMI cells treated as indicated. Number of aggresomes examined over 2 independent experiments: WT: n = 423 (0 h), 387 (1 h), 428 (2 h), 470 (3 h), 470 (4 h), 497 (5 h), 392 (8 h) and 287 (10 h); ΔPCM1: n = 524 (0 h), 581 (1 h), 580 (2 h), 598 (3 h), 640 (4 h), 635 (5 h), 593 (8 h) and 394 (10 h). ****P < 0.0001, **P < 0.01. i, siRNA-transfected A-375 cells were treated and stained as indicated. j, Quantitation of aggresome formation in A-375 cells transfected with control or PCM1 siRNAs, then treated with MG132 as indicated. Data displayed as the mean ± s.d., n = 3 independent experiments. ****P < 0.0001 by two-tailed unpaired Student’s t-test. For b, e and h, boxes represent the median, upper and lower quartiles, whiskers represent 1.5× the interquartile range, with individual values superimposed. Data compared using Kruskal–Wallis ANOVA test and post-hoc Dunn multiple comparison test. Scale bars, 10 μm (c,f,g,i) or 2 μm (insets of c,f,g,i). Unprocessed immunoblots, numerical data and P values are provided as source data. Source data
Fig. 5
Fig. 5. A CP110–CEP97–CEP290 module is required for aggresome formation.
a, siRNA-transfected cells were treated and stained as indicated. b, Quantitation of pHSP27 area in cells treated as in a. n = DMSO: 705 (siGL2), 376 (siCP110), 372 (siCEP97), 691 (siCEP290), 579 (siCCNF), 472 (siUSP33); MG132: 517 (siGL2), 455 (siCP110), 396 (siCEP97), 449 (siCEP290), 475 (siCCNF) and 555 (siUSP33) aggresomes examined over 2 independent experiments. ****P < 0.0001. c, Cells treated as in a were stained as indicated. d, PCM1 distribution relative to the centrosome in cells treated as in a. The percentage of PCM1 in the inner region is indicated. e, siRNA-transfected WT and ΔPCM1 cells were treated and stained as indicated. f, pHSP27 area in cells treated as in e, with data from the same experiment displayed with different y axis ranges to ease comparison between knockdowns. Number of aggresomes examined over 2 independent experiments: WT: n = 408 (siGL2), 491 (siCP110), 518 (siCEP97) and 578 (siCEP290); ΔPCM1: n = 518 (siGL2), 510 (siCP110), 494 (siCEP97) and 699 (siCEP290). ****P < 0.0001. g, Cells treated as in e were stained as indicated. h, siRNA-transfected cells were treated and stained as indicated. i, pHSP27 area in siRNA-transfected WT cells treated with MG132. Number of aggresomes examined over 2 independent experiments: siGL2: n = 524 (0 h), 664 (3 h), 533 (5 h), 510 (8 h) and 519 (10 h); siCP110: n = 413 (0 h), 229 (3 h), 312 (5 h), 430 (8 h) and 550 (10 h). ****P < 0.0001, **P < 0.01, *P < 0.05. j, A-375 cells transfected with siGL2 or siCP110 were treated and stained as indicated. k, Aggresome formation in A-375 cells transfected and treated as indicated. Data displayed as the mean ± s.d., n = 3 independent experiments. ****P < 0.0001, **P < 0.01, *P < 0.05 by two-tailed unpaired Student’s t-test. For b, f and i, boxes represent the median, upper and lower quartiles, whiskers represent 1.5× the interquartile range, with individual values superimposed. Data were compared using Kruskal–Wallis ANOVA test and post-hoc Dunn multiple comparison test. Scale bars, 2 μm (a,c,e,g; insets of h,j) or 10 μm (h,j). Numerical data and P values are provided as source data. AU, arbitrary units. Source data
Fig. 6
Fig. 6. Senescent cells have a reduced capacity to form aggresomes.
a, Cycling and senescent HFF-1 cells were treated with MG132 and stained as indicated. The number of passages (p) and total number of days in culture (d) are indicated. b, Quantitation of aggresome formation in Ki67 positive/negative cycling and senescent HFF-1 cells. c, Extracts from cycling and senescent HFF-1 cells treated with or without MG132 were probed as indicated. α-tubulin was used as the loading control. d, Cycling HFF-1 cells were treated with control (GL2), CP110 or CEP290 siRNAs, treated with MG132 and stained as indicated. e, Quantitation of aggresome formation in cycling HFF-1 cells treated as in d. f, Senescent HFF-1 cells were transfected with GFP–CP110 and treated with MG132. Cells were stained as indicated. g, Senescent HFF-1 cells were transfected with GFP–CP110, GFP–CP110-R586A,L588A or GFP–CP110-Δ67-82 and treated with MG132. Cells were stained for pHSP27. h, Quantification of senescent HFF-1 cells treated as in g that formed an aggresome. For b, e and h, data are displayed as the mean ± s.d., n = 3 independent experiments, and P values were calculated by two-tailed unpaired Student’s t-test; ****P 0.0001, ***P 0.001. Scale bars, 2 μm (insets of a,d,f,g) or 10 μm (a,d,f,g). Unprocessed immunoblots, numerical data and P values are provided as source data. Source data
Fig. 7
Fig. 7. HTT-polyQ inclusion formation requires centriolar satellites and the CP110–CEP97–CEP290 module.
a, Images of WT and ΔPCM1 cells transfected with GFP–HTT97Q for 24 h. Mean aggregate size ± s.d. is indicated. b, Example GFP–HTT97Q aggregates in WT and ΔPCM1 cells. c, GFP–HTT97Q aggregate size in WT and ΔPCM1 cells. n = 75 cells for each condition over 2 independent experiments. ****P < 0.0001. d, Immunoblot of soluble (Sol.) and insoluble (Insol.) fractions from WT and ΔPCM1 cells transfected with GFP–HTT97Q. e, GFP–HTT97Q transfected WT and ΔPCM1 cells were imaged with overexposed conditions. f, Cells treated with siRNA then transfected with GFP–HTT97Q. Mean aggregate size ± s.d. is indicated. g, GFP–HTT97Q aggregates in cells treated with siGL2 or siCP110. h, GFP–HTT97Q aggregate size in WT cells treated with the indicated siRNAs. n = 57 (siGL2), 62 (siCP110), 68 (siCEP97) and 85 (siCEP290) over 2 independent experiments. ****P < 0.0001. i, Immunoblot of fractions from WT cells treated with siGL2 or siCP110, then transfected with GFP–HTT97Q. j, GFP–HTT97Q transfected siGL2 or siCP110 cells were imaged with overexposed conditions. k, Proteasome inhibition causes protein aggregates to accumulate in the cytoplasm. These aggregates are either directed towards autophagy or sequestered to the aggresome. Without satellites, autophagy is upregulated and becomes the predominant pathway. The earliest event in aggresome formation at the centrosome is the accumulation of pHSP27 on the centrioles and the recruitment of proteins to the aggresome. pHSP27 expansion requires CP110, CEP97 and CEP290, satellites and HDAC6. l, Senescent cells have a limited capacity to form aggresomes due to reduced levels of CP110. m, Assembly of GFP–HTT97Q aggregates into single inclusions requires the CP110 module, satellites, microtubules and a functional centrosome. For c and h, bars represent median and interquartile range, with individual values superimposed. P values were calculated by two-tailed unpaired Student’s t-test. Scale bars, 2 μm (insets of b,g) or 10 μm (a,e,f,j). Unprocessed immunoblots, numerical data and P values are provided as source data. Source data
Extended Data Fig. 1
Extended Data Fig. 1. Centrosomal proteins localize to the aggresome upon proteasome inhibition.
(a) RPE-1 cells treated with DMSO or MG132 were stained for CP110 and the indicated protein. Scale bar 2 μm. (b) The indicated cell lines were treated with MG132 and stained for pHSP27, CEP135 and PCM1. DNA was stained with DAPI. Scale bar 10 μm, inset 2 μm. (c) Quantification of the percentage cells forming an aggresome upon DMSO, MG132 and BZ treatment, as indicated. Data displayed as mean ± s.d., n = 3 independent experiments. ****p < 0.0001; ***p < 0.001. (d) RPE-1 cells treated with MG132 were stained for PCM1 and the indicated protein. Scale bar 2 μm. (e) Histogram showing the percentage of cells with greater than 4 foci of CEP135, SAS6, GT335, CETN2, CP110 and CEP97 following MG132 treatment. Data displayed as mean ± s.d., n = 3 independent experiments. ****p < 0.0001; ***p < 0.001; ns, not significant. p values: 0.218071 (CEP135), 0.058423 (SAS6), 0.160943 (GT335), 0.000219 (CETN2), 0.000055 (CP110), and 0.000150 (CEP97). (f) TEM images of centrioles from RPE-1 cells treated with DMSO or MG132. Scale bar 500 nm. (g) RPE-1 cells treated with DMSO or MG132 for 5 hours were stained for PCM1, pHSP27 and the indicated protein. Scale bar 2 μm. (h) Super resolution images of aggresomes in MG132 treated RPE-1 cells stained as indicated. Scale bar 1 μm. (i) Co-localization between the indicated protein pairs from individual z-planes of super resolution images of RPE-1 cells treated with MG132 displayed using Pearson correlation co-efficient. Boxes represent the median, upper and lower quartiles, whiskers represent 1.5x the interquartile range, with individual values from two independent experiments superimposed. For c,e: p determined by two-tailed unpaired Student’s t-test. Numerical data and p values are provided as source data. Source data
Extended Data Fig. 2
Extended Data Fig. 2. High-resolution quantitative analysis confirms a requirement for protein translation, HDAC6 and microtubules in aggresome formation.
(a) Schematic representation of the automated aggresome quantification and satellite mapping pipeline utilized in this study (see Methods). (b) RPE-1 cells were transfected with iRNAs and treated and stained as indicated. Scale bar 2 μm. (c) Immunoblots of extracts from MG132 treated RPE-1 cells expressing an inducible siRNA resistant HSP27-FLAG construct following treatment with control (GL2) or HSP27 siRNAs. Blots were probed as indicated. (d) Box-and-whisker plot showing the area occupied by pHSP27 in RPE-1 pInducer siRNA resistant HSP27-FLAG cells treated as indicated. Boxes represent the median, upper and lower quartiles, whiskers represent 1.5x the interquartile range, with individual values superimposed. n = siGL2: 482 (un-induced DMSO), 449 (un-induced MG132), 358 (induced DMSO), 386 (induced MG132); siHSP27 437 (un-induced DMSO), 360 (un-induced MG132), 399 (induced DMSO) and 333 (induced MG132) aggresomes examined over 2 independent experiments. Data were compared using a Kruskal-Wallis ANOVA test and a post-hoc Dunn multiple comparison test performed to calculate p-values. ****p < 0.0001. (e) Cells transfected with siRNAs were treated and stained as indicated. Scale bar 2 μm. (f) Intensity maps of PCM1 distribution relative to the centrosome in cells treated as indicated. The percentage PCM1 signal residing in the ‘inner’ region is indicated. Arb, arbitrary units. (g) Immunoblot of extracts from cells treated and probed as indicated. (h) RPE-1 cells were treated and stained as indicated. Scale bar 10 μm, inset 2 μm. (i) RPE-1 cells treated with MG132 and taxol were stained as indicated. Scale bar 10 μm, inset 2 μm. (j) STIL KO cells were treated with MG132 then stained for PCM1 and Ub+. Scale bar 10 μm, inset 2 μm. (k) RPE-1 cells treated with MG132 and the HDAC6 inhibitor ACY-1215 were stained as indicated. Scale bar 10 μm, inset 2 μm. Unprocessed immunoblots, numerical data and p values are provided as source data. Source data
Extended Data Fig. 3
Extended Data Fig. 3. Centriolar satellites are required for aggresome formation.
(a) CRISPR/Cas9 mediated gene disruption was used to generate AZI1, CCDC14, KIAA0753, PCM1 and PIBF1 knockout (KO) RPE-1 cell lines. Extracts from WT and KO cells were probed as indicated. (b) Loss of protein in AZI1, CCDC14, KIAA0753, PCM1 and PIBF1 KO cells was also confirmed by IF microscopy. Scale bar 2 μm. (c) Intensity maps of PCM1 distribution relative to the centrosome in WT and KO cells treated as indicated for 5 hours. Arb, arbitrary units. (d) Ub+ and CEP135 staining in WT and satellite protein KO cells treated with MG132. Scale bar 2 μm. (e) WT and OFD1 KO cells were stained for OFD1, PCM1 and CETN2. Scale bar 10 μm, inset 2 μm. (f) Immunoblot of extracts from WT and OFD1 KO cells probed as indicated. (g) Box-and-whisker plot showing the area occupied by pHSP27 in the indicated cell lines treated with MG132. Boxes represent the median, upper and lower quartiles, whiskers represent 1.5x the interquartile range, with individual values superimposed. n = WT: 400 (DMSO), 414 (MG132); ΔCETN2: 411 (DMSO), 434 (MG132); ΔFOP: 456 (DMSO), 352 (MG132); ΔOFD1: 422 (DMSO), 377 (MG132); ΔPCM1: 519 (DMSO) and 429 (MG132) aggresomes examined over 2 independent experiments. Data were compared using a Kruskal-Wallis ANOVA test and a post-hoc Dunn multiple comparison test performed to calculate p-values. ****p < 0.0001; n.s. not significant. (h) WT cells were transfected with siRNAs and stained as indicated. Scale bar 2 μm. (i) Immunoblot of extracts from WT and PCM1 KO cell lines transfected with siRNAs. All samples were run on the same gels; however, an intervening lane between the WT and PCM1 KO cell lines was excised, thereby placing non-adjacent lanes next to each other in the panel. Numbers at the bottom indicate the mean band intensity expressed as a percentage of signal of the corresponding control for the indicated proteins. (j) WT and PCM1 KO cells treated with control, KIAA0753 or PIBF1 siRNAs were stained as indicated. Scale bar 2 μm. (k) Intensity maps of PCM1 distribution relative to the centrosome in WT and PCM1 KO cells treated and stained as in j. Arb, arbitrary units. Unprocessed immunoblots, numerical data and p values are provided as source data. Source data
Extended Data Fig. 4
Extended Data Fig. 4. Centriolar satellites direct protein aggregates to the aggresome in the absence of autophagy.
(a) WT, AZI1, CCDC14, KIAA0753, PCM1 and PIBF1 KO cells were seeded for clonogenic assays and treated with MG132 for 5 hours. The drug was then extensively washed out and the cells left to grow for 12 days. (b) Colony density was quantified and growth normalized to WT. Mean ± s.d. is shown, n = 4 from two independent experiments. *p < 0.05 by two-tailed unpaired Student’s t-test. (c) Immunoblots of extracts from WT and PCM1 KO cells treated with DMSO or MG132 probed as indicated. α-tubulin was used as a loading control. (d) Immunoblots of extracts from WT, AZI1, CCDC14, KIAA0753, PCM1 and PIBF1 KO cells treated with DMSO or MG132 and probed as indicated. The fold change in the amount of LC3-II present in MG132 treated cells as compared to the DMSO treated counterpart is indicated. GAPDH was used as a loading control. (e) Box-and-whisker plot showing the area occupied by pHSP27 in WT, AZI1, CCDC14, KIAA0753 and PIBF1 KO cells treated with DMSO, MG132 or MG132 plus chloroquine (CQ). Boxes represent the median, upper and lower quartiles, whiskers represent 1.5x the interquartile range, with individual values superimposed. n = WT: 470 (DMSO), 529 (MG132), 513 (MG132/CQ); ΔAZI1: 484 (DMSO), 458 (MG132), 524 (MG132/CQ); ΔCCDC14: 387 (DMSO), 739 (MG132), 404 (MG132/CQ); ΔKIAA0753: 381 (DMSO), 426 (MG132), 411 (MG132/CQ); ΔPIBF1: 470 (DMSO), 529 (MG132) and 513 (MG132/CQ) aggresomes examined over 2 independent experiments. Data were compared using a Kruskal-Wallis ANOVA test and a post-hoc Dunn multiple comparison test performed to calculate p-values. ****p < 0.0001. (f) WT, PCM1, AZI1, CCDC14, KIAA0753 and PIBF1 cells were treated with MG132 or MG132 plus CQ and stained for CP110 and p62. Scale bar 10 μm, 2 μm. (g) Immunoblot of extracts from WT, KIAA0753 and PIBF1 KO cells transfected with siRNAs against PCM1. α-tubulin was used as a loading control. Unprocessed immunoblots, numerical data and p values are provided as source data. Source data
Extended Data Fig. 5
Extended Data Fig. 5. A CP110-CEP97-CEP290 module is required for aggresome formation.
(a) MG132 treated extracts were probed as indicated. (b) Extracts from siRNA transfected cells were probed as indicated. (c) Extracts from control or Talpid3 siRNAs treated cells were probed as indicated. (d) Cells treated with DMSO or MG132 were stained as indicated. Scale bar 10 μm, inset 2 μm. (e) Plot of pHSP27 area in cells transfected with siRNAs and treated with MG132. Boxes represent the median, upper and lower quartiles, whiskers represent 1.5x the interquartile range, with individual values superimposed. n = siGL2: 459 (DMSO), 463 (MG132); siTalpid3: 372 (DMSO) and 388 (MG132) aggresomes examined over 2 independent experiments. Data were compared using a Kruskal-Wallis ANOVA test and a post-hoc Dunn multiple comparison test performed to calculate p-values. ****p < 0.0001. (f) RPE-1 cells were treated and stained as indicated. Scale bar 10 μm. (g) RPE-1 cells transfected with GFP-CP110 were treated and stained as indicated. Scale bar 10 μm, inset 2 μm. (h) Extracts from RPE-1 cells treated with CP110 siRNAs and transiently transfected with RNAi-resistant GFP-CP110 were probed as indicated. (i) Cells transfected as in h were treated with MG132 and stained as indicated. Scale bar 2 μm. (j) Percentage cells treated as in i that formed an aggresome. Data displayed as mean ± s.d., n = 3 independent experiments. ****p < 0.0001 by two-tailed unpaired Student’s t-test. (k, l) Cells transfected with FLAG-CEP290 were treated and stained as indicated. Scale bars 10 μm, inset 2 μm. (m) Fractions from cells transfected with siRNAs and treated as indicated (CQ, chloroquine). (n) Extracts from cells transfected with siRNAs were treated and probed as indicated. The fold change in LC3-II levels in MG132 treated cells is shown as compared to their control treated counterparts. (o) Plot showing pHSP27 area in WT cells transfected siRNAs and treated with MG132 or MG132 and CQ. Boxes represent the median, upper and lower quartiles, whiskers represent 1.5x the interquartile range, with individual values superimposed. n = siGL2: 766 (DMSO), 719 (MG132), 741 (MG132/CQ); siCP110: 810 (DMSO), 577 (MG132) and 659 (MG132/CQ) aggresomes examined across 2 independent experiments. Data were compared using a Kruskal-Wallis ANOVA test and a post-hoc Dunn multiple comparison test performed to calculate p-values. ****p < 0.0001. (p) siRNA transfected cells were treated with MG132 or MG132 plus CQ and stained as indicated. Scale bar 10 μm, inset 2 μm. Unprocessed immunoblots, numerical data and p values are provided as source data. Source data
Extended Data Fig. 6
Extended Data Fig. 6. Senescent cells have a reduced capacity to form aggresomes.
(a) Bright-field image of cycling and senescent HFF-1 cells that were subjected to a senescence associated β-galactosidase (SA-β-gal) assay. The percentage of cells displaying SA-β-gal activity is indicated. Scale bar 10 μm. (b) Extracts from cycling and senescent HFF-1 cells treated with or without MG132 were probed for CP110, CEP290, Ki67, p53, phospho-p38, p38, p21, pHSP27 and total HSP27, as indicated. α-tubulin was used as a loading control. (c) Cycling and senescent HFF-1 cells were treated with DMSO or MG132, then stained for Ub+ and CP110. DNA was stained with DAPI. Scale bar 10 μm. (d) crFAM83 and crPCM1 IMR-90 cells were stained for PCM1. Scale bar 10 μm. (e) Bright-field image of crFAM83G and crPCM1 IMR-90 cells that were subjected to a senescence associated β-galactosidase (SA-β-gal) assay. Scale bar 20 μm (f) Quantification of the percentage of senescent cells as determined by SA-β-gal activity in crFAM83 and crPCM1 IMR-90 cells, n = 2 biological replicates. (g) Senescent HFF-1 cells were transfected with GFP-CP110 for 48 hours before treatment with MG132. Cells were stained as indicated. Scale bar 10 μm, inset 2 μm. (h) Histogram of the percentage of senescent HFF-1 cells transfected with GFP or GFP-CP110 that formed an aggresome. Data displayed as mean and range. n = 2 independent experiments. (i) Senescent HFF-1 cells were transfected with GFP-CP110, treated with MG132 and stained for CEP97, CEP290 and PCM1. Scale bar 10 μm, inset 2 μm. Unprocessed immunoblots and numerical data are provided as source data. Source data
Extended Data Fig. 7
Extended Data Fig. 7. HTT-polyQ inclusion formation requires microtubules and a functional centrosome.
(a) RPE-1 cells were transiently transfected with GFP-HTT97Q and stained for pHSP27 or Ub+. DNA was stained with DAPI. Scale bar 10 μm. (b) Immunoblot of soluble and insoluble fractions from WT and PCM1 KO cells transfected with GFP-HTT25Q. GAPDH and Histone H3 were used controls for the soluble and insoluble fractions, respectively. (c) Cells were transfected with GFP-HTT97Q for 5 hours, then treated with DMSO or nocodazole for 5 hours before being fixed and stained for GFP and α-tubulin. Scale bar 10 μm. (d) Immunoblot of soluble and insoluble fractions from cells prepared as in c. GAPDH and Histone H3 were used controls for the soluble and insoluble fractions, respectively. (e) WT and STIL KO U-2 OS cells were transiently transfected with GFP-HTT97Q then stained for GFP, CEP135 and α-tubulin. Scale bar 10 μm. (f) Immunoblot of soluble and insoluble fractions from cells prepared as in e. GAPDH and Histone H3 were used controls for the soluble and insoluble fractions, respectively. (g) HEK293T-FLAG-miniTurbo-CP110 cells were treated and stained as indicated. Scale bar 10 μm, 2 μm. (h) Immunoblot of HEK293T-FLAG-miniTurbo-CP110 cells treated and probed as indicated. α-tubulin was used as a loading control. (i) The number of preys from DMSO- or MG132-treated groups. Preys were defined as detailed in the Methods. (j) Functional enrichment analysis was performed with the preys from i. using g:Profiler and the KEGG database. (k) Spectral counts from the genes which are implicated in Parkinson’s disease, proteasome function or Huntington’s disease are shown. Genes which are related to the respective pathways are marked in green. Unprocessed immunoblots are provided as source data. For i,j,k: the raw mass spectrometry data and analysis giving rise to these panels is available in Supplementary Table 2. Source data

Comment in

References

    1. Joukov V, De Nicolo A. The centrosome and the primary cilium: the yin and yang of a hybrid organelle. Cells. 2019;8:701. doi: 10.3390/cells8070701. - DOI - PMC - PubMed
    1. Johnston JA, Ward CL, Kopito RR. Aggresomes: a cellular response to misfolded proteins. J. Cell Biol. 1998;143:1883–1898. doi: 10.1083/jcb.143.7.1883. - DOI - PMC - PubMed
    1. Johnston HE, Samant RS. Alternative systems for misfolded protein clearance: life beyond the proteasome. FEBS J. 2021;288:4464–4487. doi: 10.1111/febs.15617. - DOI - PubMed
    1. Fortun J, Dunn WA, Joy S, Li J, Notterpek L. Emerging role for autophagy in the removal of aggresomes in Schwann cells. J. Neurosci. 2003;23:10672–10680. doi: 10.1523/JNEUROSCI.23-33-10672.2003. - DOI - PMC - PubMed
    1. Hao R, et al. Proteasomes activate aggresome disassembly and clearance by producing unanchored ubiquitin chains. Mol. Cell. 2013;51:819–828. doi: 10.1016/j.molcel.2013.08.016. - DOI - PMC - PubMed

Publication types

MeSH terms

Grants and funding