. 2022 Jul;198(1):155-164.
doi: 10.1111/bjh.18164. Epub 2022 Apr 12.

Measurement of erythrocyte membrane mannoses to assess splenic function

Affiliations

Measurement of erythrocyte membrane mannoses to assess splenic function

Huan Cao et al. Br J Haematol. 2022 Jul.

Abstract

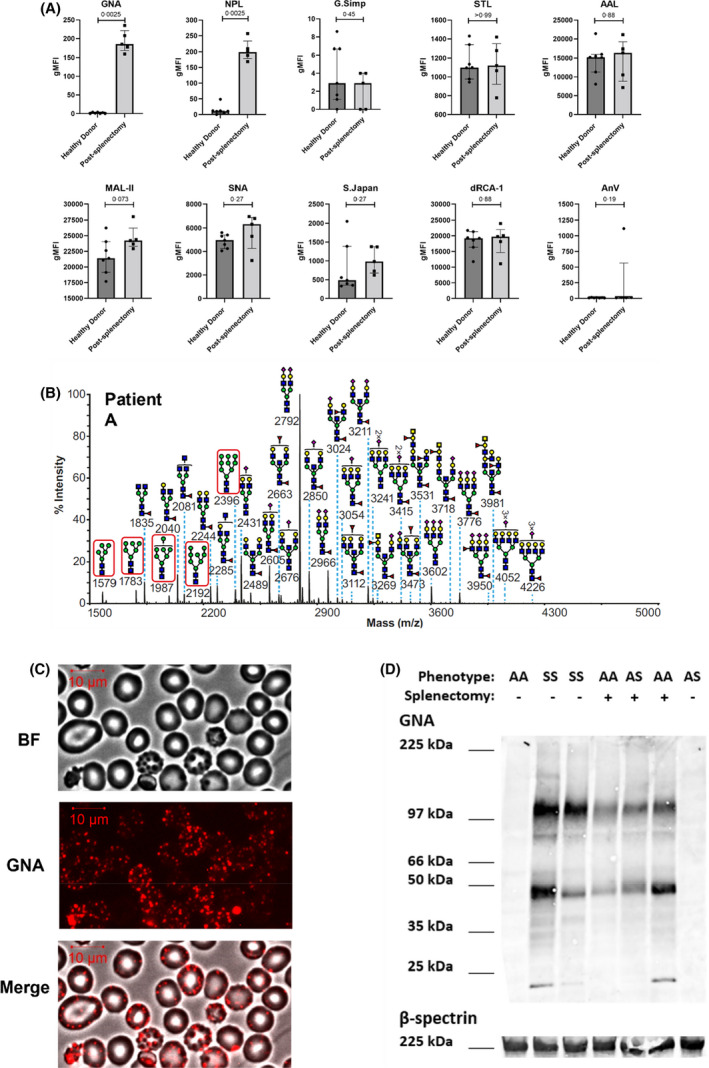
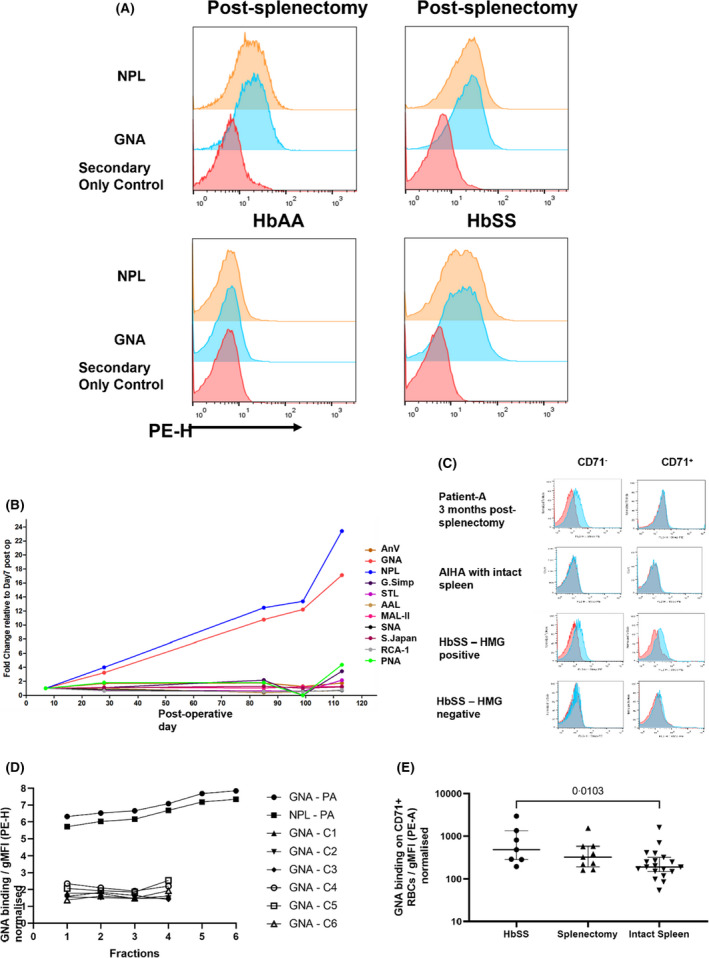
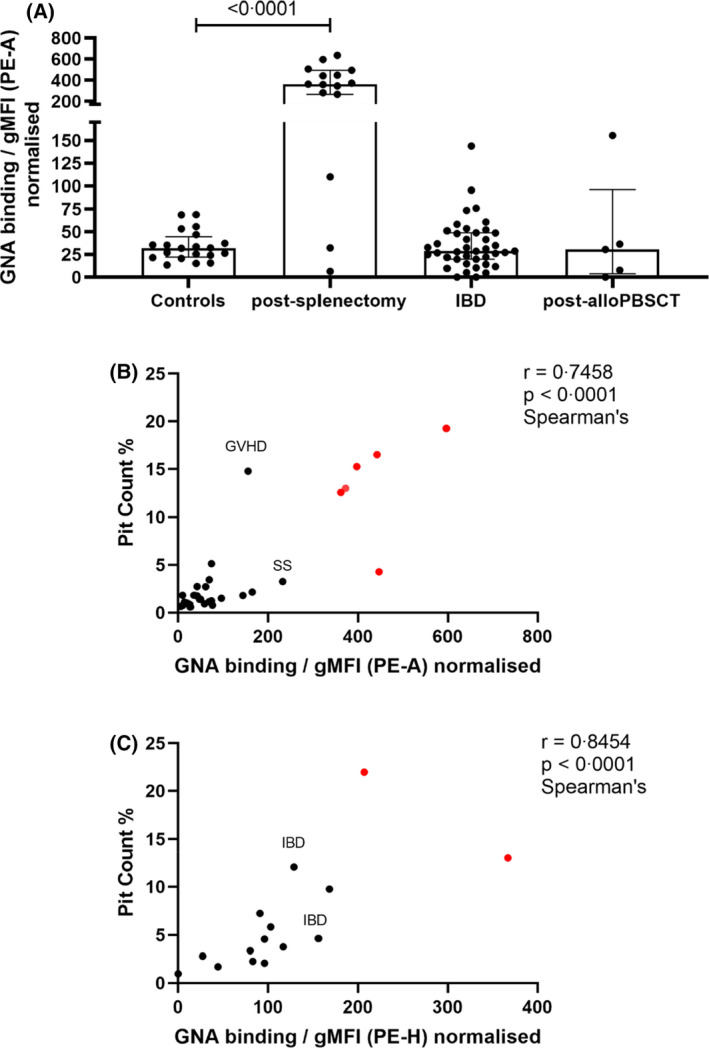
Red blood cells (RBCs) lose plasma membrane in the spleen as they age, but the cells and molecules involved are yet to be identified. Sickle cell disease and infection by Plasmodium falciparum cause oxidative stress that induces aggregates of cross-linked proteins with N-linked high-mannose glycans (HMGs). These glycans can be recognised by mannose-binding lectins, including the mannose receptor (CD206), expressed on macrophages and specialised phagocytic endothelial cells in the spleen to mediate the extravascular haemolysis characteristic of these diseases. We postulated this system might also mediate removal of molecules and membrane in healthy individuals. Surface expression of HMGs on RBCs from patients who had previously undergone splenectomy was therefore assessed: high levels were indeed observable as large membrane aggregates. Glycomic analysis by mass spectrometry identified a mixture of Man5-9 GlcNAc2 structures. HMG levels correlated well with manual pit counts (r = 0.75-0.85). To assess further whether HMGs might act as a splenic reticuloendothelial function test, we measured levels on RBCs from patients with potential functional hyposplenism, some of whom exhibited high levels that may indicate risk of complications.

Keywords: glycosylation; membrane editing; oxidative damage; red blood cells; splenectomy.


Figures

FIGURE 1
FIGURE 1
Red blood cells (RBCs) from patients after splenectomy express high levels of high‐mannose glycans. (A) Flow cytometric analysis of blood samples from seven healthy donors versus five patients after splenectomy. RBCs are stained with nine fluorescently labelled plant lectins that bind a range of glycans, detailed in the Materials and methods section. Lectins GNA and NPL bind terminal mannoses. Vertical axes show normalised geometric mean fluorescence (gMFI). Individual data points from individual samples measured on a single occasion are shown with medians ± interquartile ranges. p values above each graph test the differences between samples from donors with intact versus absent spleen, calculated using two tailed Mann–Whitney tests. (B) Matrix‐assisted laser desorption/ionisation time‐of‐flight (MALDI‐TOF) mass spectra (m/z versus relative intensity) for glycomic analysis of permethylated N‐glycans from membrane ghosts from red blood cells (RBCs) from a single patient after splenectomy (patient A). Red boxes indicate high‐mannose structures. All ions are [M + Na]+. Annotation uses conventional symbols for carbohydrates in accordance with the symbol nomenclature for glycans (SNFG): purple diamond, sialic acids; yellow circle, galactose; yellow square, N‐acetyl galactosamine; blue square, N‐acetyl glucosamine; green circle, mannose; red triangle, fucose. Only major structures are annotated for clarity. (C) Representative images of post‐splenectomy patient's RBCs stained with fluorescently labelled mannose‐binding lectin GNA. Bright field (BF), immunofluorescent (GNA) and merged (merge) views are shown. (D) Western blot from RBC ghosts probed with GNA (top) or β‐spectrin (bottom) from healthy controls (indicated HbAA and splenectomy −), patients after splenectomy (HbAA and splenectomy +, or HbAS indicating heterozygosity for the sickle cell allele and splenectomy +) and sickle cell disease patients (HbSS and splenectomy −). AAL, Aleuria aurantia lectin; dRCA, Ricinus communis agglutinin I; GNA, Galanthus nivalis agglutinin; G.Simp, Griffonia simplicifolia lectin II; MAL‐II, Maackia amurensis lectin II; NPL, Narcissus pseudonarcissus lectin; S.Japan, Sophora japonica lectin; SNA, Sambucus nigra lectin; STL, Solanum tuberosum lectin
FIGURE 2
FIGURE 2
HMG expression after splenectomy. (A) Flow cytometric histograms of mannose‐binding lectin (NPL and GNA) binding to RBCs versus secondary stain‐only control for four patients: Two post‐splenectomy, a healthy donor and a patient with sickle disease (HbSS), both with intact spleens. PE‐H indicates intensity/height of phycoerythrin staining. (B) Time course of binding of lectins to RBCs obtained from patient A after undergoing splenectomy at day 0. RBCs stained with 1 of 10 fluorescently labelled plant lectins that bind a wide range of glycans, detailed in the Materials and methods section, or annexin‐V (AnV). Lectins GNA and NPL bind terminal mannoses. Lectin‐binding gMFI expressed as fold change compared to day 7 post splenectomy sample. (C) Examples of GNA staining of RBCs from three patients. From top to bottom: (i) patient A 4 months post splenectomy, (ii) control autoimmune haemolytic anaemia (AIHA) patient with intact spleen, (iii) patient with sickle cell disease. Staining of CD71+ cells, indicating reticulocytes, are compared with mature CD71 RBCs. GNA binding is indicated in blue and secondary antibody‐only control in red. (D) Surface HMG expression on RBCs obtained from patient A 3 months after splenectomy, marked PA, and six healthy controls with intact spleens, marked C1–6. Cells are fractionated by density, with fractions 1 to 6 indicating increasing density/age. HMG expression is measured by binding of lectins GNA or NPL, assessed by flow cytometry and expressed as normalised gMFI. PE‐H indicates intensity/height of phycoerythrin staining. (E) GNA expression on CD71+ RBCs from patients with sickle cell disease (HbSS, n = 7), post‐splenectomy (n = 9) and healthy controls with intact spleens (n = 19). Medians with interquartile ranges are shown; p value calculated using the Mann–Whitney test, non‐significant for splenectomy versus healthy controls. PE‐A indicates area under curve of phycoerythrin staining. AnV, Annexin‐V; g‐MFI, geometric mean fluorescence intensity; HMG, high‐mannose glycan; RBC, red blood cell. For abbreviations of lectins, see caption to Figure 1
FIGURE 3
FIGURE 3
RBC HMG levels as a potential test of splenic function. (A) RBC HMG levels from healthy controls (n = 20), patients after splenectomy (n = 15) and patients with potential functional hyposplenism: inflammatory bowel disease (IBD) [Crohn's disease (n = 15), ulcerative colitis (n = 3), not further specified (n = 22)] and post‐allogeneic peripheral blood stem cell transplantation (post‐alloPBSCT; n = 5). Medians with interquartile ranges are shown; p value calculated using the Mann–Whitney test. (B) Correlation between pit counts and HMG levels measured by gMFI‐area under curve of GNA binding. Samples from post‐splenectomy donors shown in red, sample from donor with sickle cell disease marked SS and from patient with graft‐versus‐host disease (GVHD) (total n = 31). (C) Correlation between pit counts and HMG levels measured by gMFI‐peak height of GNA binding, measured using samples obtained independently of those used to measure area under curve in (B). Samples from post‐splenectomy donors shown in red, patients with inflammatory bowel disease marked IBD (total n = 15). gMFI, geometric mean fluorescence intensity; GNA, Galanthus nivalis agglutinin; HMG, high‐mannose glycan; PE‐A, area under curve of phycoerythrin staining; RBC, red blood cell

References

    1. Crosby WH. Normal functions of the spleen relative to red blood cells: a review. Blood. 1959. April 01;14(4):399–408. - PubMed
    1. Mebius RE, Kraal G. Structure and function of the spleen. Nat Rev Immunol. 2005. August 01;5(8):606–16. - PubMed
    1. Bratosin D, Mazurier J, Tissier JP, Estaquier J, Huart JJ, Ameisen JC, et al. Cellular and molecular mechanisms of senescent erythrocyte phagocytosis by macrophages. A review. Biochimie. 1998. February 01;80(2):173–95. - PubMed
    1. Lutz HU. Innate immune and non‐immune mediators of erythrocyte clearance. Cell Mol Biol (Noisy‐le‐Grand). 2004. March 01;50(2):107–16. - PubMed
    1. Lutz HU, Bogdanova A. Mechanisms tagging senescent red blood cells for clearance in healthy humans. Front Physiol. 2013. December;25(4):387. - PMC - PubMed

Publication types