

DGAT1 activity synchronises with mitophagy to protect cells from metabolic rewiring by iron depletion
- PMID: 35411952
- PMCID: PMC9108618
- DOI: 10.15252/embj.2021109390
DGAT1 activity synchronises with mitophagy to protect cells from metabolic rewiring by iron depletion
Abstract
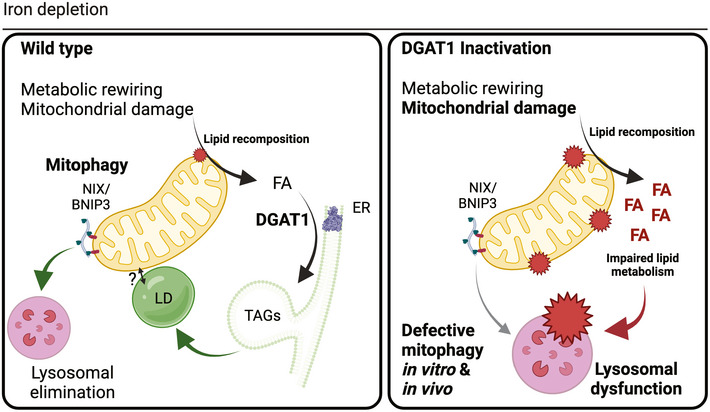
Mitophagy removes defective mitochondria via lysosomal elimination. Increased mitophagy coincides with metabolic reprogramming, yet it remains unknown whether mitophagy is a cause or consequence of such state changes. The signalling pathways that integrate with mitophagy to sustain cell and tissue integrity also remain poorly defined. We performed temporal metabolomics on mammalian cells treated with deferiprone, a therapeutic iron chelator that stimulates PINK1/PARKIN-independent mitophagy. Iron depletion profoundly rewired the metabolome, hallmarked by remodelling of lipid metabolism within minutes of treatment. DGAT1-dependent lipid droplet biosynthesis occurred several hours before mitochondrial clearance, with lipid droplets bordering mitochondria upon iron chelation. We demonstrate that DGAT1 inhibition restricts mitophagy in vitro, with impaired lysosomal homeostasis and cell viability. Importantly, genetic depletion of DGAT1 in vivo significantly impaired neuronal mitophagy and locomotor function in Drosophila. Our data define iron depletion as a potent signal that rapidly reshapes metabolism and establishes an unexpected synergy between lipid homeostasis and mitophagy that safeguards cell and tissue integrity.
Keywords: DGAT1; iron; lipid droplet; metabolism; mitophagy.
© 2022 The Authors. Published under the terms of the CC BY 4.0 license.
Figures
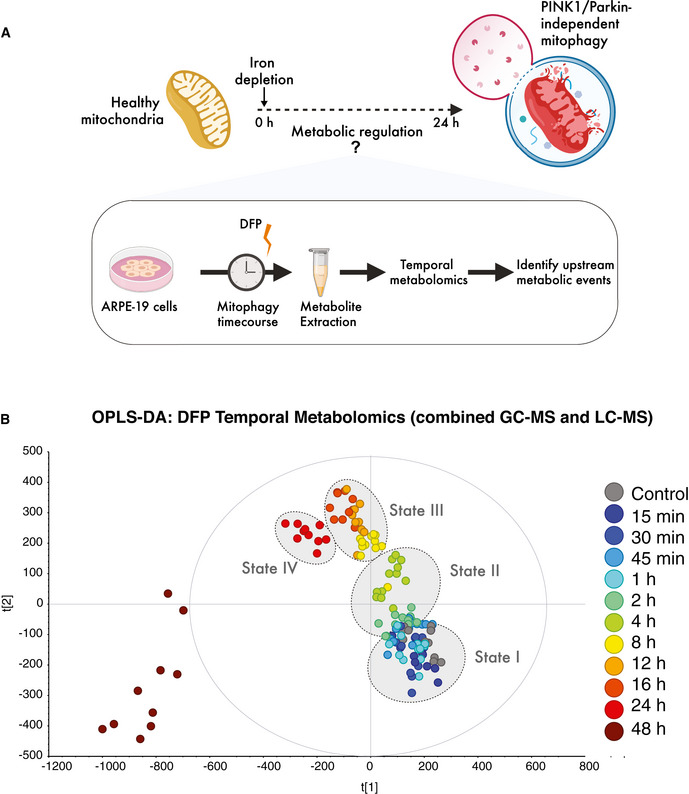
Schematic of temporal metabolomics workflow in human ARPE19 cells.
Multivariate modelling of the metabolome reveals distinct transitions over time (states I–IV) in response to iron chelation using deferiprone (DFP). OPLS‐DA was computed and generated from combined LC‐MS and GC‐MS datasets from three independent biological experiments each with four technical replicates per timepoint in each experiment.
- A
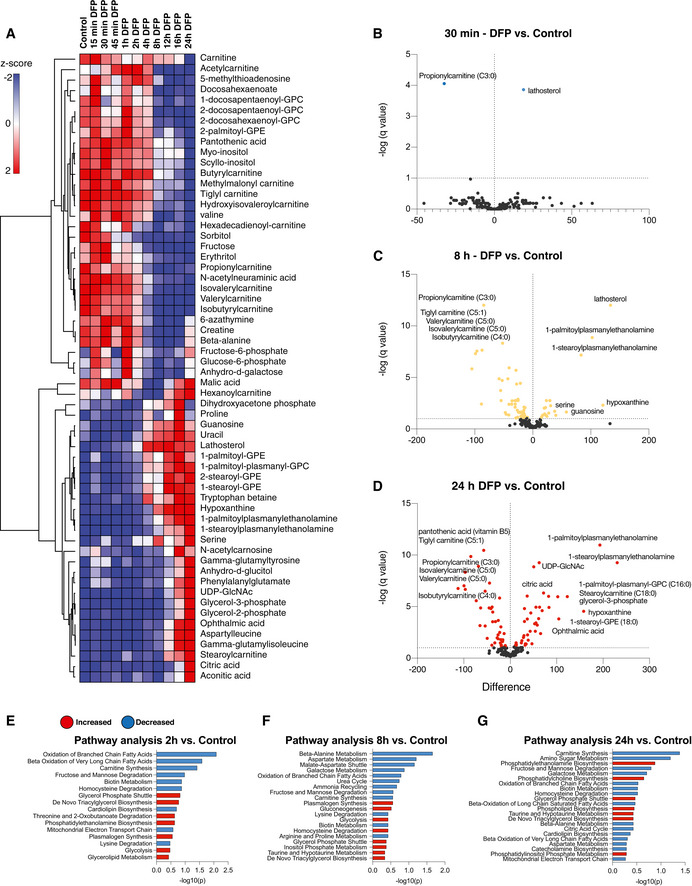
Hierarchical clustering heatmap analysis of the 60 most altered metabolites in cells treated with DFP for the length of time indicated. Each coloured cell on the map corresponds to a z‐score value. The list was generated using MetaboAnalyst software and determined with an ANOVA test with a P < 0.05 threshold followed by post‐hoc analysis. The hierarchical clustering method of one minus Pearson correlation was applied (n = 3, with 4 technical replicates per biological replicate).
- B–D
Volcano plots representing the difference in the mean of metabolites from DFP‐treated cells compared with control cells at acute (30 min), 8 h and overnight (24 h) timepoints, generated by unpaired t‐test with an FDR of 0.01. Coloured points represent significantly altered features.
- E–G
Pathway analysis generated in MetaboAnalyst using the significantly altered metabolites from the volcano plot comparisons. Statistical analysis was determined by hypergeometric test, and the library used for pathway analysis was SMPDB.
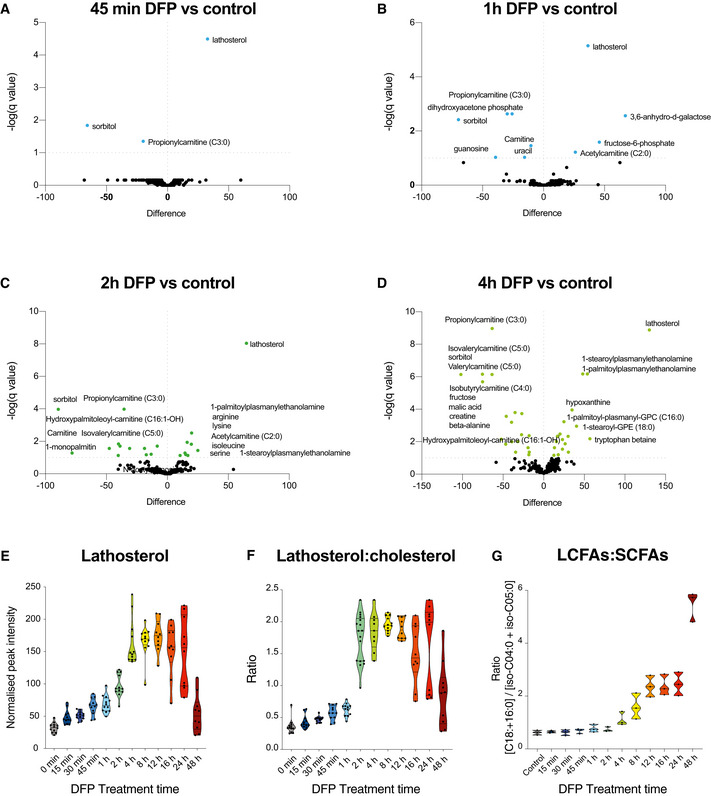
- A–D
Volcano plots representing the difference in the mean of metabolites from DFP‐treated cells compared with control cells at acute (45 min) and at 1, 2 and 4 h timepoints, generated by unpaired T test with an FDR of 0.01. Coloured points are significantly altered.
- E
Graph of lathosterol peak intensities over time (n = 3 biological experiments with 4 technical replicates per timepoint in each experiment).
- F
Ratio of peak intensities of lathosterol over cholesterol upon DFP treatment over time. All data are derived from (n = 3 biological experiments with 4 technical replicates per timepoint in each experiment).
- G
Ratio of peak intensities of long‐chain fatty acids (LCFA) over short‐chain fatty acids (SCFA) upon DFP treatment over time (n = 3 biological experiments with 4 technical replicates per timepoint in each experiment).
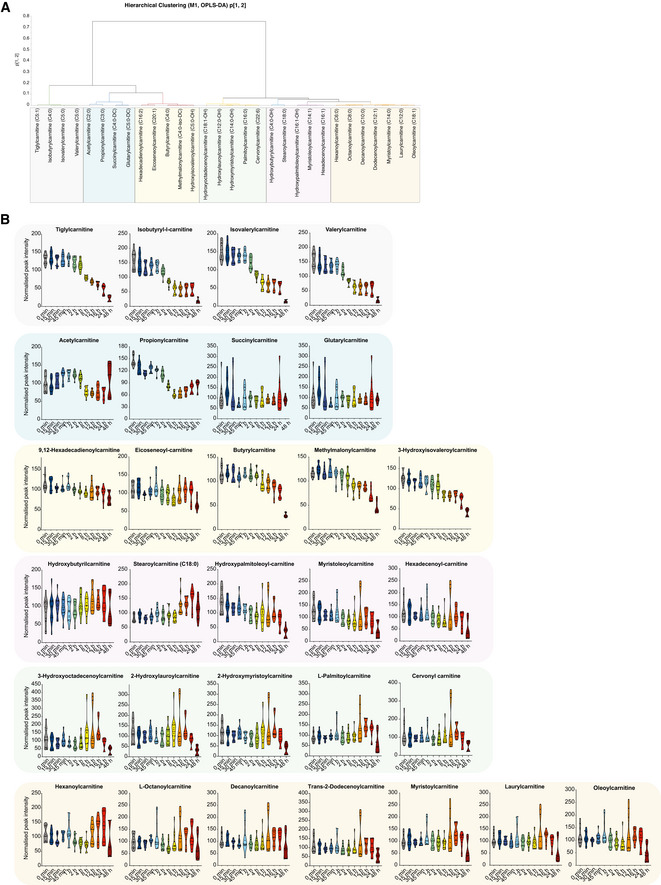
OPLS‐DA (5 + 1) model fitted for control and DFP samples for acylcarnitines (N = 136, K = 30). Hierarchical cluster analysis (HCA) for the p1 and p2‐loadings, calculated with Ward. Arbitrary threshold of 0.03 revealed seven sub‐groups for acylcarnitines.
Graphs represent peak intensities of acylcarnitine metabolites over time revealing selective time‐dependent alterations upon DFP treatment. All graphs are represented as mean ± SEM, n = 3 with 4 technical replicates per timepoint.
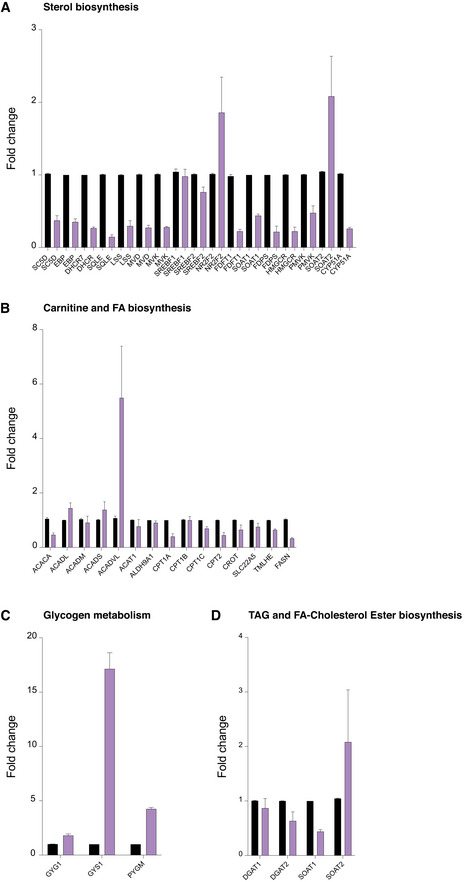
Gene expression analysis by TaqMan RT‐qPCR of mRNA transcripts encoding regulatory enzymes in carnitine and fatty acid biosynthesis in control and 24‐h DFP (1 mM)‐treated cells.
Gene expression analysis by TaqMan RT‐qPCR of mRNA transcripts encoding regulatory enzymes in sterol biosynthesis in control and 24‐h DFP (1 mM)‐treated cells.
Gene expression analysis by TaqMan RT‐qPCR of mRNA transcripts encoding regulatory enzymes in glycogen biosynthesis in control and 24‐h DFP (1 mM)‐treated cells.
Gene expression analysis by TaqMan RT‐qPCR of mRNA transcripts encoding regulatory enzymes in triglyceride and fatty acid‐cholesterol ester biosynthesis in control and 24‐h DFP (1 mM)‐treated cells.
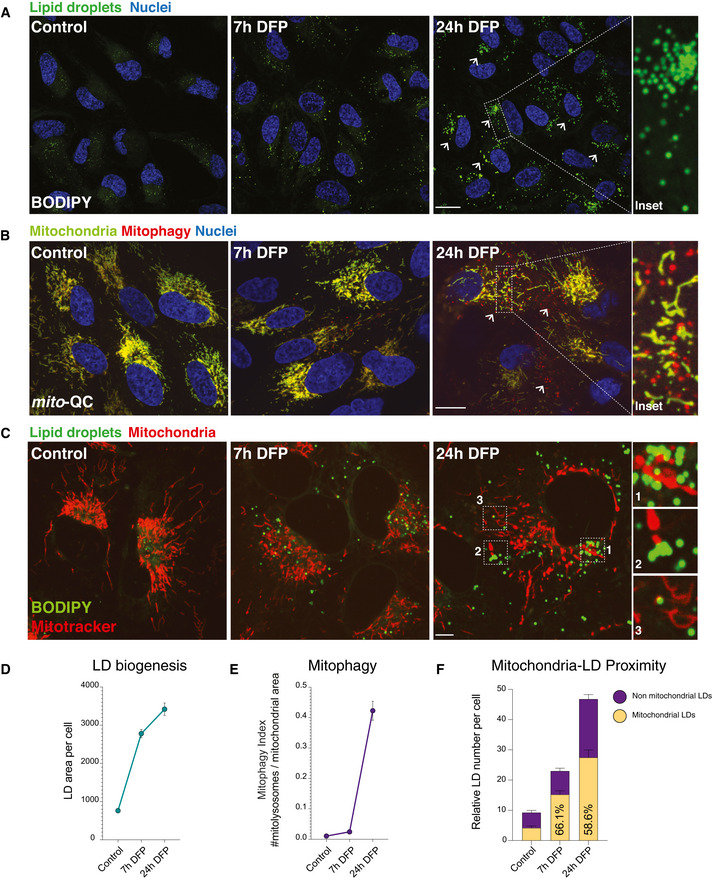
Lipid droplet time course. Representative photomicrographs showing lipid droplet abundance in ARPE19 cells treated with DFP starting at 7 h and maximal at 24 h. Neutral lipids were revealed by BODIPY 493/503. Nuclei are counterstained with Hoescht 33342. Inset shows detail of LDs in a cell treated with DFP for 24 h. Arrows highlight LD accumulation. Scale bars = 5 μm.
Mitophagy time course. Representative photomicrographs showing time course of DFP treatment in mitophagy reporter cells (human ARPE19 cells with stable expression of mito‐QC). Mitochondrial networks are visible in yellow and mitolysosomes as red‐only puncta signifying mitophagy. Nuclei are counterstained with Hoescht 33342. Mitophagy appears maximal after 24 h of DFP treatment, with little difference between control and 7 h conditions. Inset shows details of mitolysosomes within the mitochondrial network of a highly mitophagic cell following DFP treatment. Arrows highlight mitolysosomes. Scale bar = 5 μm.
Lipid droplets accumulate at mitochondria when cells are treated with DFP. Representative photomicrographs showing lipid droplet and mitochondria in ARPE19 cells treated with DFP at 7 h and at 24 h. Neutral lipids were revealed by BODIPY 493/503 and mitochondria by Mitotracker. Nuclei are counterstained with Hoescht 33342. Inset shows detail of LDs in close proximity to mitochondria in cells treated with DFP for 24 h. Scale bar = 5 μm.
Quantification of lipid droplet area per cell over time. Lipid droplet area was quantified per cell area using a pipeline generated in CellProfiler. n = 3 with at least 50 cells quantified per biological replicate for each condition. Data represent means ± SEM.
Quantification of mitophagy over time. Mitophagy index per cell is measured as a ratio of the number of mitolysosomes per mitochondrial content. n = 3 with at least 50 cells quantified per biological replicate for each condition. Data represent means ± SEM.
Quantification of lipid droplet and mitochondria proximity over time. n = 3 with at least 50 cells quantified per biological replicate for each condition. Ratios between control and 24 h DFP; P < 0.05.
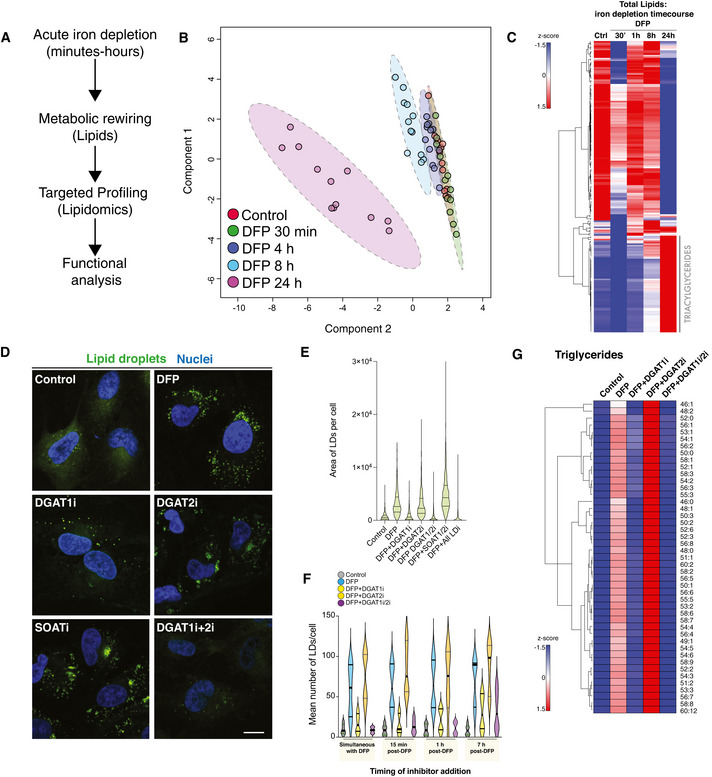
Line diagram of temporal lipidomics workflow in human ARPE19 cells.
Multivariate modelling of the lipidome in cells treated with DFP over time. Sparse PLS‐DA (sPLS‐DA) was performed using Metaboanalyst from LC‐MS datasets from three independent biological experiments each with four technical replicates per timepoint in each experiment.
Lipidomic analysis. Hierarchical clustering heatmap analysis showing alterations in lipid species in ARPE19 cells treated with DFP for the length of time indicated. Each coloured cell on the map corresponds to a z‐score value. The hierarchical clustering method of one minus Pearson correlation was applied (n = 3, with 4 technical replicates per biological replicate).
DFP‐induced lipid droplet accumulation is dependent on DGAT1. Representative photomicrographs of ARPE19 cells treated with DFP (1 mM) for 7 h followed by treatment with LD inhibitors (5 μM) as indicated. Cells were fixed after 24 h of DFP treatment. Neutral lipid droplets were stained by BODIPY493/503, nuclei counterstaned with Hoescht and imaged by confocal microscopy after 24 h of DFP treatment (“I” denotes the presence of inhibitor, for example, DGAT1i = DGAT1 inhibition). Scale bar = 5 μm.
Quantitation of lipid droplets area per cell from experiments in 2D. Data are represented as mean ± SEM (n = 3 with at least 80 cells analysed per condition in each biological replicate).
Acute inhibition of LD biosynthesis by DGAT1. Quantitation of mean LD numbers per ± SEM (n = 2, with 3 technical replicates per biological experiment. Between 1,000 and 2,000 cells analysed per condition).
DGAT1 regulates triglyceride formation upon iron chelation. Hierarchical clustering heatmap analysis showing alterations in triglyceride lipid species in ARPE19 cells treated with DFP for 24 h and lipid droplet inhibitors (5 μM) for 17 h as indicated (i denotes the presence of inhibitor, for example, DGAT1i = DGAT1 inhibition). Each coloured cell on the map corresponds to a z‐score value. The hierarchical clustering method of one minus Pearson correlation was applied, and statistical significance was determined by a t‐test (n = 3, with 5 technical replicates per biological replicate).
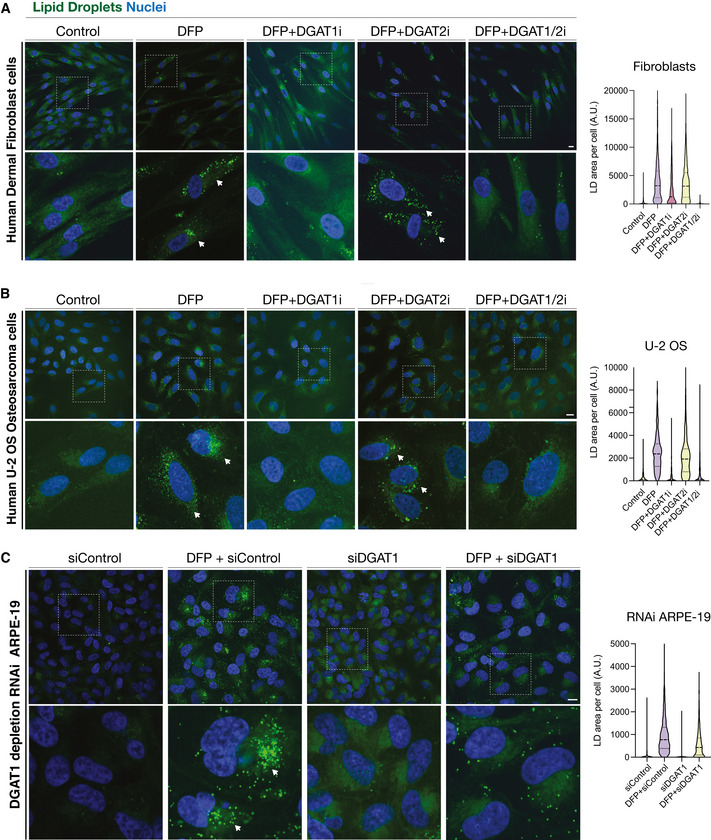
Representative photomicrographs of human dermal fibroblasts treated for 24 h with DFP in the presence or absence of inhibitors to DGAT1 (DGAT1i), DGAT2 (DGAT2i) or DGAT1 and DGAT2 (DGAT1i/2i).
Representative photomicrographs of human U2‐OS osteosarcoma cells, treated as in S5a.
Representative photomicrographs demonstrating the effects of RNAi‐mediated DGAT1 depletion upon in human ARPE19 cells, upon 24 h DFP treatment (si = small interfering; siControl refers to scrambled or non‐targeting siRNA).
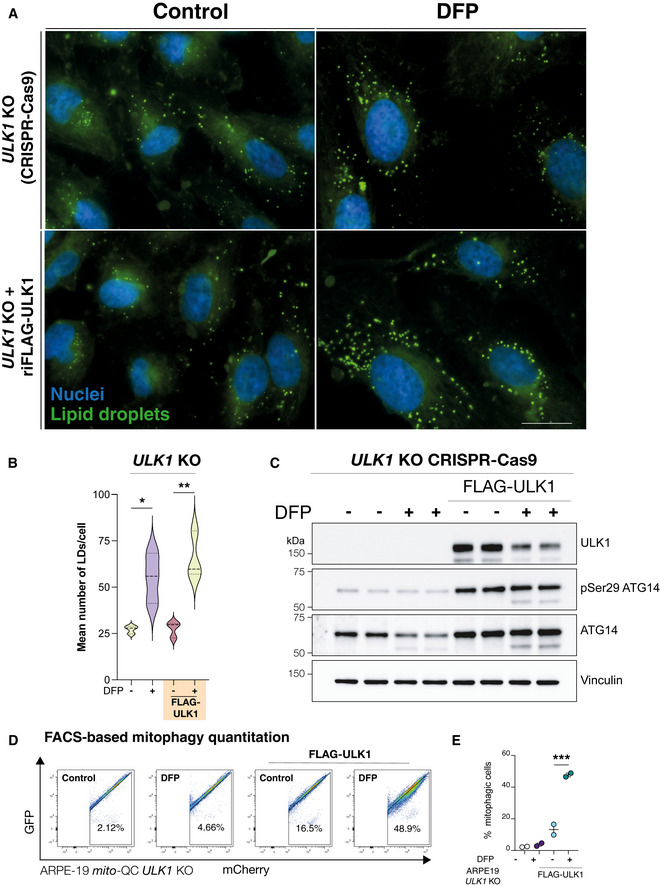
ARPE19 ULK1 CRISPR KO cells with/without re‐introduction of FLAG‐ULK1 were treated with DFP for 24 h as indicated. Cells were fixed and stained with BODIPY493/503 to visualise lipid droplets (green) or DAPI to visualise nuclei (blue). Scale bar, 10 μm.
Quantification from A, n = 3 independent experiments, statistical analysis by one‐way ANOVA. *P < 0.05; **P ≤ 0.01. Median represented by dashed line, quartiles by dotted lines.
Authentication of cell lines in A by immunoblot of protein lysates.
Representative flow cytometry assay of mito‐QC ARPE19 ULK1 CRISPR KO cells with/without re‐introduction of FLAG‐ULK1, treated with DFP for 24 h. A decrease/increase in GFP/mCherry expression was quantified to measure the per cent of cells undergoing mitophagy (indicated by number in each panel).
Quantitation of the flow data representing mean of n = 2 ± SEM. Statistical analysis was performed with one‐way ANOVA and a Tukey’s multiple comparisons test. ***P < 0.001.
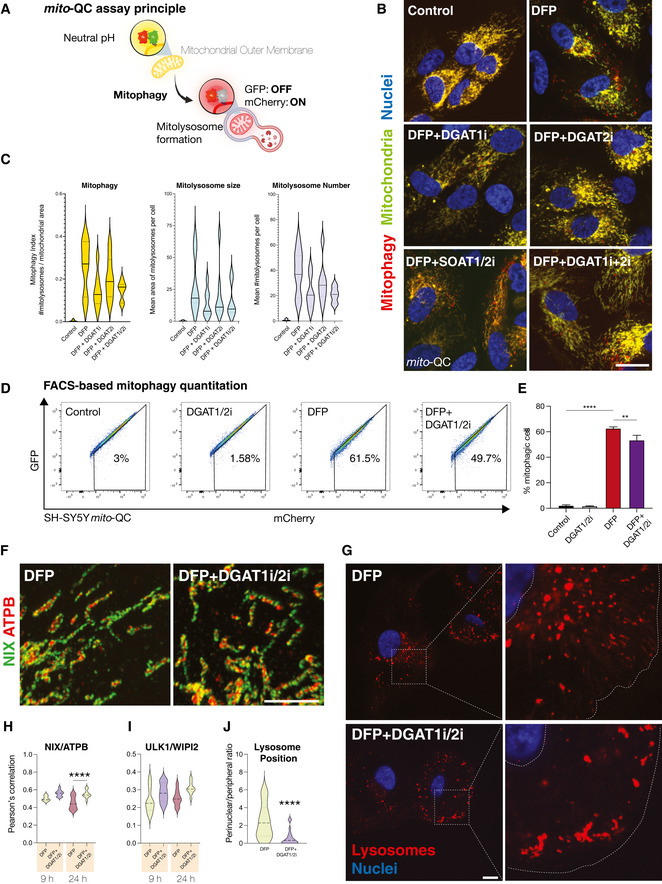
Schematic outlining the mito‐QC mitophagy reporter system. mCherry‐GFP is targeted to the mitochondrial outer membrane via the specific targeting sequence of FIS1. Cytosolic mitochondrial network appears as yellow, due to red–green fluorescence. Upon mitophagy, mitochondria delivered to endolysosomes are distinguished by mCherry‐only puncta, whereas GFP does not fluoresce in the acidic microenvironment.
Representative photomicrographs of mitophagy reporter cells (human ARPE19 cells with stable expression of mito‐QC) treated with DFP (1 mM) for 7 h followed by treatment with LD inhibitors (5 μM) as indicated on the images (I denotes the presence of inhibitor, for example, DGAT1i = DGAT1 inhibition). Cells were fixed after 24 h of DFP treatment. Mitochondrial networks are visible in yellow and mitolysosomes as red‐only puncta signifying mitophagy. Nuclei are counterstained with Hoescht 33342. Scale bar = 5 μm.
Mitophagy quantification for experiments in 5a. Mitophagy index per cell is measured as a ratio of the number of mitolysosomes per mitochondrial content. Graph generated using the mean of each biological replicate ± SEM (n = 7 with at least 70 cells quantified per biological replicate for each condition). Mean area of mitolysosomes per cell and mean number of mitolysosomes per cell for experiments in 5A.
Representative flow cytometry assay of mito‐QC SH‐SY5Y cells treated with DMSO or LD inhibitors (DGAT1/2i, 5 μM) for 24 h, in the presence or absence of DFP. A decrease/increase in GFP/mCherry expression is quantified to measure the per cent of cells undergoing mitophagy (indicated by number in each panel).
Combined quantitation of mito‐QC flow data is represented by mean percentage of cells undergoing mitophagy from three independent experiments ± SEM. Statistical analysis was performed with one‐way ANOVA and Tukey’s multiple comparisons test. ****P < 0.0001; **P < 0.01.
Enlarged regions from representative confocal photomicrographs showing the pattern of endogenous mitochondrial NIX in human ARPE19 cells treated with DFP ±DGAT1i/2i. Samples were immunolabelled with primary antibodies to NIX (green) and ATPB (red). Scale bar = 5 μm.
Representative confocal photomicrographs of cathepsin‐reactive endolysosomes in human ARPE19 cells treated with DFP ± DGAT1i/2i. Inset shows examples of lysosomal phenotypes. Scale bar = 5 μm.
Colocalisation quantitation for experiments shown in 6g. One‐way ANOVA with Bonferroni’s post‐hoc test. ****P < 0.0001. Median represented by dashed line, quartiles by dotted lines n = 2 biological replicates.
Colocalisation quantitation for ULK1/WIPI2 immunolabelling in human ARPE19 cells treated with DFP ± DGAT1i/2i. Median represented by dashed line, quartiles by dotted lines n = 2 biological replicates.
Quantitation of lysosome positioning in DFP ± DGAT1i/2i. One‐way ANOVA with Bonferroni’s post‐hoc test. ****P < 0.0001. Median represented by dashed line, quartiles by dotted lines n = 2 biological replicates.
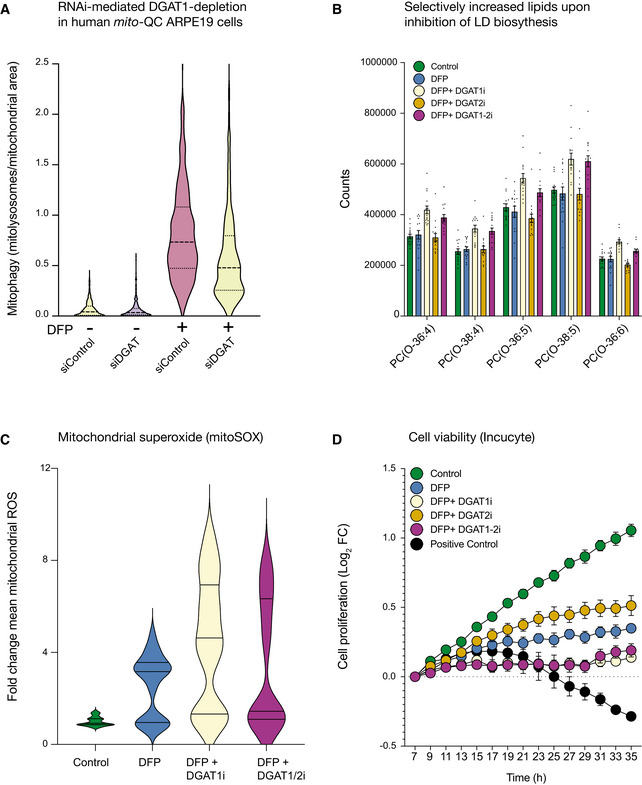
DFP‐induced mitophagy is significantly reduced upon RNAi‐mediated depletion of DGAT1 in human ARPE19 mito‐QC cells (n = 3 experimental replicates).
DGAT1 inhibition specifically increases ether‐linked phosphatidylcholines during iron chelation. Graph of the amount of specific lipid species measure in conditions indicated on figure (i denotes the presence of inhibitor, for example, DGAT1i = DGAT1 inhibition) and displayed as mean ± SEM (n = 3, with 4 technical replicates per biological replicate).
Inhibition of DGAT1‐dependent LD biogenesis drives mtROS production. Cells treated with DFP (1 mM) for 24 h and LD inhibitors (5 μM) for 17 h were incubated with MitoSOX and imaged by spinning disc confocal imaging (i denotes the presence of inhibitor, for example, DGAT1i = DGAT1 inhibition). Graph of the mean fold change in fluorescence intensity ± SEM (n = 3 with at least 70 cells quantified per biological replicate for each condition).
DGAT1 inhibition worsens the effect of iron chelation on cell proliferation. ARPE19 cells treated with DFP (1 mM) in combination with DGAT1 inhibitors (5 μM) ceased to proliferate in comparison with cells treated with DFP only. Positive control cells are treated with puromycin (7 μM). Results are presented as mean ± SEM of Log2 fold change, n = 3 experimental replicates; each experimental replicate is the average of technical duplicates.
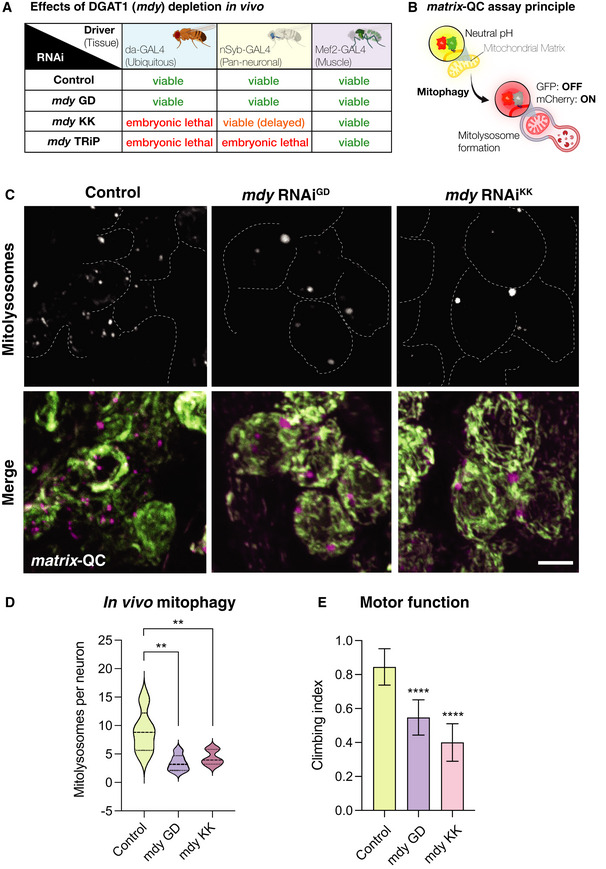
Phenotypic assessment of DGAT1/mdy knockdown by different RNAi transgenes by GAL4 drivers ubiquitously or in a tissue‐specific manner.
Schematic for the matrix‐QC mitophagy reporter system. mCherry‐GFP is targeted to the mitochondrial matrix via the specific COXVIII targeting sequence. As for mito‐QC, the cytosolic mitochondrial network appears in yellow, due to red–green fluorescence. Upon mitophagy, mitochondria delivered to endolysosomes are distinguished by mCherry‐only puncta, whereas GFP does not fluoresce in the acidic microenvironment.
Representative photomicrographs of larval neuronal cell bodies expressing the matrix‐QC reporter and RNAi for mdy or control driven with nSyb‐GAL4. GFP is shown in green, mCherry is shown in magenta. Mitolysosomes (mCherry‐only puncta) are shown in greyscale. Scale bar = 5 μm.
Quantitative analysis of mitophagy (mitolysosome per neuronal cell body). Data are shown as violin plot with median (dashed line) and quartile range (dotted lines); n = 5–6 animals, with 23–40 cells per animal. One‐way ANOVA with Šidák’s post‐test correction for multiple samples; **P < 0.01.
Analysis of locomotor behaviour (climbing) in animals with neuron‐specific (nSyb‐GAL4) knockdown of mdy or control. Bars show mean ± 95% CI; n = 40, 57 and 45 animals, respectively. Kruskal–Wallis test with Dunn’s post‐hoc correction; ****P < 0.0001.
References
Publication types
MeSH terms
Substances
Grants and funding
LinkOut - more resources
Full Text Sources
Medical
Molecular Biology Databases
