. 2022 May 6;50(8):4246-4257.
doi: 10.1093/nar/gkac245.

Visualization of ligand-induced c-MYC duplex-quadruplex transition and direct exploration of the altered c-MYC DNA-protein interactions in cells

Affiliations

Visualization of ligand-induced c-MYC duplex-quadruplex transition and direct exploration of the altered c-MYC DNA-protein interactions in cells

Jia-Hao Yuan et al. Nucleic Acids Res. .

Abstract

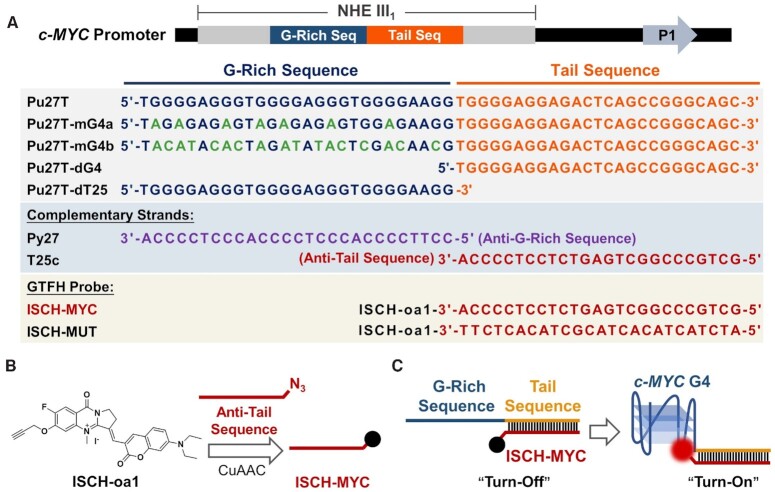
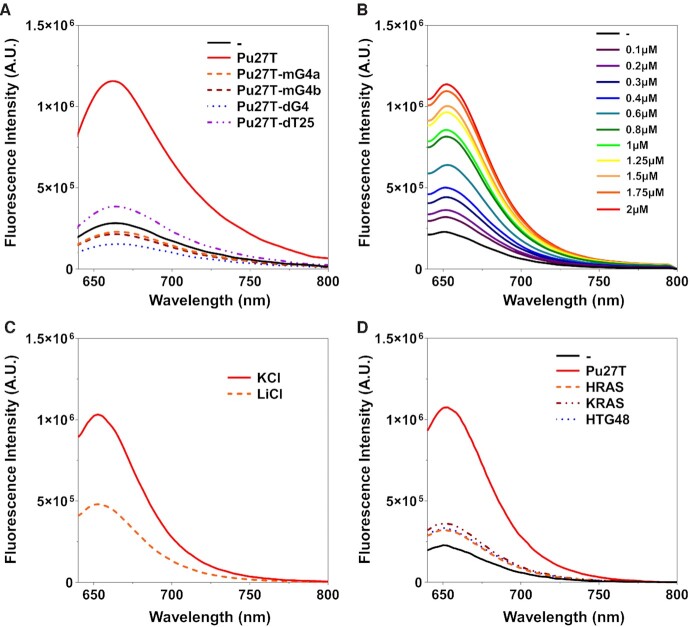
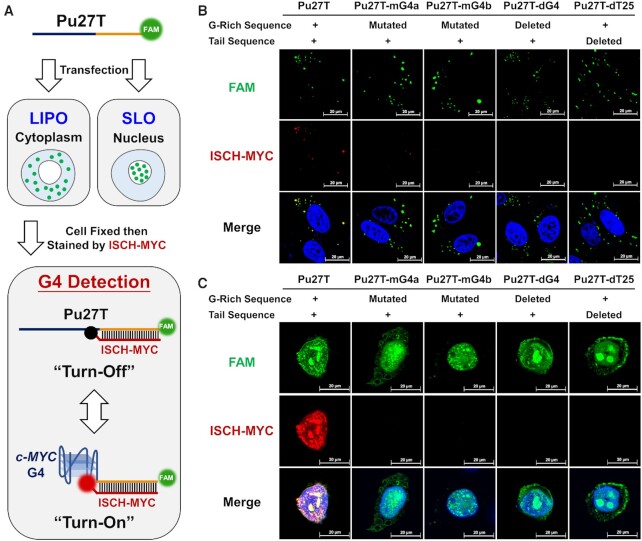
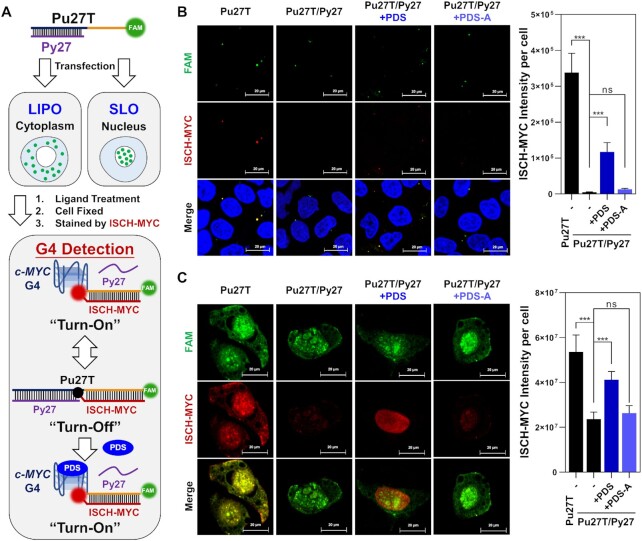
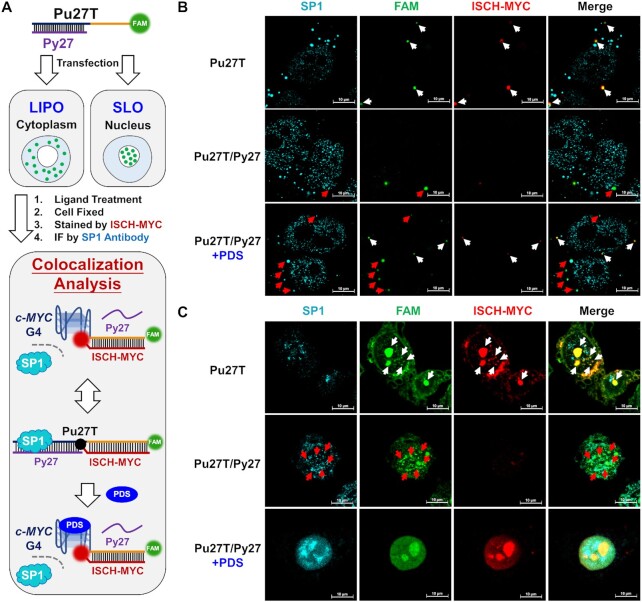
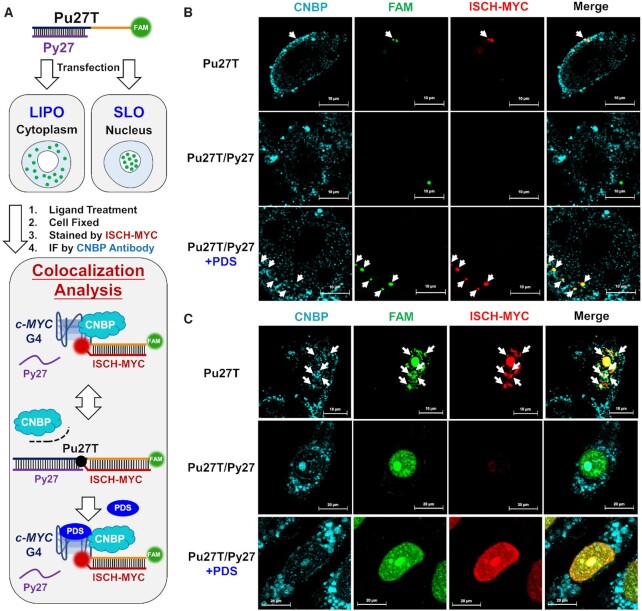
Ligand-Induced duplex-quadruplex transition within the c-MYC promoter region is one of the most studied and advanced ideas for c-MYC regulation. Despite its importance, there is a lack of methods for monitoring such process in cells, hindering a better understanding of the essence of c-MYC G-quadruplex as a drug target. Here we developed a new fluorescent probe ISCH-MYC for specific c-MYC G-quadruplex recognition based on GTFH (G-quadruplex-Triggered Fluorogenic Hybridization) strategy. We validated that ISCH-MYC displayed distinct fluorescence enhancement upon binding to c-MYC G-quadruplex, which allowed the duplex-quadruplex transition detection of c-MYC G-rich DNA in cells. Using ISCH-MYC, we successfully characterized the induction of duplex to G-quadruplex transition in the presence of G-quadruplex stabilizing ligand PDS and further monitored and evaluated the altered interactions of relevant transcription factors Sp1 and CNBP with c-MYC G-rich DNA. Thus, our study provides a visualization strategy to explore the mechanism of G-quadruplex stabilizing ligand action on c-MYC G-rich DNA and relevant proteins, thereby empowering future drug discovery efforts targeting G-quadruplexes.


Figures

Figure 1.
Figure 1.
Illustration of GTFH probe ISCH-MYC for c-MYC G-quadruplex detection. (A) c-MYC G-rich DNA sequences, complementary sequences and GTFH probes used in this study. (B) Synthesis of ISCH-MYC. (C) Design principle of ISCH-MYC.
Figure 2.
Figure 2.
Fluorescence spectra of ISCH-MYC with DNAs. (A) Fluorescence spectra of 1 μM ISCH-MYC with or without 2 μM DNAs in 10 mM Tris-HCl buffer, 100 mM KCl, pH 7.2. (B) Fluorescence spectra of 1 μM ISCH-MYC with Pu27T of different concentrations in 10 mM Tris-HCl buffer, 100 mM KCl, pH 7.2. (C) Fluorescence spectra of 1 μM ISCH-MYC with 2 μM Pu27T in 10 mM Tris-HCl buffer, pH 7.2 containing 100 mM KCl or LiCl. (D) Fluorescence spectra of 1 μM ISCH-MYC with or without 2 μM DNA G-quadruplexes in 10 mM Tris-HCl buffer, 100 mM KCl, pH 7.2.
Figure 3.
Figure 3.
Confocal imaging of FAM-labeled DNA-transfected cells stained by ISCH-MYC. (A) Schematic diagram of cell imaging process using Lipofectamine 3000 (LIPO) or Streptolysin O (SLO) as transfection reagent. (B) Imaging of FAM-labeled DNA-transfected cells stained by ISCH-MYC. The DNAs are delivered into cytoplasm by Lipofectamine 3000. (C) Imaging of FAM-labeled DNA-transfected cells stained by ISCH-MYC. The DNAs are delivered into nucleus by Streptolysin O.
Figure 4.
Figure 4.
Detection of ligand-induced duplex-quadruplex transition in cells. (A) Schematic diagram of cell imaging process using Lipofectamine 3000 (LIPO) or Streptolysin O (SLO) as transfection reagent. (B) Imaging of c-MYC G-rich DNA-transfected cells treated with PDS or PDS-A then stained by ISCH-MYC. The DNAs are delivered into cytoplasm by Lipofectamine 3000. (C) Imaging of c-MYC G-rich DNA-transfected cells treated with PDS or PDS-A then stained by ISCH-MYC. The DNAs are delivered into nucleus by Streptolysin O. Quantification of fluorescence was shown on the right. Quantification data are expressed as the mean ± SEM (standard error of mean). For each sample, about 100 cells were measured. The standard error was calculated from a set of three replicate experiments. Statistical significance was determined by the t test as (ns) not significant, (*) P < 0.05, (**) P < 0.01, and (***) P < 0.001.
Figure 5.
Figure 5.
Visualization of the altered c-MYC DNA-Sp1 interactions. (A) Schematic diagram of cell imaging and analysis process using Lipofectamine 3000 (LIPO) or Streptolysin O (SLO) as transfection reagent. (B) Immunofluorescence imaging of Sp1 in Pu27T or Pu27T/Py27 transfected cells treated with or without PDS then stained by ISCH-MYC. The DNAs are delivered into cytoplasm by Lipofectamine 3000. (C) Immunofluorescence imaging of Sp1 in Pu27T or Pu27T/Py27 transfected cells treated with or without PDS then stained by ISCH-MYC. The DNAs are delivered into nucleus by Streptolysin O. White arrows indicate the distinct colocalization of FAM foci with ‘turn-on’ ISCH-MYC signals; while red arrows indicate the distinct colocalization of FAM foci with Sp1 signals (ISCH-MYC signals were ‘turn-off’ in this case).
Figure 6.
Figure 6.
Visualization of the altered c-MYC DNA-CNBP interactions. (A) Schematic diagram of cell imaging and analysis process using Lipofectamine 3000 (LIPO) or Streptolysin O (SLO) as transfection reagent. (B) Immunofluorescence imaging of CNBP in Pu27T or Pu27T/Py27 transfected cells treated with or without PDS then stained by ISCH-MYC. The DNAs are delivered into cytoplasm by Lipofectamine 3000. (C) Immunofluorescence imaging of CNBP in Pu27T or Pu27T/Py27 transfected cells treated with or without PDS then stained by ISCH-MYC. The DNAs are delivered into nucleus by Streptolysin O. White arrows indicate the distinct colocalization of FAM foci, CNBP foci and ‘turn-on’ ISCH-MYC signals.

References

    1. Varshney D., Spiegel J., Zyner K., Tannahill D., Balasubramanian S.. The regulation and functions of DNA and RNA G-quadruplexes. Nat. Rev. Mol. Cell. Biol. 2020; 21:459–474. - PMC - PubMed
    1. King J.J., Irving K.L., Evans C.W., Chikhale R.V., Becker R., Morris C.J., Pena Martinez C.D., Schofield P., Christ D., Hurley L.H.et al. .. DNA G-quadruplex and i-Motif structure formation is interdependent in human cells. J. Am. Chem. Soc. 2020; 142:20600–20604. - PubMed
    1. Burge S., Parkinson G.N., Hazel P., Todd A.K., Neidle S.. Quadruplex DNA: sequence, topology and structure. Nucleic Acids Res. 2006; 34:5402–5415. - PMC - PubMed
    1. Wu F., Niu K.K., Cui Y., Li C.C., Lyu M., Ren Y.D., Chen Y.F., Deng H.M., Huang L.H., Zheng S.C.et al. .. Genome-wide analysis of DNA G-quadruplex motifs across 37 species provides insights into G4 evolution. Commun. Biol. 2021; 4:98. - PMC - PubMed
    1. Zyner K.G., Mulhearn D.S., Adhikari S., Martinez Cuesta S., Di Antonio M., Erard N., Hannon G.J., Tannahill D., Balasubramanian S.. Genetic interactions of G-quadruplexes in humans. Elife. 2019; 8:e46793. - PMC - PubMed