. 2022 Jul 5;50(W1):W774-W781.
doi: 10.1093/nar/gkac238.

WashU Epigenome Browser update 2022

Affiliations

WashU Epigenome Browser update 2022

Daofeng Li et al. Nucleic Acids Res. .

Abstract

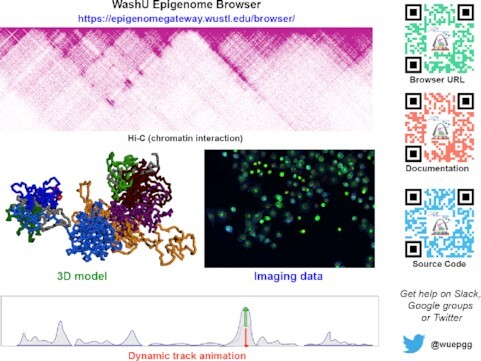
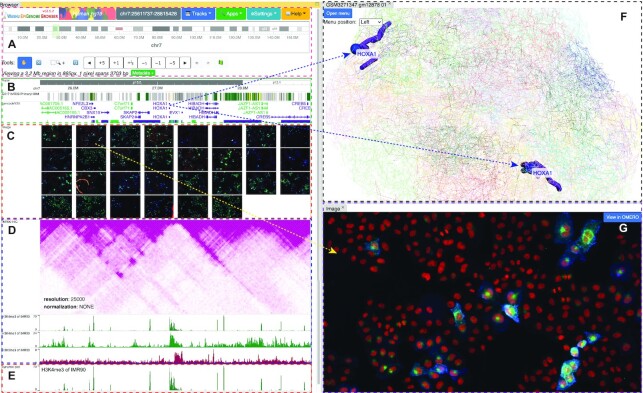
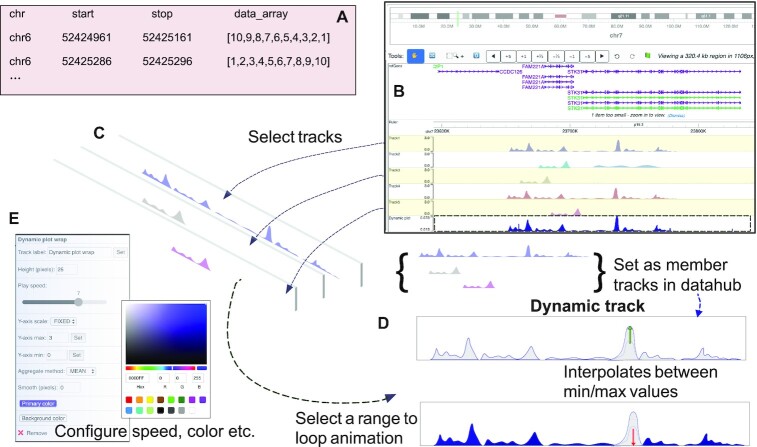
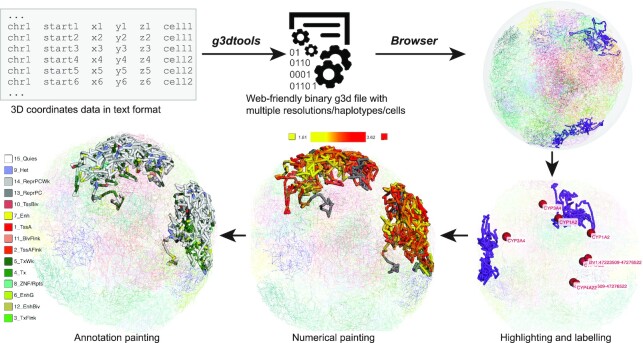
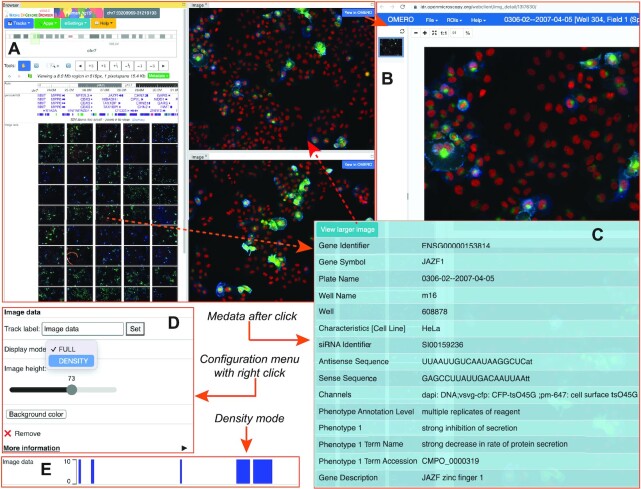
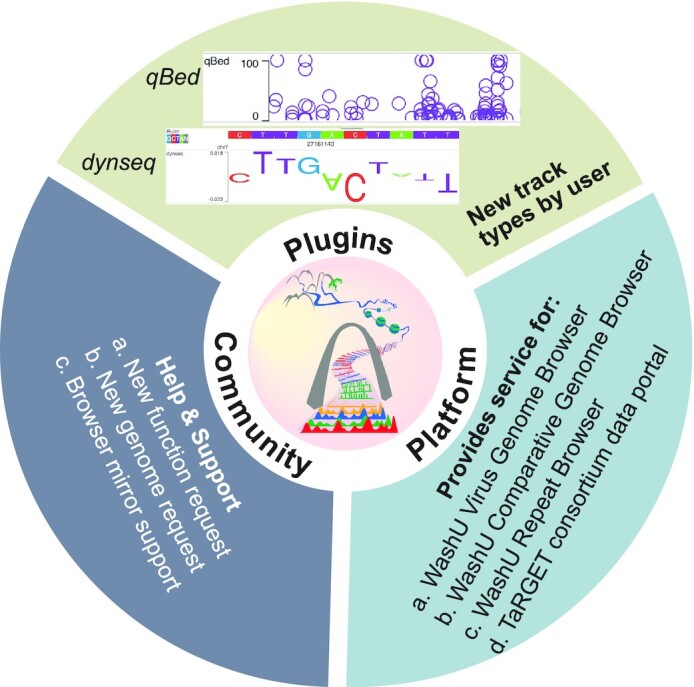
WashU Epigenome Browser (https://epigenomegateway.wustl.edu/browser/) is a web-based genomic data exploration tool that provides visualization, integration, and analysis of epigenomic datasets. The newly renovated user interface and functions have enabled researchers to engage with the browser and genomic data more efficiently and effectively since 2018. Here, we introduce a new integrated panel design in the browser that allows users to interact with 1D (genomic features), 2D (such as Hi-C), 3D (genome structure), and 4D (time series) data in a single web page. The browser can display three-dimensional chromatin structures with the 3D viewer module. The 4D tracks, called 'Dynamic' tracks, animatedly display time-series data, allowing for a more striking visual impact to identify the gene or genomic region candidates as a function of time. Genomic data, such as annotation features, numerical values, and chromatin interaction data can all be viewed in the dynamic track mode. Imaging data from microscopy experiments can also be displayed in the browser. In addition to software development, we continue to service and expand the data hubs we host for large consortia including 4DN, Roadmap Epigenomics, TaRGET and ENCODE, among others. Our growing user/developer community developed additional track types as plugins, such as qBed and dynseq tracks, which extend the utility of the browser. The browser serves as a foundation for additional genomics platforms including the WashU Virus Genome Browser (for COVID-19 research) and the Comparative Genome Browser. The WashU Epigenome Browser can also be accessed freely through Amazon Web Services at https://epigenomegateway.org/.


Figures

Graphical Abstract
Graphical Abstract
New components of WashU Epigenome Browser: 3D chromatin viewer, imaging data viewer and dynamic tracks.
Figure 1.
Figure 1.
Browser UI with the multi-panel setting. The browser user interface displays data of different types in each panel, representing different dimensionalities. The panel on the left shows the main, conventional browser window. The panel on the top right is a 3D viewer and shows a 3D genome model. The panel on the bottom right shows an image from a microscopy experiment. (A) The main browser menu, ideogram, and select functions. (B) Ruler, chromHMM, and gene tracks, representing 1D data tracks. (C) Image track in thumbnail mode. (D) Hi-C and wiggle/numerical tracks, representing 2D data tracks. (E) A representative dynamic track, the animation displays the 3 numerical tracks from (D), representing 4D data tracks. (F) 3D viewer, displaying the highlighted gene (HOXA1) as spheres, representing 3D data tracks. (G) One expanded image in its own panel with links to Omero viewer provided by the image source.
Figure 2.
Figure 2.
Dynamic tracks. Dynamic track displays an animation of data from different time points or samples. One of the newly developed dynamic track type: dBedgraph in text format (A). Browser views show steps to select multiple tracks and combine them into a dynamic track, and the animation displays each track iteratively (B–D). Dynamic track can be configured to adjust the height, speed, y-axis scale, and color via settings (E).
Figure 3.
Figure 3.
3D viewer. An overview of how 3D data is displayed in the Browser. 3D coordinates in text format are converted to the binary g3d data using g3dtools, then the file is submitted to the browser for visualization. The 3D viewer can highlight current browser regions or specific genes. Users can also use numerical and annotation data to decorate the 3D structure.
Figure 4.
Figure 4.
Image track. How imaging data is displayed in the browser. Browser view with an image track in thumbnail mode (A). The external image display window by image data source provider (B). The metadata popup menu is associated with one image (C). Configuration menu of the image track in main browser (D). The image track is displayed in density mode (E).
Figure 5.
Figure 5.
Browser community engagement. Browser users develop new track types for their own visualization. We provide help and support for users with new function/genome requests, as well as technical support for mirror sites. The Browser provides services for many other genomic tools.

References

    1. Encode Project Consortium The ENCODE (ENCyclopedia of DNA elements) project. Science. 2004; 306:636–640. - PubMed
    1. Encode Project Consortium An integrated encyclopedia of DNA elements in the human genome. Nature. 2012; 489:57–74. - PMC - PubMed
    1. Encode Project Consortium A user's guide to the encyclopedia of DNA elements (ENCODE). PLoS Biol. 2011; 9:e1001046. - PMC - PubMed
    1. Bernstein B.E., Stamatoyannopoulos J.A., Costello J.F., Ren B., Milosavljevic A., Meissner A., Kellis M., Marra M.A., Beaudet A.L., Ecker J.R.et al. .. The NIH roadmap epigenomics mapping consortium. Nat. Biotechnol. 2010; 28:1045–1048. - PMC - PubMed
    1. Roadmap Epigenomics C., Kundaje A., Meuleman W., Ernst J., Bilenky M., Yen A., Heravi-Moussavi A., Kheradpour P., Zhang Z., Wang J.et al. .. Integrative analysis of 111 reference human epigenomes. Nature. 2015; 518:317–330. - PMC - PubMed

Publication types