. 2022 Aug 10;71(5):1210-1224.
doi: 10.1093/sysbio/syac027.

Robust, Universal Tree Balance Indices

Affiliations

Robust, Universal Tree Balance Indices

Jeanne Lemant et al. Syst Biol. .

Erratum in

Abstract

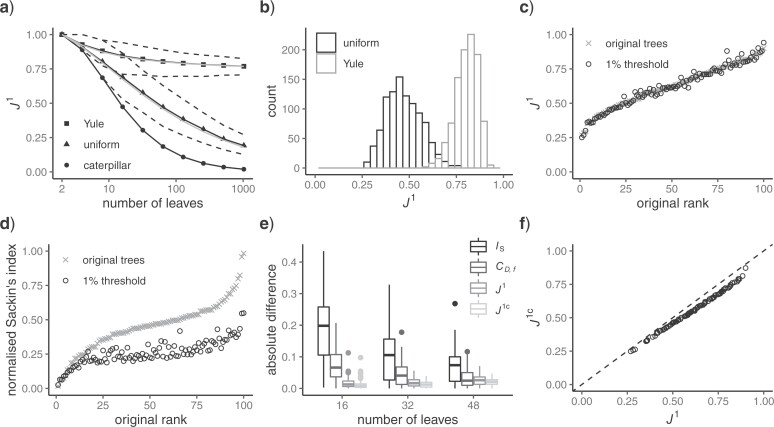
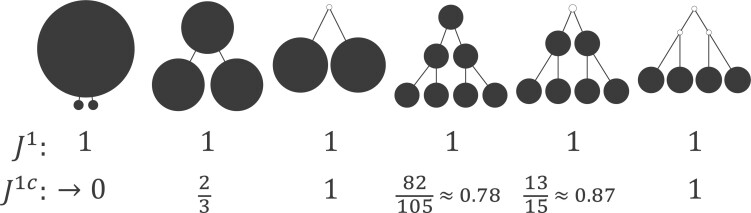
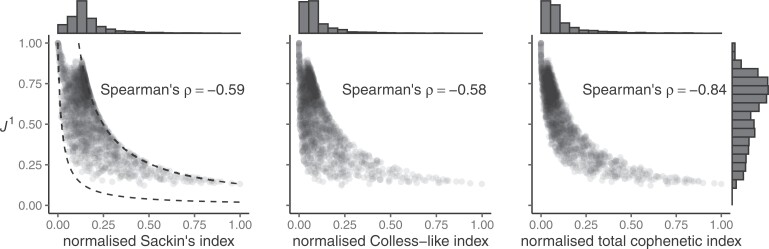
Balance indices that quantify the symmetry of branching events and the compactness of trees are widely used to compare evolutionary processes or tree-generating algorithms. Yet, existing indices are not defined for all rooted trees, are unreliable for comparing trees with different numbers of leaves, and are sensitive to the presence or absence of rare types. The contributions of this article are twofold. First, we define a new class of robust, universal tree balance indices. These indices take a form similar to Colless' index but can account for population sizes, are defined for trees with any degree distribution, and enable meaningful comparison of trees with different numbers of leaves. Second, we show that for bifurcating and all other full m-ary cladograms (in which every internal node has the same out-degree), one such Colless-like index is equivalent to the normalized reciprocal of Sackin's index. Hence, we both unify and generalize the two most popular existing tree balance indices. Our indices are intrinsically normalized and can be computed in linear time. We conclude that these more widely applicable indices have the potential to supersede those in current use. [Cancer; clone tree; Colless index; Sackin index; species tree; tree balance.].


Figures

<sc>Figure</sc> 1.
Figure 1.
Contrasting trees. a) Caterpillar tree with formula image, formula image, formula image, formula image, formula image, formula image. b) Fully symmetric bifurcating tree with formula image, formula image, formula image, formula image, formula image. c) Star tree with formula image, formula image, formula image and formula image undefined, formula image. d) Clone tree of the lung tumor CRUK0065 in the TRACERx cohort (Jamal-Hanjani et al. 2017). In the clone tree, nodes represented by empty circles correspond to extinct clones, and the diameters of other nodes are proportional to the corresponding clone population sizes.
<sc>Figure</sc> 2.
Figure 2.
Muller plots (left column), taxon or clone trees (middle column), and cladograms (right column) representing evolution by splitting only (a) and both splitting and budding (b). In a Muller plot, polygons represent proportional subpopulation sizes (vertical axis) over time (horizontal axis), and each descendant is shown emerging from its parent polygon. In the trees, nodes represented by empty circles correspond to extinct types.
<sc>Figure</sc> 3.
Figure 3.
a) A tree in which each internal node has null size and splits its descendants into subtrees of equal magnitude, and hence formula image. This tree can be considered balanced only according to an index that accounts for node size. b) A linear tree, for which formula image. c–e) A robust, universal tree balance index formula image is insensitive to the addition of a subtree of arbitrarily small magnitude if it is added to a leaf (a) or a nonroot node with out-degree 1 (b), but not necessarily if the subtree is added to a nonroot node with greater out-degree (c).
<sc>Figure</sc> 4.
Figure 4.
a) An example calculation of formula image. Numbers shown inside nodes are the node sizes. b) All multifurcating leafy trees on six leaves without linear parts and with equally sized leaves, sorted and labelled by formula image value.
<sc>Figure</sc> 5.
Figure 5.
a) formula image values for caterpillar trees and random trees generated from the Yule and uniform models (1000 trees per data point). All internal nodes have null size and all leaves have equal size. Solid black curves are the means; dashed curves are the 5th and 95th percentiles; and gray curves are formula image divided by the corresponding expectation of formula image (where formula image is the number of leaves). b) formula image distributions for random trees on 64 leaves generated from the Yule and uniform models (1000 trees per model). c) formula image values for 100 random trees on 16 leaves, before and after applying a 1formula image sensitivity threshold. These random trees were generated from the alpha-gamma model with formula image and formula image. d) formula image values for the same set of random trees. e) Absolute change in normalized index values due to applying a 1formula image sensitivity threshold. Results are based on 100 random trees for each number of leaves, generated as in (c) and (d). formula image here is the Colless-like index with formula image and formula image is the mean deviation from the median, as recommended by Mir et al. (2018). f) Values of formula image versus formula image for random multifurcating trees on 16 leaves, with node sizes drawn from a continuous uniform distribution. The dashed reference line has slope 1.
<sc>Figure</sc> 6.
Figure 6.
Example values of formula image versus the conservative tree balance index formula image. The latter index takes account of the size of each internal node, relative to the sum of its descendant node sizes.
<sc>Figure</sc> 7.
Figure 7.
Scatter plots of formula image versus normalized Sackin’s, Colless-like, and total cophenetic indices for 2000 random multifurcating leafy trees with 100 equally sized leaves. Histograms in the margins show the marginal distributions. Dashed reference curves in the first panel are obtained by substituting formula image into Equation 6 with formula image and formula image (upper curve) or formula image (lower curve). We use the Colless-like index with formula image and formula image the mean deviation from the median, as recommended by Mir et al. (2018). Normalization of each index other than formula image depends only on the number of leaves and so does not affect correlations. Trees were generated from the alpha-gamma model with formula image and formula image.

References

    1. Agapow P.M., Purvis A. 2002. Power of eight tree shape statistics to detect nonrandom diversification: a comparison by simulation of two models of cladogenesis. Syst. Biol. 51(6): 866–872. - PubMed
    1. Blum M.G.B., François O., Janson S. 2006. The mean, variance and limiting distribution of two statistics sensitive to phylogenetic tree balance. Ann. Appl. Prob. 16(4): 2195–2214.
    1. Chao A., Chiu C.-H., Jost L. 2014. Unifying species diversity, phylogenetic diversity, functional diversity, and related similarity and differentiation measures through hill numbers. Annu. Rev. Ecol. Evol. Syst. 45 (1): 297–324.
    1. Chen B., Ford D., Winkel M. 2009. A new family of Markov branching trees: the alpha-gamma model. Electron. J. Prob. 14: 400–430.
    1. Chkhaidze K., Heide T., Werner B., Williams M.J., Huang W., Caravagna G., Graham T.A., Sottoriva A. 2019. Spatially constrained tumour growth affects the patterns of clonal selection and neutral drift in cancer genomic data. PLoS Comput. Biol. 15(7):e1007243. - PMC - PubMed

Publication types