. 2022 Apr 19;119(16):e2110500119.
doi: 10.1073/pnas.2110500119. Epub 2022 Apr 11.

Elucidation of CKAP4-remodeled cell mechanics in driving metastasis of bladder cancer through aptamer-based target discovery

Affiliations

Elucidation of CKAP4-remodeled cell mechanics in driving metastasis of bladder cancer through aptamer-based target discovery

Xing Sun et al. Proc Natl Acad Sci U S A. .

Abstract

Metastasis contributes to the dismal prognosis of bladder cancer (BLCA). The mechanical status of the cell membrane is expected to mirror the ability of cell migration to promote cancer metastasis. However, the mechanical characteristics and underlying molecular profile associated with BLCA metastasis remain obscure. To study the unique cellular architecture and traits associated with cell migration, using a process called cell-based systematic evolution of ligands by exponential enrichment (cell-SELEX) we generated an aptamer-based molecular probe, termed spl3c, which identified cytoskeleton-associated protein 4 (CKAP4). CKAP4 was associated with tumor metastasis in BLCA, but we also found it to be a mechanical regulator of BLCA cells through the maintenance of a central-to-peripheral gradient of stiffness on the cell membrane. Notably, such mechanical traits were transportable through exosome-mediated intercellular CKAP4 trafficking, leading to significant enhancement of migration in recipient cells and, consequently, aggravating metastatic potential in vivo. Taken together, our study shows the robustness of this aptamer-based molecular tool for biomarker discovery, revealing the dominance of a CKAP4-induced central-to-peripheral gradient of membrane stiffness that benefits cell migration and delineating the role of exosomes in mediating mechanical signaling in BLCA metastasis.

Keywords: CKAP4; aptamer; bladder cancer; cell mechanics; cell migration.


Conflict of interest statement

The authors declare no competing interest.

Figures
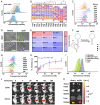
Fig. 1.
Fig. 1.
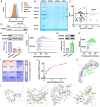
Screening of an aptamer specifically targeting BLCA cells. (A) Flow cytometry to monitor the enrichment of the aptamer in the DNA pool. Binding of the DNA pool at the 5th, 8th, 11th, 13th, and 14th cycles are labeled as gray, orange, green, blue and red, respectively. (B) Hierarchy cluster analysis of the top 20 sequences in the 13th cycle DNA pool. A, T, C, and G are indicated as red, blue, pink, and yellow, respectively. (C) Flow cytometry results of aptamer candidates spl1–spl8 and library sequences to BLCA 5637 cells. (D) Binding specificity of spl3 to BLCA 5637 and SV-HUC-1 cells by confocal microscopy. (Scale bar: 20 μm.) (E) Binding ability of spl3 to an array of cell lines. Row 1: urinary tract cell lines; rows 2 and 3: adherent cancer cell lines; row 4: leukemia cells. (F) Scheme of aptamer truncation. (G) Binding ability of truncated daughter aptamers of spl3 to BLCA 5637 cells by flow cytometry. (H) The dissociation constant (Kd) of spl3 (dashed line, red) and spl3c (solid line, blue) to BLCA 5637 cells. (I) Competition assay of spl3 and spl3c to BLCA 5637 cells. The concentration of spl3c was 250 nM, and those of spl3 and library were 2.5 μM. (J) In vivo binding of aptamer spl3c to BLCA 5637 cell-derived tumor. (K) Accumulation of aptamer spl3c in mouse organs.
Fig. 2.
Fig. 2.
Identification of aptamer spl3c-binding target on BLCA cells. (A) Identification of target type through cell membrane protein cleavage by trypsin and proteinase K. (B) Coomassie blue–stained SDS-PAGE was used to analyze aptamer-assisted target purification. The differential bands are indicated with black arrows. Beads refer to the naked beads, used as control. (C) Identification of the target of aptamer spl3c by MS score and fold change analysis. (D) Aptamer pull-down assay. Samples 1, 2, and 3 are the proteins pulled down by naked beads, DNA library–conjugated beads, and aptamer spl3c–conjugated beads, respectively. Samples were stained with a CKAP4 antibody. (E) Knockdown of CKAP4 in BLCA 5637 cells. (Upper) The CKAP4 level, as determined by Western blot, and (Lower) the corresponding quantification. NC, negative control; GAPDH, glyceraldehyde-3-phosphate dehydrogenase. (F) The binding of spl3c to CKAP4-depleted cells. NC, shCKAP4 1 and shCKAP4 2 were marked as blue, red and gray, respectively. (G) Overexpression of CKAP4 in 5637 cells. (Upper) The CKAP4 level, as determined by Western blot, and (Lower) the corresponding quantification. (H) Binding of spl3c to the CKAP4-up-regulated cells where vector and overexpression are marked as light blue and green, respectively. (I) CKAP4 expression level in various cell lines. Data were acquired by Western blot. (J) Correlation of spl3c binding level and CKAP4 level in various cancer cells. (K) Simulation of binding modes between spl3c and CKAP4. (L) Simulated binding sites between spl3c and CKAP4. Three representative binding sites were enlarged and are marked as 1, 2, and 3.
Fig. 3.
Fig. 3.
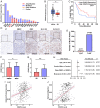
The high expression of CKAP4 is associated with BLCA malignancy. (A) CKAP4 gene alteration frequency in pan-cancers from cBioPortal database. At least 200 cases were included in each type of cancer. UCS, uterine carcinosarcoma; SKCM, skin cutaneous melanoma; LUAD, lung adenocarcinoma; BLCA, bladder cancer; PRAD, prostate adenocarcinoma; OV, ovarian serous cystadenocarcinoma; LUSC, lung squamous cell carcinoma; LAML, acute myeloid Leukemia; GBM, glioblastoma multiforme; COAD, colon adenocarcinoma; HNSC, head and neck squamous cell carcinoma; KIRP, kidney renal papillary cell carcinoma; BIDC, breast invasive ductal carcinoma; BILC, breast invasive lobular carcinoma; LIHC, liver hepatocellular carcinoma; KIRC, kidney renal clear cell carcinoma. (B) CKAP4 expression level in BLCA (404 cases) and NT (28 cases) from the Gepia2 database (mean ± SEM, **P < 0.01, followed by unpaired Student’s t test). NT, normal tissue. (C) Kaplan-Meier curve in BLCA patients with different levels of CKAP4 from the Timer2.0 database, from which follow-up extended up to 100 mo with a split expression percentage of 15%. P < 0.01 was calculated by unpaired Student’s t test. (D) Representative IHC staining images of CKAP4 level in NT and NMIBC, MIBC, T2 non-lymph-node metastasis (N), and lymph node metastasis (N+) tissues. (Scale bar: 100 μm.) MIBC, muscle invasive bladder cancer; NMIBC, nonmuscle invasive bladder cancer. (E) Number of CKAP4 up-regulated tumor samples compared with those of NT. If the score of the tumor tissue was higher than that of normal tissues, then it was defined as T > NT; otherwise the score was defined as T ≤ NT. NT, normal tissue; T, tumor tissue. (F) CKAP4 level in BLCA samples of NMIBC and MIBC (mean ± SEM, *P < 0.05; unpaired Student’s t test). (G) CKAP4 level in nonmetastatic (N0) and metastatic (N1–N2) BLCA in stage T2 (mean ± SEM, *P < 0.01; unpaired Student’s t test). (H) Forest plot shows the differential CKAP4 expression level. FC, fold change. (I) Association of CKAP4 level with hallmark protein secretion from GSEA database (P = 8.6 × 10⁹; Pearson correlation test). (J) Association of CKAP4 level with hallmark migration from GSEA database (P = 6.7 × 10¹⁶; Pearson correlation test).
Fig. 4.
Fig. 4.
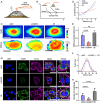
CKAP4 orchestrates the central-peripheral gradient of cell stiffness. (A) Scheme represents the measurement of cell surface stiffness by AFM. (B) Force curves from AFM show the typical mechanical features of soft or stiff cell sample. (C) Height (Upper) and surface stiffness (Lower) of BLCA 5637 shNC, shCKAP4, and CKAP4 overexpressing (OE) cells. (Scale bar: 10 μm.) (D) Surface stiffness of BLCA 5637 shNC, shCKAP4, and CKAP4 OE cells across the indicated line in C. (E) Stiffness gradient of BLCA 5637 shNC, shCKAP4, and CKAP4 OE cells (mean ± SEM, n > 10 cells, **P < 0.01; ****P < 0.0001; unpaired Student’s t test). (F) Surface height of BLCA 5637 shNC, shCKAP4, and CKAP4 OE cells across the indicated line in C. (G) CKAP4 expression level and F-actin in BLCA 5637 shNC, shCKAP4, and CKAP4 OE cells. CKAP4 was evaluated by antibody, and the nuclei were stained with Hoechst. (Scale bar: 20 μm.) (H) Quantification of lammellipodia of cells (mean ± SEM, n > 20 cells, ****P < 0.0001; unpaired Student’s t test).
Fig. 5.
Fig. 5.
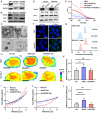
Exosomal CKAP4 enhances the central-peripheral gradient of cell stiffness. (A) CKAP4 level in BLCA 5637 shNC, SV-HUC-1 cells, and shCKAP4. (B) CKAP4 level in BLCA 5637 shNC-, SV-HUC-1-, and shCKAP4-derived exosomes. CD81 and ALIX were used as biomarkers of the exosomes. (C) Transmission electron microscopy (TEM) images of exosomes isolated from BLCA 5637 shNC and shCKAP4 cells (Upper); labeling of BLCA 5637 shNC and shCKAP4 exosomes with spl3c-conjugated 5 nM gold nanoparticles (Lower). (Scale bar: 100 nM.) (D) CKAP4 level of cells treated with or without BLCA 5637 shNC exosomes by Western blot. (E) Surface CKAP4 level of BLCA 5637 and SV-HUC-1 cells treated with or without BLCA 5637 shNC exosomes is identified with FITC-labeled spl3c using fluorescence correlation spectroscopy. (F) Fluorescence level of BLCA 5637 and SV-HUC-1 cells after treatment with 5637 exosomes (nFL-Exo) or GFP-CKAP4-expressing 5637 exosomes (FL-Exo) using confocal microscopy. (Scale bar: 20 μm.) GFP, green fluorescent protein. (G) Fluorescence level of 5637 and SV-HUC-1 cells after treated with nFL-Exo or FL-Exo by flow cytometry. (H) Surface stiffness of BLCA 5637 cells (Upper) and SV-HUC-1 cells (Lower) treated with or without exosomes. Representative images are shown. (Scale bar: 10 μm.) (I and J) Surface stiffness of BLCA 5637 (I) and SV-HUC-1 (J) cells across the indicated line in H. (K and L) Stiffness gradient of BLCA 5637 (K) and SV-HUC-1 (L) cells (mean ± SEM; n > 10 cells; ns, not significant; *P < 0.05; ****P < 0.0001; unpaired Student’s t test).
Fig. 6.
Fig. 6.
Cell motility and cell migration are promoted by cellular and exosomal CKAP4. (A) Single-cell motility of 5637 NC, 5637 shCKAP4 cells, and SV-HUC-1 cells, as well as the influence of the CKAP4-harboring and CKAP4-depleted 5637 exosomes. Each circle-shaped contour represents the movement of a cell in 10 min. (Scale bar: 20 μm.) (B) Trajectory trace analysis of 5637 NC, 5637 shCKAP4 cells, and SV-HUC-1 cells, as well as the influence of CKAP4-harboring and CKAP4-depleted 5637 exosomes. (C) Motility of cells measured in the time scale of 1h (mean ± SEM; n > 30 cells; ns, not significant; **P < 0.01, ****P < 0.0001; unpaired Student’s t test). (D and E) Wound healing assay of 5637 NC and shCKAP4 cells, as well as the effect of CKAP4-bearing and CKAP4-depleted 5637 exosomes (mean ± SEM, n = 3 independent experiments, *P < 0.05; unpaired Student’s t test). (F and G) Trans-well assay of 5637 NC and shCKAP4 cells, as well as the effect of CKAP4-bearing and CKAP4-depleted 5637 exosomes (mean ± SEM, n = 3 independent experiments, ***P < 0.001; unpaired Student’s t test).
Fig. 7.
Fig. 7.
CKAP4 promotes the metastasis of BLCA cells. (A) Time schedule of intravenous injection of cells (I) and exosomal pretreated cells (II) into mice and subsequent analysis at 8 wk postinjection. (B) Cellular data for intravenous injection in mice. Groups i and ii were not treated with exosomes; groups iii–vi were pretreated with 5637 shNC or shCKAP4 exosomes. (C) The liver metastasis of cells in B was determined by H&E, Ki-67, and CKAP4 staining. Representative images of three independent experiments are shown. (Scale bar: 1 mm.) (D) The average number of liver metastatic nodules. (E) The Ki-67 score of liver metastatic nodules. (F) The CKAP4 score of liver metastatic nodules (mean ± SEM, n = 3 independent experiments, *P < 0.05; **P < 0.01; ***P < 0.001; ****P < 0.0001; unpaired Student’s t test). (D–F) blue and red bars represent BLCA 5637 shNC and shCKAP4 cells, respectively; black grids refer to BLCA 5637 cells pre-treated with BLCA 5637 shNC and shCKAP4 exosomes, respectively; and white grids refer to BLCA 5637 shCKAP4 cells pretreated with BLCA 5637 shNC and shCKAP4 exosomes, respectively.

Comment in

  • Uro-Science.
    Atala A. Atala A. J Urol. 2022 Dec;208(6):1340-1342. doi: 10.1097/JU.0000000000002980. Epub 2022 Sep 26. J Urol. 2022. PMID: 36154669 No abstract available.

References

    1. Stuelten C. H., Parent C. A., Montell D. J., Cell motility in cancer invasion and metastasis: Insights from simple model organisms. Nat. Rev. Cancer 18, 296–312 (2018). - PMC - PubMed
    1. Dillekås H., Rogers M. S., Straume O., Are 90% of deaths from cancer caused by metastases? Cancer Med. 8, 5574–5576 (2019). - PMC - PubMed
    1. Fletcher D. A., Mullins R. D., Cell mechanics and the cytoskeleton. Nature 463, 485–492 (2010). - PMC - PubMed
    1. van Helvert S., Storm C., Friedl P., Mechanoreciprocity in cell migration. Nat. Cell Biol. 20, 8–20 (2018). - PMC - PubMed
    1. Massou S., et al. , Cell stretching is amplified by active actin remodelling to deform and recruit proteins in mechanosensitive structures. Nat. Cell Biol. 22, 1011–1023 (2020). - PubMed