. 2022 Apr 19;119(16):e2112482119.
doi: 10.1073/pnas.2112482119. Epub 2022 Apr 11.

MicroRNA networks in FLT3-ITD acute myeloid leukemia

Affiliations

MicroRNA networks in FLT3-ITD acute myeloid leukemia

Dinh Hoa Hoang et al. Proc Natl Acad Sci U S A. .

Abstract

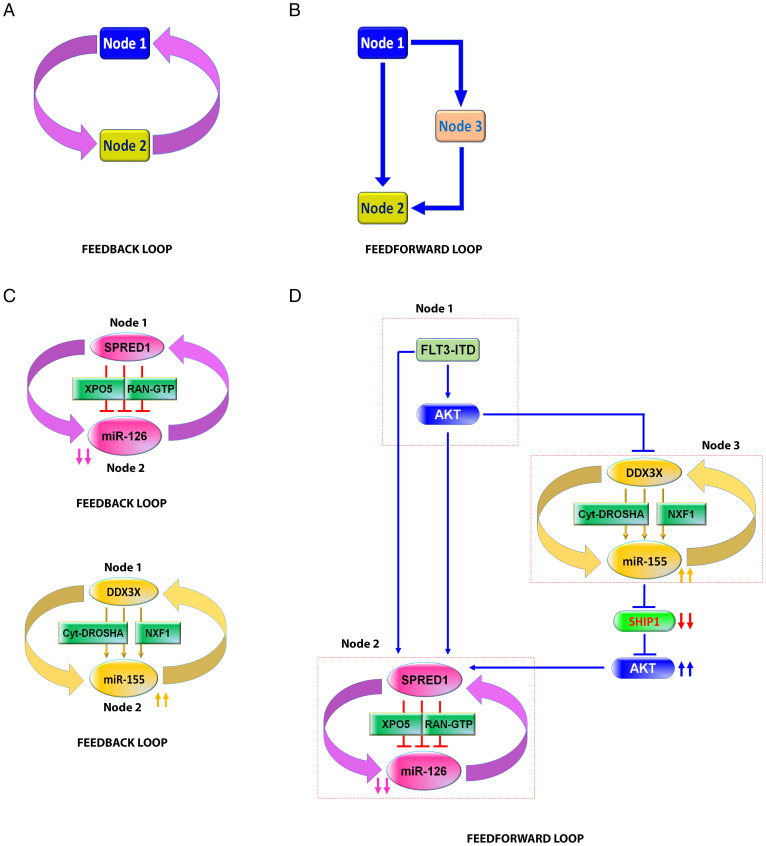
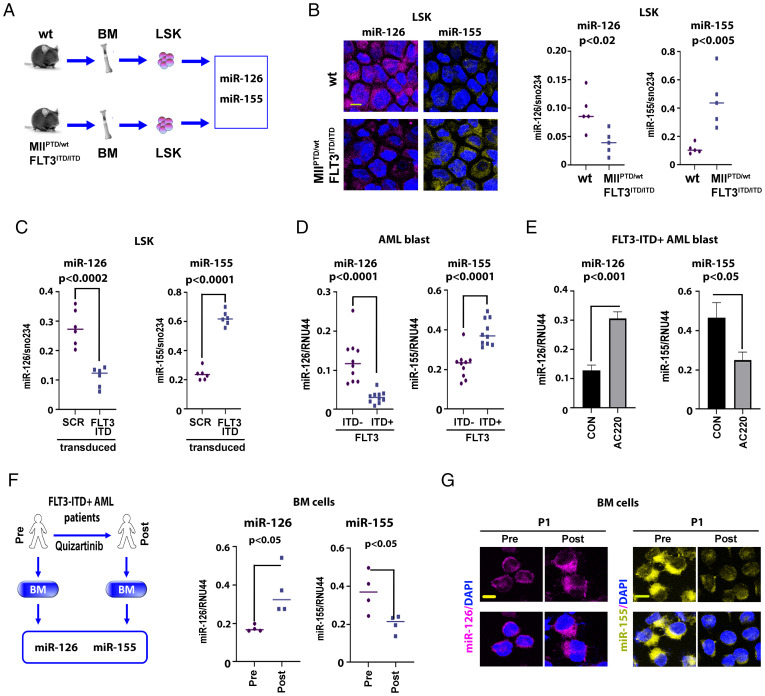
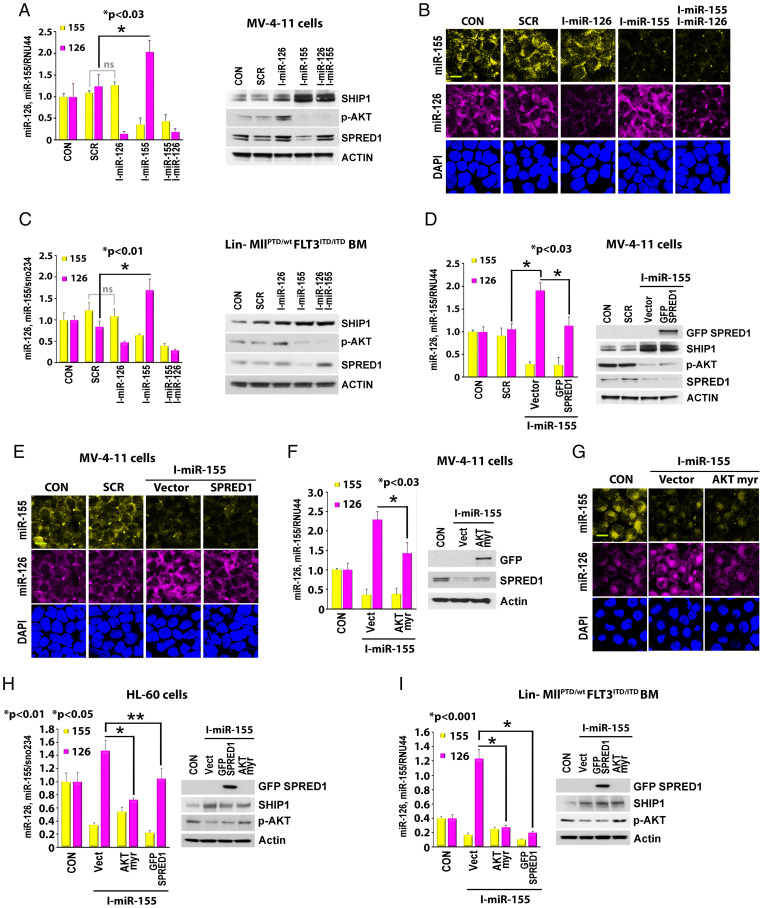
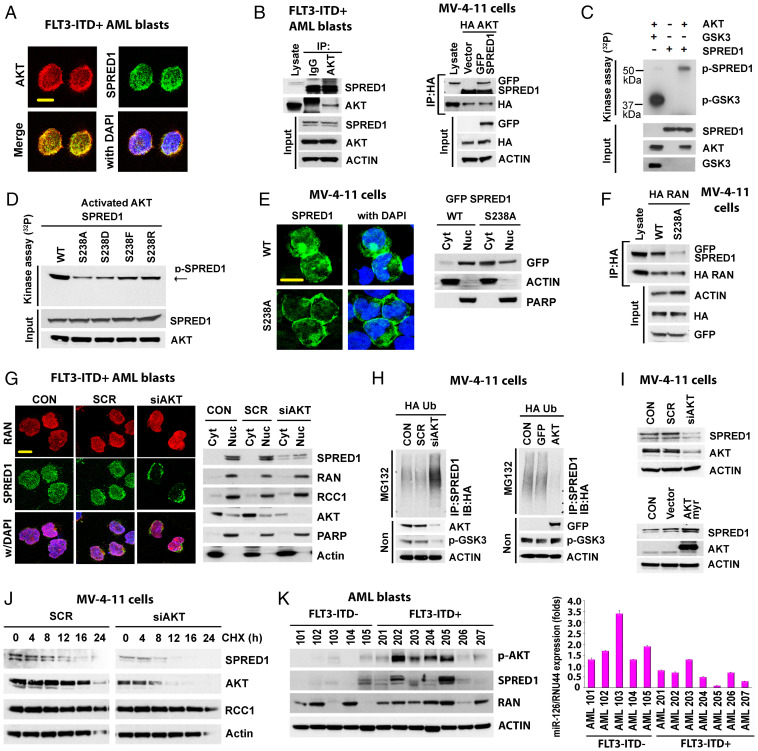
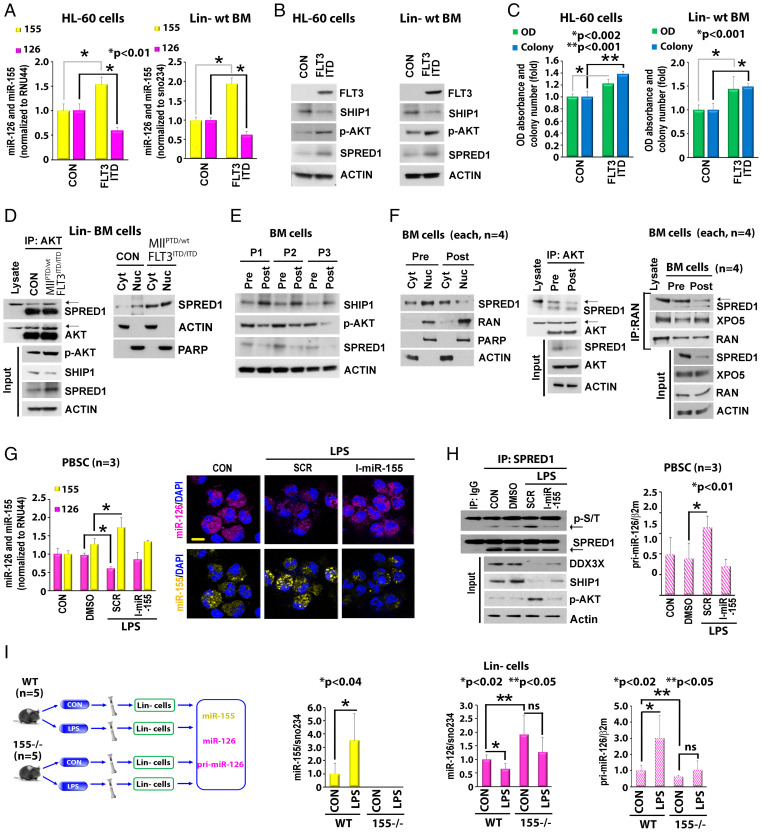
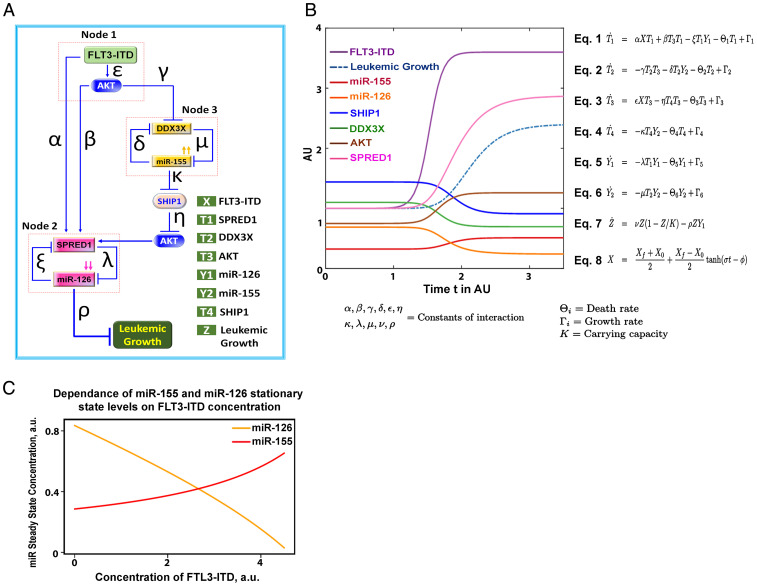
MiR-126 and miR-155 are key microRNAs (miRNAs) that regulate, respectively, hematopoietic cell quiescence and proliferation. Herein we showed that in acute myeloid leukemia (AML), the biogenesis of these two miRNAs is interconnected through a network of regulatory loops driven by the FMS-like tyrosine kinase 3-internal tandem duplication (FLT3-ITD). In fact, FLT3-ITD induces the expression of miR-155 through a noncanonical mechanism of miRNA biogenesis that implicates cytoplasmic Drosha ribonuclease III (DROSHA). In turn, miR-155 down-regulates SH2-containing inositol phosphatase 1 (SHIP1), thereby increasing phosphor-protein kinase B (AKT) that in turn serine-phosphorylates, stabilizes, and activates Sprouty related EVH1 domain containing 1 (SPRED1). Activated SPRED1 inhibits the RAN/XPO5 complex and blocks the nucleus-to-cytoplasm transport of pre-miR-126, which cannot then complete the last steps of biogenesis. The net result is aberrantly low levels of mature miR-126 that allow quiescent leukemia blasts to be recruited into the cell cycle and proliferate. Thus, miR-126 down-regulation in proliferating AML blasts is downstream of FLT3-ITD–dependent miR-155 expression that initiates a complex circuit of concatenated regulatory feedback (i.e., miR-126/SPRED1, miR-155/human dead-box protein 3 [DDX3X]) and feed-forward (i.e., miR-155/SHIP1/AKT/miR-126) regulatory loops that eventually converge into an output signal for leukemic growth.

Keywords: AKT; FLT3-ITD; acute myeloid leukemia; miR-126; miR-155.


Conflict of interest statement

The authors declare no competing interest.

Figures

Fig. 1.
Fig. 1.
Schematic models of FLT3-ITD–regulated miR-126 and miR-155 expression through feedback and feed-forward loops network. (A and B) Examples of feedback (A) and feed-forward (B) loops. (C) Top, a feedback loop of miR-126 and SPRED1. Bottom, a feedback loop of miR-155 and DDX3X. (D) Feed-forward loop of FLT3-ITD–regulated miR-126 expression through miR-155/SHIP1/AKT axis. Node 1, FLT3-ITD/AKT; node 2, SPRED1/miR-126; node 3, DDX3X/miR-155. GTP, guanosine-5'-triphosphate.
Fig. 2.
Fig. 2.
FLT3-ITD concurrently regulates miR-126 and miR-155 expression. (A and B) MiR-126 and miR-155 expression in LSK population from wt vs. MllPTD/wt/Flt3ITD/ITD AML mice. (A) Experimental design. (B, Left), representative images of cell staining with miR-126 and miR-155 SmartFlare probes. Right, miRNA expression was measured by qPCR (each group, n = 5). (C) LSK cells from wt mouse (n = 6) transduced with scramble control (SCR) or FLT3-ITD (FLT3) lentivirus vectors. Mir-126 (Left) and miR-155 (Right) expression levels were measured by qPCR at 48 h. (D) miR-126 (Left) and miR-155 (Right) expression in FLT3-ITD+ vs. FLT3-ITD− AML patients in BM primary CD34+ blasts. (E) miR-126 (Left) and miR-155 (Right) expression in CD34+ blasts from FLT3-ITD+ AML patients (n = 3) treated ex vivo with DMSO (CON) or the tyrosine kinase inhibitor AC220 (20 nM) measured by qPCR. (F and G) Effects of AC220 on miR-126 and miR-155 levels in vivo. (F, Left) In vivo experimental design. The BM cells from FLT3-ITD+ AML patients pre- or posttreated with AC220 (n = 4) were collected to analyze as indicated. Right, miR-126 and miR-155 expression levels were measured by qPCR. Individual value of miR-126 and miR-155 levels is shown in SI Appendix, Fig. S2. (G) Representative images of cell staining with miR-126 and miR-155 SmartFlare probes. More staining images of different samples are shown in SI Appendix, Fig. S2 (Scale bar, 10 μm).
Fig. 3.
Fig. 3.
Regulation of miR-126 by miR-155. (A–C) Effects of miR-155 inhibition on SHIP1/p-AKT/SPRED1 signaling and miR-126 expression. MV-4–11 cells (A and B) or Lin− BM cells from MllPTD/wt/Flt3ITD/ITD AML mice (C) were treated with either miR-126 inhibitor, miR-155 inhibitor alone, or combination for 24 h. (A and C) Left, expression levels of miR-126 and miR-155 by qPCR. Right, cell lysate was immunoblotted with indicated antibodies. (*, P value.) (B) Representative images of cell staining with miR-126 and miR-155 SmartFlare probes. (D–I) Effects of SPRED1 and AKT-myr overexpression (OE) on miR-155–regulated miR-126 expression. MV-4–11 cells (D–G), HL-60 cells (H), and Lin− BM cells from MllPTD/wt/Flt3ITD/ITD AML mice (I) were treated with miR-155 inhibitor in the presence or absence of SPRED1 or AKT-myr OE. (D, F, H, and I) Left, expression levels of miR-126 and miR-155 by qPCR. Right, cell lysate was immunoblotted with indicated antibodies. (*, P value.) (E and G) Representative images of cell staining with miR-126 and miR-155 SmartFlare probes (Scale bar, 10 μm).
Fig. 4.
Fig. 4.
AKT regulates SPRED1 phosphorylation and stability. (A and B) Colocalization and interaction of AKT and SPRED1. (A) FLT3-ITD+ AML blasts were stained with anti-AKT and anti-SPRED1 antibodies (Scale bar, 10 μm). (B) Left, protein lysate from FLT3-ITD+ AML blasts (n = 3) was immunoprecipitated with anti-IgG or anti-AKT antibody and immunoblotted with anti-SPRED1 antibody. Right, MV-4–11 cells were transfected with hemagglutinin (HA)-AKT and GFP-SPRED1 and immunoprecipitation and immunoblotting were performed as shown. (C) SPRED1 phosphorylation by AKT. Cell-free in vitro kinase phosphorylation assay using recombinant proteins of AKT, glycogen synthase kinase-3 (GSK3), and SPRED1 protein. AKT-phosphorylated GSK3 was used as a positive control for the phosphorylation assay. (D) AKT-phosphorylated SPRED1 at S238. Cell-free in vitro phosphorylation using recombinant proteins of AKT with SPRED1 wt or indicated mutation of SPRED1 at S238. (E) Cellular distribution of SPRED1 WT and SPRED1 S238A (non-AKT-phosphorylated mutation) in MV-4–11 cells. Left, representative images of cells overexpressed with SPRED1 wt or S238A (Scale bar, 10 μm). Right, indicated transfected cells were fractionated and immunoblotted with indicated antibodies. (F) Interaction between SPRED1 wt and SPRED1 S238A with RAN. MV-4–11 cells were transfected with HA-RAN and GFP-SPRED1 wt or GFP-SPRED1 S238A. Immunoprecipitation and immunoblotting as shown. (G) Effects of AKT KD on SPRED1 localization. MV-4–11 cells were transfected with scrambled control siRNA (siSCR) or AKT siRNA (siAKT) for 24 h. Left, transfected cells were stained with anti-RAN and anti-SPRED1 antibodies; representative images are shown (Scale bar, 10 μm). Right, fractionated lysate of transfected cells was immunoblotted with indicated antibody. PARP, Poly (ADP-ribose) polymerase; Cyt, Cytoplasm; Nuc, Nucleus; RCC1, Regulator Of Chromosome Condensation 1; (H) Effect of AKT KD and OE on SPRED1 ubiquitination. MV-4–11 cells were cotransfected with HA-ubiquitin and siSCR or siAKT (Left) and green fluorescent protein (GFP) vector or GFP-AKT (Right) for 24 h. Ubiquitination assay was performed with anti-SPRED1, anti-GFP, and anti-HA-ubiquitin antibodies. (I) Effect of AKT KD and OE on protein stability of SPRED1. MV-4–11 cells were transfected with siSCR and siAKT (Top) or HA vector control and HA-AKT (Bottom) for 24 h. Lysate from indicated transfected cells was immunoblotted with anti-SPRED1, anti-AKT, anti-HA, and anti-actin antibodies. (J) Effect of AKT KD on SPRED1 protein stability. MV-4–11 cells were transfected with siSCR or siAKT for 24 h. The cells were then treated with cycloheximide (CHX) (10 μM) for the indicated times and lysate was immunoblotted with indicated antibodies. (K) Expression levels of miR-126, p-AKT, and SPRED1 protein in FLT3-ITD- and FLT3-ITD+ primary AML blasts. Left, the cell lysate of each sample was immunoblotted with anti-SPRED1, anti-p-AKT, anti-RAN, and anti-actin antibodies. Right, levels of miR-126 as measured by qPCR. MG132, proteasome inhibitor MG132.
Fig. 5.
Fig. 5.
Regulation of miR-126 by miR-155 in Lin− BM cells from wt vs. MllPTD/wt/Flt3ITD/ITD AML mice and in normal cells. (A–C) Effects of FLT3-ITD overexpression on miR-155–regulated miR-126 through SHIP1/p-AKT/SPRED1 axis in FLT3-ITD− HL-60 cells and Lin− BM cells from wt mice. HL-60 cells (Left) and Lin− BM cells from normal wt mice (Right) were infected with FLT3-ITD lentiviruses for 48 h. (A) Levels of miR-126 and miR-155 by qPCR. (*, P value.) (B) Levels of SHIP1, p-AKT, and SPRED1 by immunoblotting. (C) Levels of proliferation and colony formation. (*, P value.) (D) Different levels of AKT/SPRED1 interaction and SPRED1 distribution in Lin− BM cells isolated from wt vs. MllPTD/wt/Flt3ITD/ITD AML mice. Left, interaction between AKT and SPRED1. Right, cellular distribution of SPRED1. (E and F) Regulation of SHIP1/p-AKT/SPRED1 and SPRED1/RAN/XPO5 signaling in AC220 pre- and posttreated cells. The BM cells from FLT3-ITD+ AML patients pre- or posttreated with AC220 (n = 4) were collected to analyze as indicated. Left, levels of SHIP1, p-AKT, and SPRED1 by immunoblotting. Middle, interaction between AKT and SPRED1. Right, interaction of SPRED1/RAN and RAN/XPO5. (G and H) Effects of LPS on miR-155 and miR-126 expression in normal peripheral blood stem cells (PBSC). The cells were treated with LPS in the presence of SCR control or miR-155 inhibitor for 24 h. (G) Levels of miR-126 and miR-155 expression (Left) and miR-126 and miR-155 staining (Right) (Scale bar, 10 μm). (*, P value.) (H) Left, levels of SPRED1 phosphorylation and expression of DDX3X, SHIP1, and p-AKT protein. Right, levels of pri-miR-126 expression. (*, P value.) (I) Left, in vivo experimental design. The wt or miR-155 KO mice were treated with vehicle or LPS for 24 h (each group, n = 5). The Lin− stem-progenitor cell population from BM was isolated to analyze as indicated. Middle and Right, effects of LPS on miR-155 and miR-126 expression in Lin− cells. Middle, levels of miR-155. Right, levels of miR-126 and pri-miR-126. Ns indicates nonsignificance. (*, P value.) RNU44, small-nucleolar RNA RNU44; sno234, small control RNA sno234; OD, optical density.
Fig. 6.
Fig. 6.
Mathematical model of FLT3-ITD–regulated miR-126 and miR-155. (A) Schematic representation of a mathematical model of how FLT3-ITD controls the dynamics of miR-126/miR-155 circuit. (B) The mathematical model parameters are defined as follows: K is the carrying capacity of AML growth and Θi and Γi (where the index i = 1,2,…,6) are the degradation and production rates, respectively. The parameters α, β, γ, δ, ε, η, κ, λ, μ, ν, and ρ are constants that quantify the interaction between variables. Newton’s notation is used to indicate differentiation with respect to time (˙=ddt). Time and concentration are scaled and shown in arbitrary units (AU). The activation of FLT3-ITD (X) from an initial value X0 to a final value Xf is modeled by Eq. 8, in which σ represents the velocity at which activation of FLT3-ITD occurs and ϕ determines the time when the activation takes place. (C) Levels of miR-126 (yellow) and miR-155 (red) at the stationary states are obtained by numerically solving the system of ordinary differential equations for increasing levels of FLT3-ITD. Numerical integration of the mathematical model in B and C is shown with a particular set of estimated values for many unknown parameters.

References

    1. Ha M., Kim V. N., Regulation of microRNA biogenesis. Nat. Rev. Mol. Cell Biol. 15, 509–524 (2014). - PubMed
    1. Garzon R., et al. , Distinctive microRNA signature of acute myeloid leukemia bearing cytoplasmic mutated nucleophosmin. Proc. Natl. Acad. Sci. U.S.A. 105, 3945–3950 (2008). - PMC - PubMed
    1. Marcucci G., et al. , MicroRNA expression in cytogenetically normal acute myeloid leukemia. N. Engl. J. Med. 358, 1919–1928 (2008). - PubMed
    1. Liao Q., Wang B., Li X., Jiang G., miRNAs in acute myeloid leukemia. Oncotarget 8, 3666–3682 (2017). - PMC - PubMed
    1. Anastasiadou E., Jacob L. S., Slack F. J., Non-coding RNA networks in cancer. Nat. Rev. Cancer 18, 5–18 (2018). - PMC - PubMed

MeSH terms