. 2022 Apr 19;119(16):e2020242119.
doi: 10.1073/pnas.2020242119. Epub 2022 Apr 11.

Rotational dynamics and transition mechanisms of surface-adsorbed proteins

Affiliations

Rotational dynamics and transition mechanisms of surface-adsorbed proteins

Shuai Zhang et al. Proc Natl Acad Sci U S A. .

Abstract

Assembly of biomolecules at solid–water interfaces requires molecules to traverse complex orientation-dependent energy landscapes through processes that are poorly understood, largely due to the dearth of in situ single-molecule measurements and statistical analyses of the rotational dynamics that define directional selection. Emerging capabilities in high-speed atomic force microscopy and machine learning have allowed us to directly determine the orientational energy landscape and observe and quantify the rotational dynamics for protein nanorods on the surface of muscovite mica under a variety of conditions. Comparisons with kinetic Monte Carlo simulations show that the transition rates between adjacent orientation-specific energetic minima can largely be understood through traditional models of in-plane Brownian rotation across a biased energy landscape, with resulting transition rates that are exponential in the energy barriers between states. However, transitions between more distant angular states are decoupled from barrier height, with jump-size distributions showing a power law decay that is characteristic of a nonclassical Levy-flight random walk, indicating that large jumps are enabled by alternative modes of motion via activated states. The findings provide insights into the dynamics of biomolecules at solid–liquid interfaces that lead to self-assembly, epitaxial matching, and other orientationally anisotropic outcomes and define a general procedure for exploring such dynamics with implications for hybrid biomolecular–inorganic materials design.

Keywords: Levy-flight transition; high-speed atomic force microscopy; machine learning; orientational energy landscapes; rotational dynamics of protein.


Conflict of interest statement

The authors declare no competing interest.

Figures
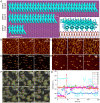
Fig. 1.
Fig. 1.
Overview of design and in-plane dynamics of MicaN on m-mica (001). (A) Models of MicaN (N= 34, 18, and 6) on m-mica (001). The purple spheres indicate K+ sublattice, occupying the negatively charged sites on m-mica (001). Inset shows the side view of Mica6 on m-mica (001) with glutamate side chains interacting with the K+ sublattice. (Scale bar: 5 nm.) (BE) Selected frames of four consecutive HS-AFM datasets, representing the in-plane dynamics of MicaN (N = 18, 34, and 6) with 10 mM KCl and Mica18 with 10 mM NaCl on m-mica (001), respectively. (Scale bars: 50 nm.) (F) Selected frames tracking Mica18 with 10 mM KCl on m-mica (001). (G) Direction tracking of the selected Mica18 molecules in F. The arrows in the upper right corners indicate the dominated orientations of MicaN in each dataset. The times in the upper right corners indicate the relative capturing time of each frame in the corresponding dataset. All solutions are buffered with 20 mM Tris (pH 7). The frame speeds are 0.92 Hz.
Fig. 2.
Fig. 2.
Orientation distributions and relative energy landscapes, G(θ), of MicaN. Accumulated orientation distributions over time (histograms) and corresponding derived relative energy landscapes, G(θ) (colored curves; Upper) (details are in SI Appendix), and instant orientation distribution at each time step (Lower) are visualized for (A) Mica18@KCl10mM, (B) Mica34@KCl10mM, (C) Mica6@KCl10mM, and (D) Mica18@NaCl10mM. The orientation distributions are computed from extracted region properties of the instance segmentation. These distributions are normalized relative to the largest numbers in the histograms. The choice of θ = 0 represents horizontal with respect to the image orientation but is arbitrary with respect to the orientation of the m-mica (001) lattice. The orientation range is 180° and centered at the largest minima in each dataset. There is no correlation between the angles (and hence, the states) of different datasets.
Fig. 3.
Fig. 3.
Trajectory heat maps, degree quantized transition tables, and Markov chain models of MicaN. A, Upper shows G(θ) of Mica18@KCl10mM with two selected cases (A, i and ii in Lower) at different orientations. A, Lower shows the corresponding heat maps of orientation distribution evolution as a function of elapsed time. (B) The 3° state transition table of Mica18@KCl10mM. (C) The state transition probability table of Mica18@KCl10mM constructed for 3° increments in orientation. The upper histogram shows the computed probability (P) to enter each state from any other state [i.e., P(St+1 = X|StX)]. The right histogram shows P of remaining in each state [i.e., P(St+1 = X|St = X)]. Using the peaks and valleys of these two probabilities as marked by the black lines, the orientational states of Mica18@KCl10mM can be split into six states. (D) The six-state matrix derived from C. As in C, the upper histogram shows P(St+1 = X|StX), and the right histogram shows P(St+1 = X|St = X). The lower bar chart shows the ASD of the hidden Markov model. The zoomed-in AFM images show examples of each state. (EG) The Markov models of Mica34@KCl10mM, Mica6@KCl 10 mM, and Mica18@NaCl10mM derived by the same method as in D. (H) The correlation of transition probabilities P(X|X’) and energy barriers in G(θ), GX|X’, of Mica18@KCl10mM, Mica34@KCl10mM, Mica6@KCl10mM, and Mica18@NaCl10mM for transition between adjacent states. There is no correlation between the angles (and hence, the states) of different datasets.
Fig. 4.
Fig. 4.
Trajectories and kMC simulations of rotational dynamics of MicaN. (A) Angular trajectories for three protein nanorods selected from Mica18@KCl10mM experimental (Exp.) data shown in Fig. 1. Continuous trajectories were constructed within the cyclic boundary conditions under the assumption that the trajectory between observations followed the minimum angular path length. (B) Phase-space diagrams of angular velocity vs. angle for the same experimental data of A. (C and D) Corresponding angular trajectories and phase-space plots generated from kMC simulated (Sim.) trajectories of Mica18@KCl10mM. (E) A six-state probability transition table for the Mica18@KCl10mM simulation for comparison with the experimental probability transition table in Fig. 3B. (F) Comparison of state-to-state transition probabilities per experiment vs. kMC simulations. The aggregated data show good 1:1 agreement for transitions between adjacent states (solid markers), but the experimental probability for transition between nonadjacent states (open markers, non-adj.) is significantly higher than in simulation. The black line shows the ideal 1:1 correlation. (G) Jump-size distribution plot. G, Lower plots the normalized frequency of observed jumps as a function of jump size. A key feature is that the experimental data (solid lines) show a power law decay, whereas simulated data (dashed lines) show an exponential decay. As a consequence of the power law decay, the experimental data show more transitions at larger distances than are seen in simulation. Vertical lines in G, Upper (which shares an x axis with G, Lower) mark the characteristic center-to-center distances between pairs of states (in degrees). These state-to-state transitions primarily occur at angular distances greater than 20°, highlighting the fact that the region of power law decay seen in the experimental data corresponds to the larger distances where state-to-state transitions are accessible. Note that discrepancies between the experimental and simulated curves at small angles are due, in part, to the approximate nature of the energy landscape derived from the experiments and the coarse graining of that landscape used in the simulation.

Similar articles

Cited by

  • Diffusion of DNA on Atomically Flat 2D Material Surfaces.
    Shin DH, Kim SH, Coshic K, Watanabe K, Taniguchi T, Verbiest GJ, Caneva S, Aksimentiev A, Steeneken PG, Joo C. Shin DH, et al. ACS Nano. 2025 Jun 17;19(23):21307-21318. doi: 10.1021/acsnano.4c16277. Epub 2025 Jun 5. ACS Nano. 2025. PMID: 40471129 Free PMC article.

References

    1. Moll D., et al. , S-layer-streptavidin fusion proteins as template for nanopatterned molecular arrays. Proc. Natl. Acad. Sci. U.S.A. 99, 14646–14651 (2002). - PMC - PubMed
    1. Kerfeld C. A., et al. , Protein structures forming the shell of primitive bacterial organelles. Science 309, 936–938 (2005). - PubMed
    1. Yeates T. O., Kerfeld C. A., Heinhorst S., Cannon G. C., Shively J. M., Protein-based organelles in bacteria: Carboxysomes and related microcompartments. Nat. Rev. Microbiol. 6, 681–691 (2008). - PubMed
    1. Pfeifer F., Distribution, formation and regulation of gas vesicles. Nat. Rev. Microbiol. 10, 705–715 (2012). - PubMed
    1. Weissbuch I., Addadi L., Lahav M., Leiserowitz L., Molecular recognition at crystal interfaces. Science 253, 637–645 (1991). - PubMed