. 2022 Apr 19;119(16):e2117435119.
doi: 10.1073/pnas.2117435119. Epub 2022 Apr 11.

A molecular complex of Cav1.2/CaMKK2/CaMK1a in caveolae is responsible for vascular remodeling via excitation-transcription coupling

Affiliations

A molecular complex of Cav1.2/CaMKK2/CaMK1a in caveolae is responsible for vascular remodeling via excitation-transcription coupling

Yoshiaki Suzuki et al. Proc Natl Acad Sci U S A. .

Abstract

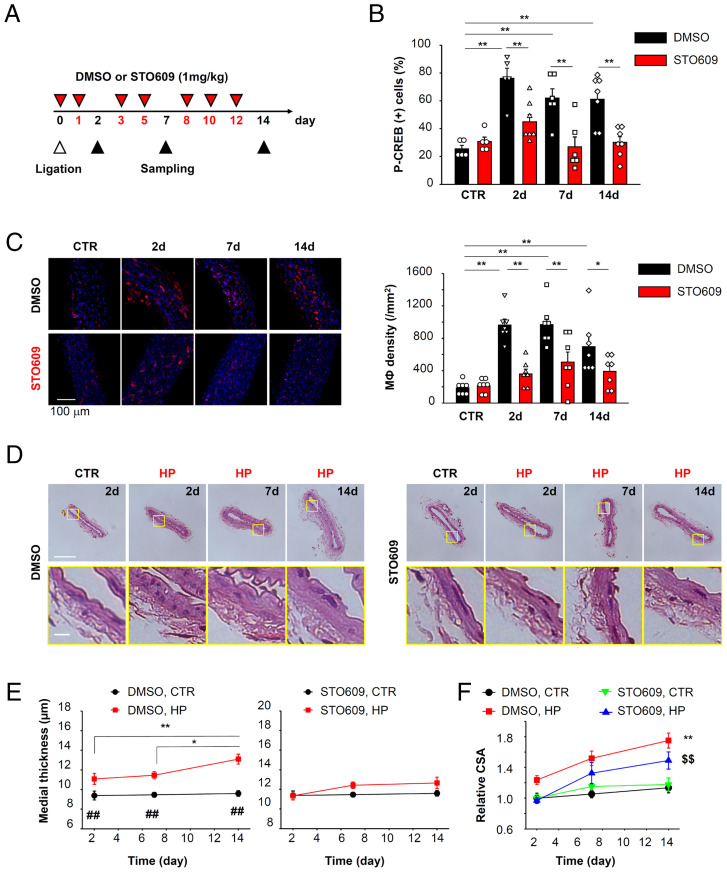
Elevation of intracellular Ca2+ concentration ([Ca2+]i) activates Ca2+/calmodulin-dependent kinases (CaMK) and promotes gene transcription. This signaling pathway is referred to as excitation–transcription (E-T) coupling. Although vascular myocytes can exhibit E-T coupling, the molecular mechanisms and physiological/pathological roles are unknown. Multiscale analysis spanning from single molecules to whole organisms has revealed essential steps in mouse vascular myocyte E-T coupling. Upon a depolarizing stimulus, Ca2+ influx through Cav1.2 voltage-dependent Ca2+ channels activates CaMKK2 and CaMK1a, resulting in intranuclear CREB phosphorylation. Within caveolae, the formation of a molecular complex of Cav1.2/CaMKK2/CaMK1a is promoted in vascular myocytes. Live imaging using a genetically encoded Ca2+ indicator revealed direct activation of CaMKK2 by Ca2+ influx through Cav1.2 localized to caveolae. CaMK1a is phosphorylated by CaMKK2 at caveolae and translocated to the nucleus upon membrane depolarization. In addition, sustained depolarization of a mesenteric artery preparation induced genes related to chemotaxis, leukocyte adhesion, and inflammation, and these changes were reversed by inhibitors of Cav1.2, CaMKK2, and CaMK, or disruption of caveolae. In the context of pathophysiology, when the mesenteric artery was loaded by high pressure in vivo, we observed CREB phosphorylation in myocytes, macrophage accumulation at adventitia, and an increase in thickness and cross-sectional area of the tunica media. These changes were reduced in caveolin1-knockout mice or in mice treated with the CaMKK2 inhibitor STO609. In summary, E-T coupling depends on Cav1.2/CaMKK2/CaMK1a localized to caveolae, and this complex converts [Ca2+]i changes into gene transcription. This ultimately leads to macrophage accumulation and media remodeling for adaptation to increased circumferential stretch.

Keywords: caveolin-1; excitation–transcription coupling; vascular remodeling; vascular smooth muscle cell; voltage-dependent Ca2+ channel.


Conflict of interest statement

The authors declare no competing interest.

Figures

Fig. 1.
Fig. 1.
Ca2+ influx through Cav1.2 channels can cause CREB phosphorylation by activating CaMKK2 and CaMK1a in vascular myocytes. (A) Mesenteric artery myocytes were depolarized for 30 min by applying a 60 mM K+ solution (60K) containing DMSO, 1 μM Nic, or 10 μM Rya. The arteries stained with P-CREB antibody (green) and TO-PRO3 (red) were analyzed using a confocal microscope (Left). In the present study, second- and third-order mesenteric arteries were utilized unless otherwise stated. Smooth muscle nuclei colocalized with P-CREB signals were detected and quantified, and the ratio of P-CREB (+) nuclei to total nuclei was calculated (Right). Data were obtained from 6 to 15 arteries per group. (B) Mesenteric artery was pretreated with EGTA-AM or BAPTA-AM (30 μM) for 45 min, and stimulated using 60 mM K+ solution. Data were obtained from 3 to 16 arteries per group. (C) mRNA levels of CaMK family genes in mesenteric artery. Data were obtained from five mice. (D) Mesenteric arteries were stimulated with 60 mM K+ solution either with or without CaMK inhibitors (30 μM KN93 or 10 μM STO609). Data were obtained from 7 to 20 arteries per group. (E) The amount of P-CREB in mesenteric arteries was quantified using ELISA. The concentration of both P-CREB and total CREB in each arterial lysate were calculated and P-CREB/total CREB ratio was compared. Data were obtained from six mice per group. (F) mRNA levels of CaMK family genes in primary vascular myocytes are shown. Data were obtained from four independent unpassaged cultures. (G) Primary vascular myocytes were treated with siRNA, which targeted CaMKK2 (siK2) or CaMK1a (si1a). The vascular myocytes were preincubated with 5 mM K+ HEPES-buffered solution for 30 min, stimulated with 60 mM K+ solution for 30 min and stained with P-CREB antibody (green) and Hoechst (blue) (Left). The P-CREB (+) nuclei ratio per section (635 μm × 635 μm) is compared (Right). Data were obtained from 24 to 67 sections per group. Statistical analysis was performed using one-way (E and G) or two-way (A, B, and D) ANOVA followed by Dunnett or Tukey tests (**P < 0.01).
Fig. 2.
Fig. 2.
Caveolae promote CREB phosphorylation by enhancing a Cav1.2-CaMKK2 complex. (A) Mesenteric arteries from WT or cav1-KO were stimulated with 60 mM K+ solution for 30 min. MβCD (10 mM) was utilized to disrupt caveolae. Data were obtained from 6 to 15 arteries per group. (B) The amount of P-CREB in mesenteric arteries was quantified using ELISA. The concentration of both P-CREB and total CREB in each arterial lysate were calculated and P-CREB/total CREB ratio was compared. Data were obtained from six mice per group. (C) Primary vascular myocytes from cav1-KO mice transfected with mock (cav1-KO) or cav1 (cav1-KI) were stimulated with 60 mM K+ solution after preincubation with 5 mM K+ solution for 30 min and the P-CREB (+) nuclei ratio was compared (14 to 18 sections per group). (D) Localization of cav1 (green) and CaMKK2 (red), or Cav1.2 (green) and CaMKK2 (red) on the plasma membrane in freshly isolated mesenteric artery myocytes was visualized using a TIRF microscope. TIRF images obtained from the cell regions surrounded by white square in brightfield images are presented. Dashed lines indicate TIRF footprints. Fluorescence puncta from the secondary antibodies (shown as green and red in the images) were converted to binary images and colocalized puncta (shown as yellow) were extracted. The ratio of the number of colocalized puncta to the total number of CaMKK2 puncta (colocalization ratio) is compared. Data were obtained from 10 cells per group. (E) Proximity between cav1-CaMKK2 and Cav1.2-CaMKK2 in mesenteric artery myocytes was determined using a PLA (green). Nuclei were stained with Hoechst (blue, Left). PLA puncta were extracted by binary image processing and the PLA puncta area was normalized to the whole cell area indicated by dashed lines (PLA puncta area fraction, Right). Negative control (NC) data were obtained by treating cells only with anti-CaMKK2 antibody. Data were obtained from 13 to 16 cells per group. Statistical analysis was performed using one-way (B and E) or two-way (A and C) ANOVA followed by Tukey or Dunnett tests and two-tailed t test (D) (*P < 0.05, **P < 0.01).
Fig. 3.
Fig. 3.
Ca2+ signal from Cav1.2 directly activates CaMKK2 within caveolae. (A) A diagram of the experimental design is shown. Primary vascular myocytes were induced to express CaMKK2 labeled with GGECO1.1 at the N terminus (GG-CaMKK2). In B and C, myocytes additionally expressed cav1 tagged with mCherry (mCh-cav1). Ca2+ signal from Cav1.2 to CaMKK2 within the same complex were monitored via changes in GGECO1.1 fluorescence in the presence of the “slow” Ca2+ chelator, 30 μM EGTA. (B) Primary myocytes expressing GG-CaMKK2 and mCh-cav1 were visualized using a TIRF microscope. Representative images of GG-CaMKK2 puncta at rest (i: 5 mM K+) and depolarization phase (ii: 60 mM K+) are shown, Upper Left. A trace of the GGECO1.1 signal (F/F0) is shown, Bottom Left. GG-CaMKK2 (green) and mCh-cav1 (red) puncta at the point of i and ii are shown, Right. Yellow signal in merged images denotes a molecular complex of GG-CaMKK2 and mCh-cav1. (C) The ratio of the colocalized (GG-CaMKK2+mCh-cav1) puncta number to the total GG-CaMKK2 puncta number is compared (left column). Among the colocalized puncta, the ratio of GG-CaMKK2 puncta reacting to 60 mM K+ solution is shown in the right column (positive GG-CaMKK2 puncta ratio). The positive puncta were determined as those whose maximal increase in fluorescence intensity (Fmax) due to the depolarization stimulus was higher than 5× SD of the baseline signal. Data were obtained from 12 cells. (D) Primary myocytes expressing GG-CaMKK2 were stimulated with 60 mM K+ solution with or without 10 μM Nic, or 10 μM BayK8644. The number of GG-CaMKK2 puncta reacting to each stimulus were counted and the ratio to total GG-CaMKK2 puncta within TIRF footprints was calculated (7 to 10 cells). (E) Primary myocytes were preincubated with EGTA-AM or BAPTA-AM, and the ratio of GG-CaMKK2 reacting to 60 mM K+ solution was compared between WT and cav1-KO myocytes (6 to 32 cells). (F) Increase in fluorescence intensity (ΔFmax/F0) of positive GG-CaMKK2 puncta in WT (91 puncta from 32 cells) and cav1-KO (24 puncta from 27 cells) is compared. Statistical analysis was performed using one-way ANOVA followed by Tukey test (D) and two-tailed t test (E and F) (*P < 0.05, **P < 0.01).
Fig. 4.
Fig. 4.
CaMK1a activation and its intranuclear localization depend on both CaMKK2 and caveolae. (A) Confocal images of P-CaMK1a and nuclei in vascular myocytes taken 0, 5, and 30 min after depolarization with 60 mM K+ solution (Left). The P-CaMK1a fluorescence ratio (N/C, nucleus/cytosol) at each time point are compared (Right). Data were obtained from 58, 54, and 36 cells from 6 confocal image sections (215 μm × 215 μm) per group at 0, 5, and 30 min, respectively. (B) Vascular myocytes were challenged with 60 mM K+ solution containing 0 [Ca2+]o (0 Ca) or a CaMKK2 inhibitor STO609 for 30 min, and the N/C ratio of P-CaMK1a intensity was compared (162 to 171 cells per group). Before a depolarizing stimulus, myocytes were pretreated with 5 mM K+ solution containing 0 [Ca2+]o or STO609 for 30 min. (C) The effects of CaMKK2 knockdown on 60 mM K+-induced CaMK1a phosphorylation (200 to 204 cells per group). (D) The effects of cav1-KI on 60 mM K+-induced CaMK1a phosphorylation (169 to 187 cells per group). In B to D, myocytes obtained from nine confocal image sections were analyzed for each group. Statistical analysis was performed using one-way (A and B) or two-way (C and D) ANOVA followed by Tukey test (**P < 0.01).
Fig. 5.
Fig. 5.
Caveolae promote a molecular complex of Cav1.2/CaMK1a/CaMKK2 and full activation of CaMK1a shortly after a depolarizing stimulus. (A) Localization of cav1 and CaMK1a (Left), CaMKK2 and CaMK1a (Center), Cav1.2 and CaMK1a (Right) on the plasma membrane in primary vascular myocytes was visualized using a TIRF microscope. The ratio of the colocalized puncta number to the total CaMK1a puncta number was calculated. Dashed lines indicate TIRF footprints, Data were obtained from 6 to 13 cells. (B) PLA analysis was performed to visualize molecular complex formation of CaMK1a with cav1, CaMKK2, and Cav1.2 in primary myocytes (Left). PLA puncta area was normalized to the whole-cell area indicated by dashed lines (Right). Data were obtained from 15 to 23 cells per group. (C) Spatial and temporal relationships between cav1 and CaMK1a phosphorylation analyzed using a TIRF microscope. Vascular myocytes expressing mCh-cav1 were depolarized for 5 min or 30 min, then fixed and stained with P-CaMK1a antibody. P-CaMK1a, mCh-cav1, and colocalized puncta are shown in green, red, and yellow, respectively. Dashed lines indicate TIRF footprints. (D) The normalized density of P-CaMK1a and mCh-cav1 puncta within the TIRF footprints was plotted against depolarization period. Pooled data were obtained from 10 (0 and 5 min) and 11 (30 min) cells. (E) The ratio of the colocalized puncta number to the total mCh-cav1 puncta number was calculated at each time point. (F) Spatial and temporal relation between CaMKK2 and P-CaMK1a was analyzed. The normalized density of P-CaMK1a and CaMKK2 puncta within the TIRF footprints was plotted against the duration of the depolarization stimulus. Pooled data were obtained from 5 (0 and 30 min) and 12 (5 min) cells. (G) The ratio of the colocalized puncta (P-CaMK1a+CaMKK2) number to the total CaMKK2 puncta number at each time point. (H) The normalized CaMK1a signal density within the TIRF footprints was counted. Cells were treated with DMSO or 10 μM STO609 (7 to 11 cells per group). (I) The colocalization ratio between CaMK1a and cav1 was plotted. Myocytes were treated with DMSO or STO609 (7 to 11 cells per group). (J) Changes in Ca2+ levels in cytosol, nuclei, and whole cell area of primary myocytes transfected with PV-NLS-GFP were recorded using CaSiR/AM. Cells obtained from four confocal image sections (635 μm × 635 μm) were divided to two groups: GFP (black, 56 cells) and GFP+ (green, 50 cells) cells. Myocytes were stimulated with 60 mM K+ solution and peak intensity (ΔFmax) normalized to basal level (F0) is compared. (K) The P-CaMK1a fluorescence ratio (N/C) of myocytes expressing PV-NLS-GFP (indicated by an arrowhead) or not (indicated by an arrow) is compared (41 to 57 cells). Cells were incubated with 5 mM or 60 mM K+ solution for 30 min. Data were obtained from 5 (5K) and 6 (60K) confocal image sections (215 μm × 215 μm). (Scale bar, 10 μm.) (L) The intranuclear P-CREB intensity of myocytes expressing PV-NLS-GFP (arrowhead) or not (arrow) is compared (50 to 65 cells). Data were obtained from 5 (5K) and 8 (60K) confocal image sections (215 μm × 215 μm). (Scale bar, 10 μm.) Statistical analysis was performed using two-tailed t test (A, B, and J) and one-way (D–G) or two-way (H, I, K, and L) ANOVA followed by Tukey test (*P < 0.05, **P < 0.01; ##P < 0.01 vs. DMSO at 30 min).
Fig. 6.
Fig. 6.
Proinflammatory genes are induced by E-T coupling in mesenteric artery. (A) DEG analysis was performed using mesenteric arteries treated with 5 mM or 60 mM K+ solution for 60 min. Detected genes are shown in volcano plots. Red and blue dots denote up-regulated (138 genes) and down-regulated (5 genes) genes, respectively. (B) Top 26 up-regulated genes with log2(fold-change) values more than 2 are listed. Genes predicted to have CRE motif are indicated in the right columns. (C) Gene transcription after sustained depolarization was confirmed by qPCR. Effects of Nic, STO609, KN93, cav1-KO, and MβCD were also examined. Data were obtained five mice per group. Statistical analysis was performed using one-way ANOVA followed by Dunnett test (*P < 0.05, **P < 0.01 vs. WT).
Fig. 7.
Fig. 7.
Pressure loading of mesenteric arteries results in vascular remodeling which can be reversed by cav1-KO. Elevated transluminal pressure (high pressure, HP) was applied to a second-order mesenteric artery in vivo, and tissues were sampled 2, 7, and 14 d after ligation surgery. (A) CREB phosphorylation was evaluated by immunostaining (4 to 10 arteries) in WT and cav1-KO. *P < 0.05, **P < 0.01. (B) CREB phosphorylation in endothelial cells was examined 2 d after ligation in WT (six arteries per group). **P < 0.01. (C) F4/80 (+) macrophages (MФ, red) accumulated in adventitia, media, and intima of WT arteries 2 d after ligation visualized using a confocal microscope (six arteries). Nuclei were stained with Hoechst (blue). **P < 0.01. (D) Accumulation of MФ in adventitia was analyzed in WT and cav1-KO mice (5 to 10 arteries). For each artery, three image sections (215 μm × 215 μm in C and 635 μm × 635 μm in D) were acquired and the calculated MФ density values were averaged. **P < 0.01. (E) Histological analysis performed using H&E-stained samples. (Scale bars, 100 μm [Upper] and 10 μm [Lower].) (F) Media thickness was compared between WT and cav1-KO mice. Pooled data were collected from four to seven arteries. **P < 0.01; ##P < 0.01 vs. WT HP at the same day. (G) Relative CSA of tunica media was compared. **P < 0.01 vs. WT CTR; $$P < 0.01 vs. cav1-KO HP. Statistical analysis was performed using one-way (C) or two-way (A, D, F, and G) ANOVA followed by Tukey test and two-tailed t test (B).
Fig. 8.
Fig. 8.
Vascular remodeling due to pressure loading can be inhibited by the CaMKK2 inhibitor STO609. (A) Mesenteric artery ligation was applied to WT mice and either DMSO or STO609 (1 mg/kg) was administered intraperitoneally as indicated. (B) CREB phosphorylation was evaluated by immunostaining. Data were obtained from five to seven arteries per group. **P < 0.01. (C) F4/80 (+) macrophage (MФ) density at adventitia was compared between mice treated with DMSO and STO609. Data were obtained from seven arteries per group. *P < 0.05, **P < 0.01. (D) Histological analysis performed using H&E-stained samples. (Scale bars, 100 μm [Upper] and 10 μm [Lower]). (E) Medial thickness was measured and compared between DMSO and STO609 groups. Data were collected from five to six arteries. *P < 0.05, **P < 0.01; ##P < 0.01 vs. DMSO HP at the same day. (F) Relative CSA of the tunica media was compared. **P < 0.01 vs. DMSO CTR; $$P < 0.01 vs. DMSO HP. Statistical analysis was performed using two-way ANOVA followed by Tukey test.
Fig. 9.
Fig. 9.
Diagram depicting molecular mechanisms that underlie E-T coupling in vascular myocytes and their roles in vascular remodeling. Caveolae can promote the formation of molecular complexes consisting of Cav1.2, CaMKK2 and CaMK1a in vascular myocytes. Upon stimuli such as depolarization, pressure loading, or neurohumoral factors, Ca2+ influx through Cav1.2 activates CaMKK2 and CaMK1a. Next, CaMKK2 phosphorylates Thr177 of CaMK1a that is localized within caveolae. This triggers translocation of P-CaMK1a to the nucleus, where P-CaMK1a phosphorylates CREB. In vascular myocytes, proinflammatory genes related to chemotaxis, leukocyte adhesion, and inflammation are then activated. The resulting chemokine and adhesion molecule gene products have the ability to enhance the recruitment of macrophages to stimulated regions, where they alter inflammation and subsequent vascular remodeling. In summary, E-T coupling, employing CaMKK2-CaMK1a-CREB pathways, can covert sustained [Ca2+]i elevation into a selective pattern of gene transcription that can promote vascular remodeling.

Comment in

Similar articles

Cited by

References

    1. Berridge M. J., The inositol trisphosphate/calcium signaling pathway in health and disease. Physiol. Rev. 96, 1261–1296 (2016). - PubMed
    1. Ferron L., Koshti S., Zamponi G. W., The life cycle of voltage-gated Ca2+ channels in neurons: An update on the trafficking of neuronal calcium channels. Neuronal Signal. 5, NS20200095 (2021). - PMC - PubMed
    1. Bers D. M., Cardiac excitation-contraction coupling. Nature 415, 198–205 (2002). - PubMed
    1. Jaggar J. H., Porter V. A., Lederer W. J., Nelson M. T., Calcium sparks in smooth muscle. Am. J. Physiol. Cell Physiol. 278, C235–C256 (2000). - PubMed
    1. Suzuki Y., Yamamura H., Ohya S., Imaizumi Y., Caveolin-1 facilitates the direct coupling between large conductance Ca2+-activated K+ (BKCa) and Cav1.2 Ca2+ channels and their clustering to regulate membrane excitability in vascular myocytes. J. Biol. Chem. 288, 36750–36761 (2013). - PMC - PubMed

MeSH terms

Substances