. 2022 Jun;600(12):2853-2875.
doi: 10.1113/JP282828. Epub 2022 Apr 30.

Nerve growth factor transfer from cardiomyocytes to innervating sympathetic neurons activates TrkA receptors at the neuro-cardiac junction

Affiliations

Nerve growth factor transfer from cardiomyocytes to innervating sympathetic neurons activates TrkA receptors at the neuro-cardiac junction

Lolita Dokshokova et al. J Physiol. 2022 Jun.

Abstract

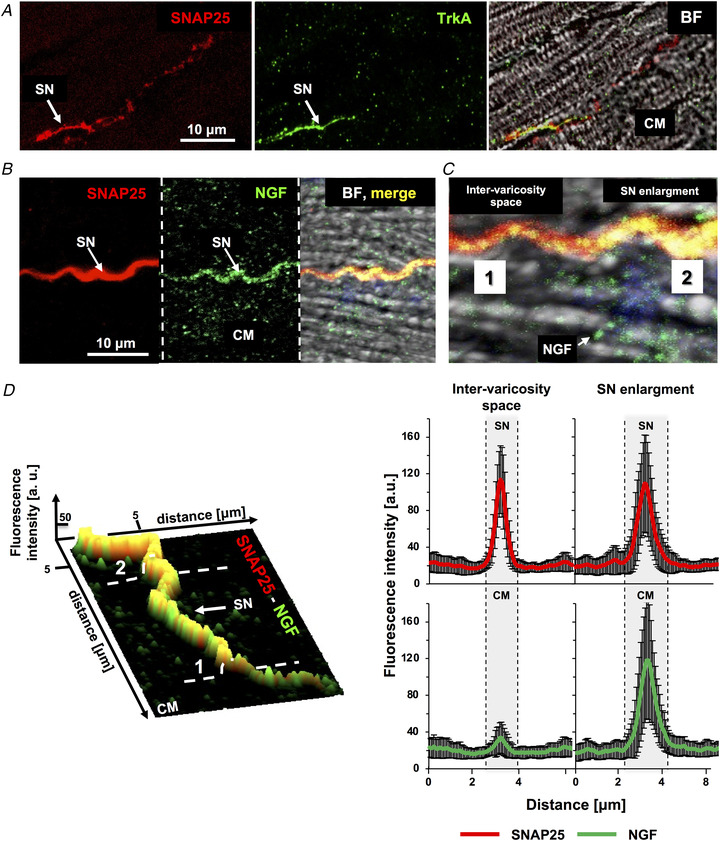
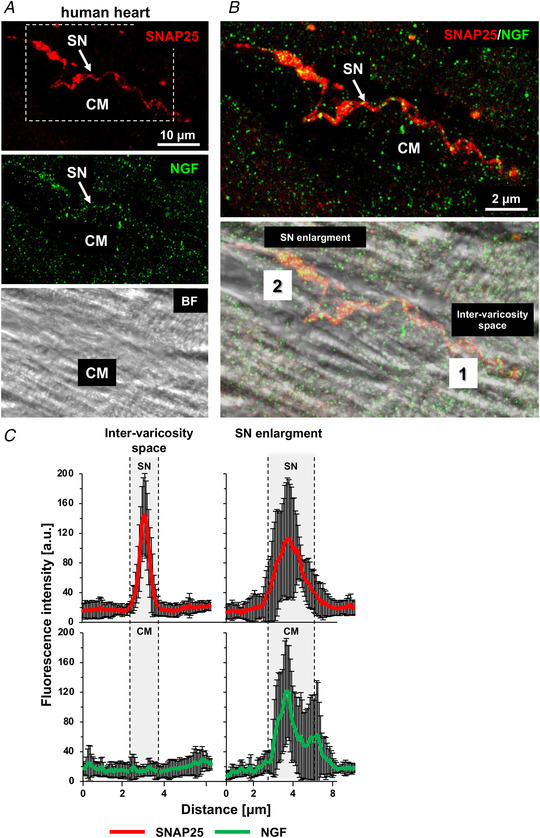
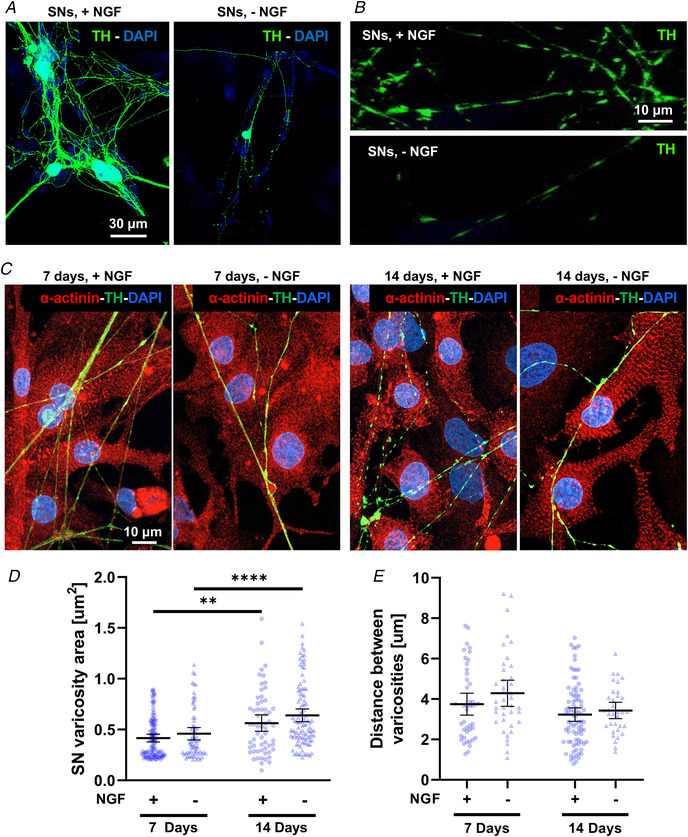
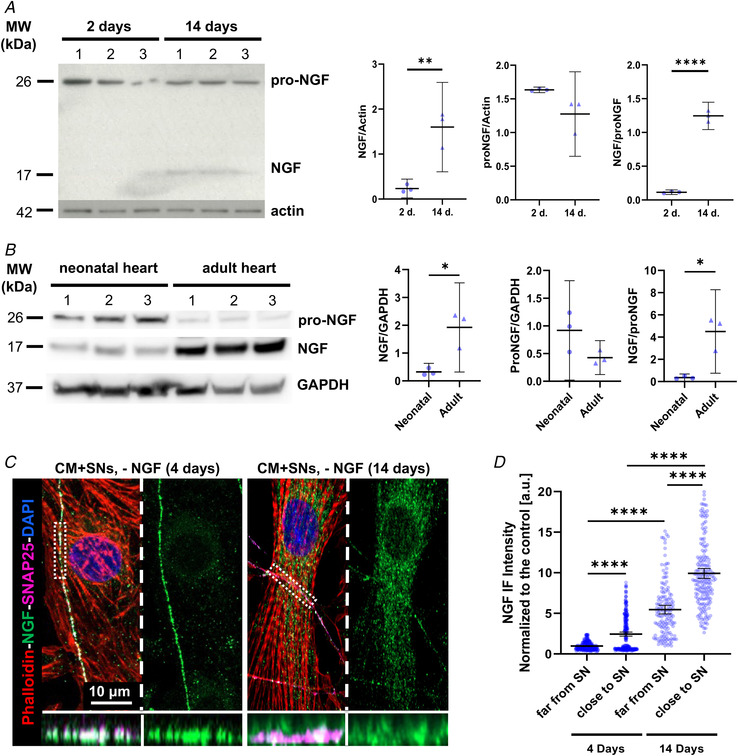
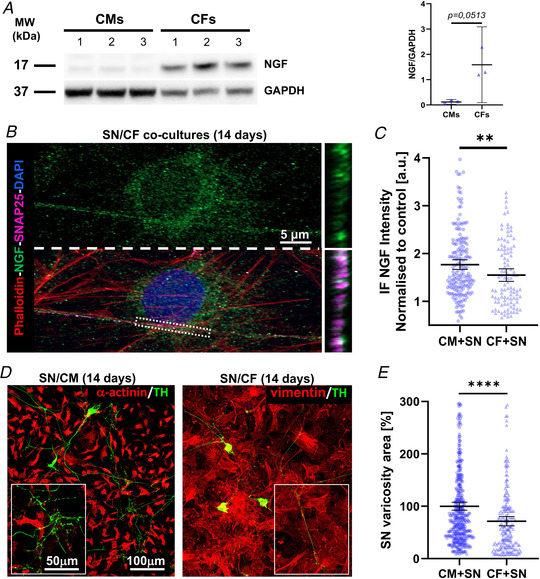
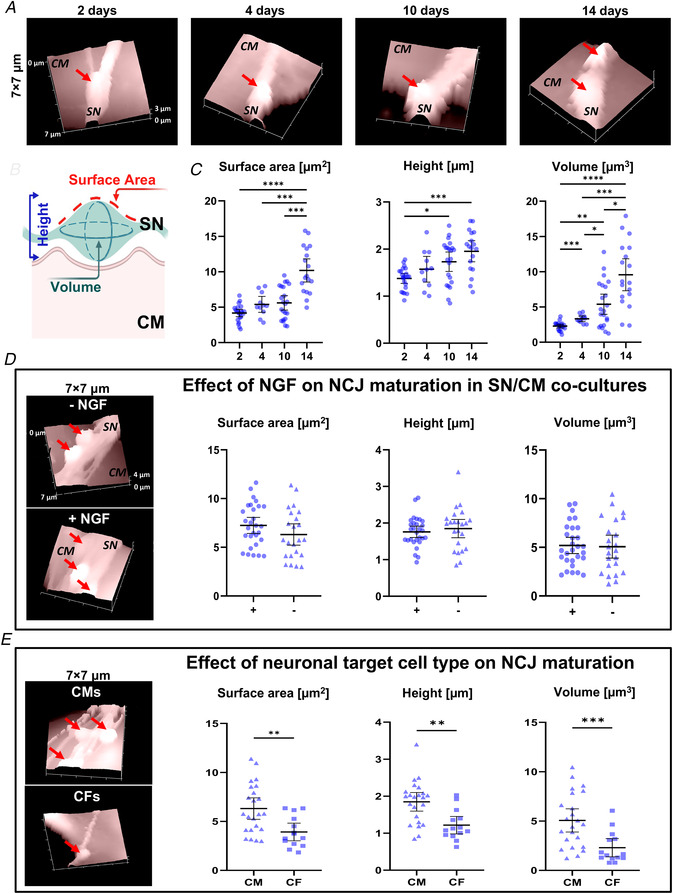
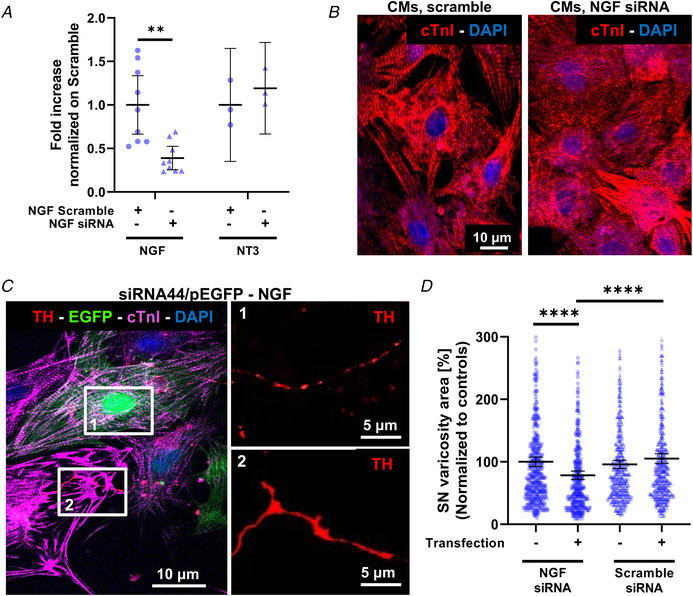
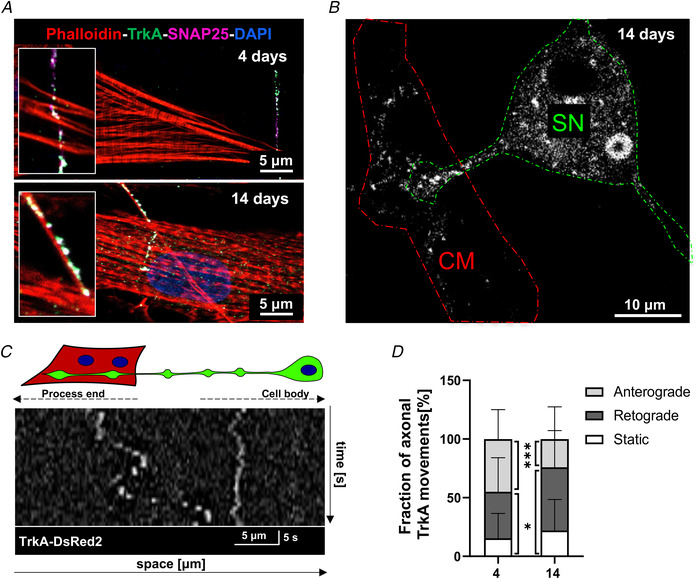
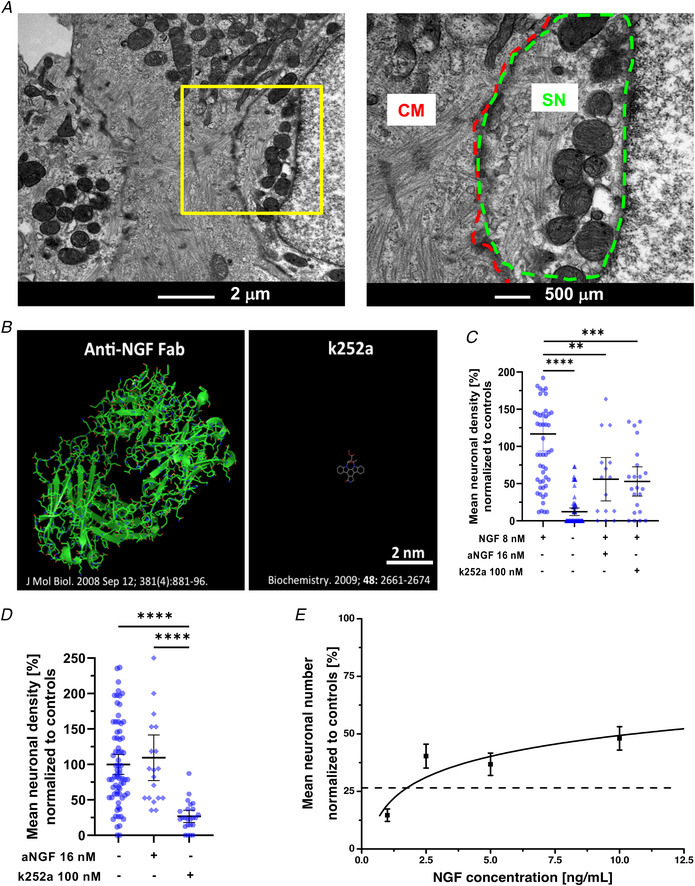
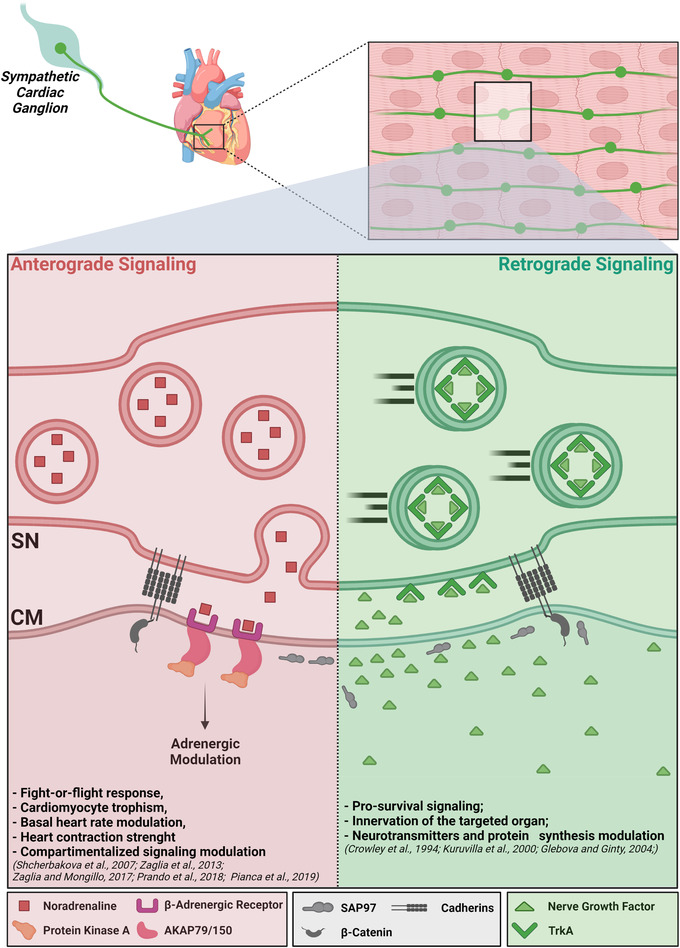
Sympathetic neurons densely innervate the myocardium with non-random topology and establish structured contacts (i.e. neuro-cardiac junctions, NCJ) with cardiomyocytes, allowing synaptic intercellular communication. Establishment of heart innervation is regulated by molecular mediators released by myocardial cells. The mechanisms underlying maintenance of cardiac innervation in the fully developed heart, are, however, less clear. Notably, several cardiac diseases, primarily affecting cardiomyocytes, are associated with sympathetic denervation, supporting the hypothesis that retrograde 'cardiomyocyte-to-sympathetic neuron' communication is essential for heart cellular homeostasis. We aimed to determine whether cardiomyocytes provide nerve growth factor (NGF) to sympathetic neurons, and the role of the NCJ in supporting such retrograde neurotrophic signalling. Immunofluorescence on murine and human heart slices shows that NGF and its receptor, tropomyosin-receptor-kinase-A, accumulate, respectively, in the pre- and post-junctional sides of the NCJ. Confocal immunofluorescence, scanning ion conductance microscopy and molecular analyses, in co-cultures, demonstrate that cardiomyocytes feed NGF to sympathetic neurons, and that this mechanism requires a stable intercellular contact at the NCJ. Consistently, cardiac fibroblasts, devoid of NCJ, are unable to sustain SN viability. ELISA assay and competition binding experiments suggest that this depends on the NCJ being an insulated microenvironment, characterized by high [NGF]. In further support, real-time imaging of tropomyosin-receptor-kinase-A vesicle movements demonstrate that efficiency of neurotrophic signalling parallels the maturation of such structured intercellular contacts. Altogether, our results demonstrate the mechanisms which link sympathetic neuron survival to neurotrophin release by directly innervated cardiomyocytes, conceptualizing sympathetic neurons as cardiomyocyte-driven heart drivers. KEY POINTS: CMs are the cell source of nerve growth factor (NGF), required to sustain innervating cardiac SNs; NCJ is the place of the intimate liaison, between SNs and CMs, allowing on the one hand neurons to peremptorily control CM activity, and on the other, CMs to adequately sustain the contacting, ever-changing, neuronal actuators; alterations in NCJ integrity may compromise the efficiency of 'CM-to-SN' signalling, thus representing a potentially novel mechanism of sympathetic denervation in cardiac diseases.

Keywords: cardiac sympathetic neurons; cardiomyocytes; nerve growth factor; nerve growth factor receptor; neuro-cardiac junction.


Figures

Figure 1
Figure 1. The molecular players of nerve growth factor signalling predominantly localize at the neuro‐cardiac junction, in rat hearts
A , confocal immunofluorescence (IF) analysis of heart sections from adult rats, co‐stained with antibodies against SNAP25 (left panel) and TrkA (middle panel). The right panel shows the bright field images (BF). SN, sympathetic neuron; CM, cardiomyocyte. The white arrow indicates the neuronal process. B, confocal IF analysis of adult rat heart sections, co‐stained with antibodies against SNAP25 (left panel) and nerve growth factor (NGF) (middle panel). The right panel shows merged fluorescence and bright field images. The white arrow indicates the SN process. C, magnified image of panel B. D, surface rendering of the z‐section series of the IF images shown in (B) and relative quantification of the fluorescence intensity of SNAP25 (red signal) and NGF (green signal) in correspondence with the neuronal varicosity (2) or the inter‐varicosity space (1). Bars represent SD (n = 66 neuro‐cardiac contacts from three different rat hearts). [Colour figure can be viewed at wileyonlinelibrary.com]
Figure 2
Figure 2. Nerve growth factor mainly concentrates in the cardiomyocyte submembrane portion contacted by sympathetic neurons in human hearts
A , confocal immunofluorescence (IF) analysis of human heart sections, co‐stained with antibodies against SNAP25 (top panel) and nerve growth factor (NGF) (middle panel). The bottom panel shows the bright field image. B, magnification of the white box in (A), showing the merged fluorescence and bright field images. SN, sympathetic neuron; CM, cardiomyocyte. Arrows indicate NGF puncta in the neuronal process. C, quantification of the fluorescence intensity of SNAP25 (red signal) and NGF (green signal) in correspondence with the neuronal varicosity (2) or the inter‐varicosity space (1). Bars represent SD (n = 15 neuro‐cardiac contacts from two different human hearts). [Colour figure can be viewed at wileyonlinelibrary.com]
Figure 3
Figure 3. Time‐ and neurotrophin‐dependency of sympathetic neuron maturation in co‐culture
A–B , confocal immunofluorescence (IF) analysis of 7‐day cardiac sympathetic neurons (cSNs), isolated from the superior cervical and stellate ganglia of neonatal rats, cultured in the presence (+NGF) or the absence (‐NGF) of nerve growth factor (NGF). Cells were stained with an antibody against tyrosine hydroxylase (TH). Nuclei were counterstained with DAPI. C, confocal IF analysis of 7‐day (left panels) vs. 14‐day (right panels) SN/ cardiomyocyte (CM) co‐cultures, maintained in the presence or in the absence of NGF. Cells were co‐stained with antibodies against α‐actinin and TH. Nuclei were counterstained with DAPI. DE, quantification of SN varicosity area (D) and interindividual distance between varicosities (E) in cSNs co‐cultured with CMs, in the absence (‐) vs. the presence (+) of NGF in the culture medium. Data distribution is represented by the individual values. Mean and error bars, representing 95% confidence intervals, are shown. Differences among groups were determined using the Mann–Whitney test. (**, P < 0.01; ** **, P < 0.0001; (+) 7 days n = 101 and n = 44; (+) 14 days n = 60 and n = 85; (‐) 7 days n = 67 and n = 39; (‐) 14 days n = 102 and n = 34 varicosities for each group. Three independent cell preparations were analysed). [Colour figure can be viewed at wileyonlinelibrary.com]
Figure 4
Figure 4. Time dependency of nerve growth factor content and distribution in cardiomyocytes
A , western blotting of pro‐nerve growth factor (NGF) and mature NGF (left panel) on protein extracts from cardiomyocytes (CMs) maintained for 2 or 14 days in culture. Actin was used as loading control. The right panels show the relative densitometry. Data distribution is represented by the individual values. Mean and error bars, representing 95% confidence intervals, are shown. Differences among groups were determined using an unpaired t test or Mann–Whitney test. (**, P < 0.01; ** **, P < 0.0001. Three independent experiments were performed). B, western blotting of pro‐NGF and mature NGF (left panel) on protein extracts from neonatal (P7) and adult (3 months old) rat hearts. GAPDH was used as loading control. The right panel shows the relative densitometry. Data distribution is represented by the individual values. Mean and error bars, representing 95% confidence intervals, are shown. Differences among groups were determined using an unpaired t test. (*, P < 0.05; n = 3 hearts for each group. Three independent experiments were performed). C, confocal immunofluorescence analysis on 4 vs. 14‐day sympathetic neuron (SN)/CM co‐cultures maintained in the absence of exogenous NGF in the culture medium. Cells were co‐stained with antibodies against NGF and SNAP25. CMs were stained with Alexa633‐conjugated phalloidin, while nuclei were counterstained with DAPI. Bottom panels show resliced images of the boxed area highlighting the intercellular interface. D, comparison of the fluorescence intensity of NGF signal in CM portions close to, or far from, the contacting innervating neuronal process, in the culture conditions described in (C). Data distribution is represented by the individual values. Mean and error bars, representing 95% confidence intervals, are shown. Differences among groups were determined using the Mann–Whitney test. (** **, P < 0.0001; 4 days: n = 267 (far) and 296 (close); 14 days: n = 150 (far) and 192 (close) areas analysed/group. Three independent cell preparations were analysed). [Colour figure can be viewed at wileyonlinelibrary.com]
Figure 5
Figure 5. Sympathetic neurons co‐cultured with cardiac fibroblasts require exogenous nerve growth factor
A , western blotting of nerve growth factor (NGF) protein content on extracts from cardiac fibroblasts (CFs) and cardiomyocytes (CMs), maintained in culture for 14 days, in the absence of exogenous NGF. Actin was used as loading control. The right panel shows the relative densitometry. Data distribution is represented by the individual values. Mean and error bars, representing 95% confidence intervals, are shown. Differences among groups were determined using an unpaired t test. (Three independent experiments were performed). B, confocal immunofluorescence (IF) analysis of 14‐day sympathetic neuron (SN)/CF co‐cultures maintained in the absence of exogenous NGF in the culture medium. Cells were co‐stained with antibodies against SNAP25 and NGF and counterstained with Alexa633‐conjugated phalloidin and DAPI. Bottom panels show resliced images of the boxed area highlighting the intercellular interface. C, quantification of the mean NGF fluorescence intensity in the portion of SN processes contacting CMs (black bars) vs. CFs (grey bars). Data distribution is represented by the individual values. Mean and error bars, representing 95% confidence intervals, are shown. Differences among groups were determined using the Mann–Whitney test. (**, P < 0.01; SN/CM: n = 186 and SN/CF: n = 104 areas analysed/group. Three independent cell preparations were analysed). D, confocal IF analysis of 14‐day SN/CM (left panel) vs. SN/CF (right panel) co‐cultures maintained in the absence of exogenous NGF. Cells were co‐stained with antibodies against tyrosine hydroxylase (TH) and either anti‐α‐actinin (for SN/CM co‐cultures) or anti‐vimentin (for SN/CF co‐cultures). E, quantification of the mean area of neuronal varicosities in contact with either CMs or CFs. To highlight the differences between the two independent populations, values of the area of SN/CF contact sites were normalized to the average area size of varicosities in contact with CM. Mean and error bars, representing 95% confidence intervals, are shown. Differences among groups were determined using the Mann–Whitney test. (** **, P < 0.0001; n = 24 cell couples for each group. Three independent cell preparations were analysed). [Colour figure can be viewed at wileyonlinelibrary.com]
Figure 6
Figure 6. Surface topography of neuronal varicosities during co‐culture maturation
A , representative topographical images of sympathetic neurons (SNs) in 2‐, 4‐, 10‐ and 14‐day co‐culture with cardiomyocyte (CM). Red arrows indicate neuronal varicosities. B, topographical parameters evaluated on SICM images and (C) relative measurements in SN/CM co‐cultures analysed at different time points. Data distribution is represented by the individual values. Mean and error bars, representing 95% confidence intervals, are shown. Differences among groups were determined using the Brown–Forsythe test, with Dunnett's correction. (*, P < 0.05; **, P < 0.01; ** *, P < 0.001; ** **, P < 0.0001; n = 15 SN/CM contacts for each group). D, representative SICM surface scans and quantification of relative parameters of the contact sites in 10‐day SN‐CM co‐cultures, maintained in the absence (‐) or the presence (+) of exogenous nerve growth factor (NGF). Data distribution is represented by the individual values. Mean and error bars, representing 95% confidence intervals, are shown. Differences among groups were determined using an unpaired t test. (P = ns; n = 23 SN/CM contacts for each group). E, representative SICM surface scans and quantification of relative parameters of the contact sites in 10‐day SN/CF co‐cultures, maintained in the absence of exogenous NGF. Data distribution is represented by the individual values. Mean and error bars, representing 95% confidence intervals, are shown. Differences among groups were determined using an unpaired t test or Mann–Whitney test. (**, P < 0.01; ** *, P < 0.001; SN/CM: n = 23 and SN/CF: n = 14 contacts). [Colour figure can be viewed at wileyonlinelibrary.com]
Figure 7
Figure 7. Effect of nerve growth factor silencing in cardiomyocytes on co‐cultured sympathetic neurons
A , RTqPCR on extracts from cultured cardiomyocytes (CMs) transfected with scramble siRNA (white bars) or nerve growth factor (NGF) siRNA (black bars). Data distribution is represented by the individual values. Mean and error bars, representing 95% confidence intervals, are shown. Differences among groups were determined using an unpaired t test. (**, P < 0.01; n = 6 samples for each group in three independent cell preparations). B, confocal immunofluorescence (IF) of cultured CMs transfected with either scramble siRNA or NGF siRNA. Cells were stained with an antibody against cardiac troponin I (cTnI). Nuclei were counterstained with DAPI. C, confocal IF of 7‐day SN/CM co‐cultures in which CMs were co‐transfected with green fluorescent protein GFP and NGF siRNA. Cells were co‐stained with antibodies against tyrosine hydroxylase (TH) and cTnI. Nuclei were counterstained with DAPI. Images on the right are high magnifications of boxed areas on the left panel and show neuronal processes innervating, respectively, GFP+/NGF‐silenced (1) or control (2) CMs. D, quantification of the mean area of TH+ sites contacting un‐transfected, scramble‐siRNA transfected or NGF‐silenced CMs, in 7‐day co‐cultures maintained in the absence of exogenous NGF. Data distribution is represented by the individual values. Mean and error bars, representing 95% confidence intervals, are shown. Differences among groups were determined using the Mann–Whitney test. (** **, P < 0.0001; n > 400 neuronal processes for each condition, in three independent cell preparations). [Colour figure can be viewed at wileyonlinelibrary.com]
Figure 8
Figure 8. TrkA signalling assay in sympathetic neurons during time in co‐culture
A , confocal immunofluorescence (IF) analysis of 4‐day (top panel) vs. 14‐day (bottom panel) co‐cultures co‐stained with antibodies against TrkA and SNAP25. Cells were co‐stained with Alexa633‐conjugated phalloidin. Nuclei were counterstained with DAPI. B, confocal IF of sympathetic neuron (SN)/cardiomyocyte (CM) co‐culture infected with an adenoviral vector encoding TrkA‐DsRed2. The dashed lines indicate SN (green) and innervated CM (red). C, representative kymograph of TrkA‐DsRed2 dots in one neuronal process of a 4‐day SN/CM co‐culture. D, quantification of TrkA‐DsRed2 trafficking in SN processes contacting CMs, in early (4 days) and mature (14 days) co‐cultures. Values are indicated as means ± SD. Differences among groups were determined using the Mann–Whitney test. (*, P < 0.05; ** *, P < 0.001; (4 days): n = 47 and (14 days): n = 40 cells per group. Three independent cell preparations were analysed). [Colour figure can be viewed at wileyonlinelibrary.com]
Figure 9
Figure 9. Pharmacological assay of cardiomyocyte‐neuron nerve growth factor signalling at the neuro‐cardiac junction
A , transmission electron microscopy of 14‐day sympathetic neuron (SN)/cardiomyocyte (CM) co‐cultures. The right panel is the magnification of the area in the left yellow inset. B, Jmoll 3D reconstruction of the Fab domain of an anti‐nerve growth factor (NGF) IgG and of k252a. C, quantification of the mean neuronal density upon treatment of SN cultures with either anti‐NGF or k252a. Data distribution is represented by the individual values. Mean and error bars, representing 95% confidence intervals, are shown. Differences among groups were determined using the Mann–Whitney test. (**, P < 0.01; ** *, P < 0.001; ** **, P < 0.0001; n = 35 fields/condition from three independent cell preparations). D, quantification of the mean neuronal density in SN/CM co‐cultures treated as in (C). Data distribution is represented by the individual values. Mean and error bars, representing 95% confidence intervals, are shown. Differences among groups were determined using the Kruskal–Wallis test. (** **, P < 0.0001; n = 35 fields/condition from three independent cell preparations). E, dose/effect curve of NGF on neuronal density in SN cultures treated with 100 n m k252a. Interpolation was calculated using non‐linear regression obtained with Microsoft Excel. Fitting line is shown (solid black). The dashed line indicates neuronal density in k252a‐treated SN/CM co‐cultures. Bars indicate SD. (n = 24 fields per conditions from three independent cell preparations). [Colour figure can be viewed at wileyonlinelibrary.com]
Figure 10
Figure 10. The neuro‐cardiac junction represents the functional unit underlying both anterograde and retrograde sympathetic neuron–cardiomyocyte communication
A, roadmap of post‐ganglionic sympathetic neurons (SNs), from the cervical ganglia to the myocardial interstitium. B, cartoon representation of the neuro‐cardiac junction is the election site of bidirectional SN–cardiomyocyte (CM) communication (created with BioRender.com). [Colour figure can be viewed at wileyonlinelibrary.com]

Comment in

References

    1. Berg, M. M. , Sternberg, D. W. , Parada, L. F. , & Chao, M. V. (1992). K‐252a inhibits nerve growth factor‐induced trk proto‐oncogene tyrosine phosphorylation and kinase activity. Journal of Biological Chemistry, 267, 13–16. - PubMed
    1. Di Bona, A. , Vita, V. , Costantini, I. , & Zaglia, T. (2020). Towards a clearer view of sympathetic innervation of cardiac and skeletal muscles. Progress in Biophysics and Molecular Biology, 154, 80–93. - PubMed
    1. Boogers, M. J. , Borleffs, C. J. W. , Henneman, M. M. , van Bommel, R. J. , van Ramshorst, J. , Boersma, E. , Dibbets‐Schneider, P. , Stokkel, M. P. , van der Wall, E. E. , Schalij, M. J. , & Bax, J. J. (2010). Cardiac sympathetic denervation assessed with 123‐iodine metaiodobenzylguanidine imaging predicts ventricular arrhythmias in implantable cardioverter‐defibrillator patients. Journal of the American College of Cardiology, 55, 2769–2777. - PubMed
    1. Cao, J.‐M. , Chen, L. S. , KenKnight, B. H. , Ohara, T. , Lee, M.‐H. , Tsai, J. , Lai, W. W. , Karagueuzian, H. S. , Wolf, P. L. , Fishbein, M. C. , & Chen, P.‐S. (2000). Nerve sprouting and sudden cardiac death. Circulation Research, 86, 816–821. - PubMed
    1. Cao, J.‐M. , Fishbein, M. C. , Han, J. B. , Lai, W. W. , Lai, A. C. , Wu, T.‐J. , Czer, L. , Wolf, P. L. , Denton, T. A. , Shintaku, I. P. , Chen, P.‐S. , & Chen, L. S. (2000). Relationship between regional cardiac hyperinnervation and ventricular arrhythmia. Circulation, 101, 1960–1969. - PubMed

Publication types