

'On the Spot' Digital Pathology of Breast Cancer Based on Single-Cell Mass Spectrometry Imaging
- PMID: 35413180
- PMCID: PMC9047448
- DOI: 10.1021/acs.analchem.1c05238
'On the Spot' Digital Pathology of Breast Cancer Based on Single-Cell Mass Spectrometry Imaging
Abstract
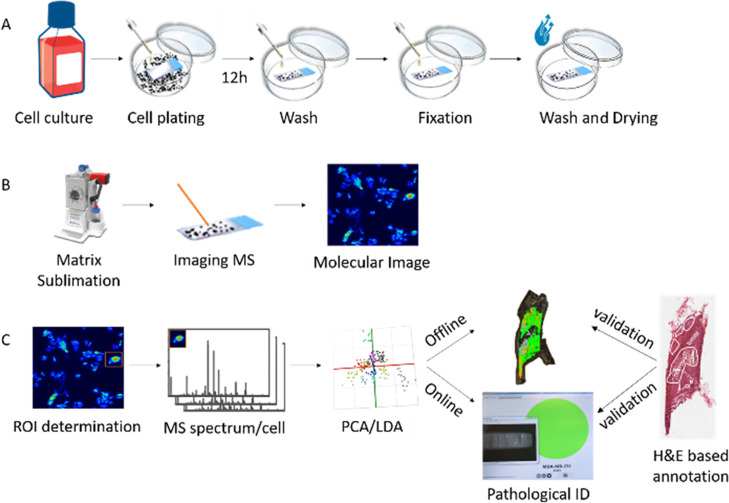
The molecular pathology of breast cancer is challenging due to the complex heterogeneity of cellular subtypes. The ability to directly identify and visualize cell subtype distribution at the single-cell level within a tissue section enables precise and rapid diagnosis and prognosis. Here, we applied mass spectrometry imaging (MSI) to acquire and visualize the molecular profiles at the single-cell and subcellular levels of 14 different breast cancer cell lines. We built a molecular library of genetically well-characterized cell lines. Multistep processing, including deep learning, resulted in a breast cancer subtype, the cancer's hormone status, and a genotypic recognition model based on metabolic phenotypes with cross-validation rates of up to 97%. Moreover, we applied our single-cell-based recognition models to complex tissue samples, identifying cell subtypes in tissue context within seconds during measurement. These data demonstrate "on the spot" digital pathology at the single-cell level using MSI, and they provide a framework for fast and accurate high spatial resolution diagnostics and prognostics.
Conflict of interest statement
The authors declare no competing financial interest.
Figures


References
-
- Wagner J.; Rapsomaniki M. A.; Chevrier S.; Anzeneder T.; Langwieder C.; Dykgers A.; Rees M.; Ramaswamy A.; Muenst S.; Soysal S. D.; Jacobs A.; Windhager J.; Silina K.; van den Broek M.; Dedes K. J.; Rodríguez Martínez M.; Weber W. P.; Bodenmiller B. A Single-Cell Atlas of the Tumor and Immune Ecosystem of Human Breast Cancer. Cell 2019, 177, 1330–1345. 10.1016/j.cell.2019.03.005. - DOI - PMC - PubMed
-
- Ali H. R.; Jackson H. W.; Jackson H. W.; Zanotelli V. R. T.; Danenberg E.; Fischer J. R.; Bardwell H.; Provenzano E.; Rueda O. M.; Chin S.-F.; Aparicio S.; Caldas C.; Bodenmiller B.; Becker R.; Bodenmiller B.; Boyden E. S.; Bressan D.; Bruna A.; Marcel B.; Caldas C.; Callari M.; Cannell I. G.; Casbolt H.; Chornay N.; Cui Y.; Dariush A.; Dinh K.; Emenari A.; Eyal-Lubling Y.; Fan J.; Fisher E.; González-Solares E. A.; González-Fernández C.; Goodwin D.; Greenwood W.; Grimaldi F.; Hannon G. J.; Harris O.; Harris S.; Jauset C.; Joyce J. A.; Karagiannis E. D.; Kovačević T.; Kuett L.; Kunes R.; Küpcü Yoldaş A.; Lai D.; Laks E.; Lee H.; Lee M.; Lerda G.; Li Y.; McPherson A.; Millar N.; Mulvey C. M.; Nugent F.; O’Flanagan C. H.; Paez-Ribes M.; Pearsall I.; Qosaj F.; Roth A. J.; Rueda O. M.; Ruiz T.; Sawicka K.; Sepúlveda L. A.; Shah S. P.; Shea A.; Sinha A.; Smith A.; Tavaré S.; Tietscher S.; Vázquez-García I.; Vogl S. L.; Walton N. A.; Wassie A. T.; Watson S. S.; Wild S. A.; Williams E.; Windhager J.; Xia C.; Zheng P.; Zhuang X.; Rueda O. M.; Chin S.-F.; Aparicio S.; Caldas C.; Bodenmiller B.; Team C. I. G. C. Imaging mass cytometry and multiplatform genomics define the phenogenomic landscape of breast cancer. Nat. Cancer 2020, 1, 163–175. 10.1038/s43018-020-0026-6. - DOI - PubMed
-
- Curtis C.; Shah S. P.; Shah S. P.; Chin S.-F.; Turashvili G.; Rueda O. M.; Dunning M. J.; Speed D.; Lynch A. G.; Samarajiwa S.; Yuan Y.; Gräf S.; Ha G.; Haffari G.; Bashashati A.; Russell R.; McKinney S.; Langerød A.; Green A.; Provenzano E.; Wishart G.; Pinder S.; Watson P.; Markowetz F.; Murphy L.; Ellis I.; Purushotham A.; Børresen-Dale A.-L.; Brenton J. D.; Tavaré S.; Caldas C.; Aparicio S. The genomic and transcriptomic architecture of 2,000 breast tumours reveals novel subgroups. Nature 2012, 486, 346–352. 10.1038/nature10983. - DOI - PMC - PubMed
-
- Perou C. M.; Sørlie T.; Eisen M. B.; van de Rijn M.; Jeffrey S. S.; Rees C. A.; Pollack J. R.; Ross D. T.; Johnsen H.; Akslen L. A.; Fluge Ø.; Pergamenschikov A.; Williams C.; Zhu S. X.; Lønning P. E.; Børresen-Dale A.-L.; Brown P. O.; Botstein D. Molecular portraits of human breast tumours. Nature 2000, 406, 747–752. 10.1038/35021093. - DOI - PubMed
-
- Baulies S.; Cusidó M.; González-Cao M.; Tresserra F.; Fargas F.; Rodríguez I.; Úbeda B.; Ara C.; Fábregas R. Hormone receptor and HER2 status: The only predictive factors of response to neoadjuvant chemotherapy in breast cancer. J. Obstet. Gynaecol. 2015, 35, 485–489. 10.3109/01443615.2014.968113. - DOI - PubMed
Publication types
MeSH terms
Grants and funding
LinkOut - more resources
Full Text Sources
Medical
