. 2022 Apr 11;40(4):393-409.e9.
doi: 10.1016/j.ccell.2022.03.006.

Neoantigen-specific CD4+ T cells in human melanoma have diverse differentiation states and correlate with CD8+ T cell, macrophage, and B cell function

Affiliations

Neoantigen-specific CD4+ T cells in human melanoma have diverse differentiation states and correlate with CD8+ T cell, macrophage, and B cell function

Joshua R Veatch et al. Cancer Cell. .

Abstract

CD4+ T cells that recognize tumor antigens are required for immune checkpoint inhibitor efficacy in murine models, but their contributions in human cancer are unclear. We used single-cell RNA sequencing and T cell receptor sequences to identify signatures and functional correlates of tumor-specific CD4+ T cells infiltrating human melanoma. Conventional CD4+ T cells that recognize tumor neoantigens express CXCL13 and are subdivided into clusters expressing memory and T follicular helper markers, and those expressing cytolytic markers, inhibitory receptors, and IFN-γ. The frequency of CXCL13+ CD4+ T cells in the tumor correlated with the transcriptional states of CD8+ T cells and macrophages, maturation of B cells, and patient survival. Similar correlations were observed in a breast cancer cohort. These results identify phenotypes and functional correlates of tumor-specific CD4+ T cells in melanoma and suggest the possibility of using such cells to modify the tumor microenvironment.

Keywords: CD4; CXCL13; breast; follicular; melanoma; neoantigen.


Conflict of interest statement

Declaration of interests S.R.R. is a co-founder of Lyell Immunopharma. J.R.V and S.R.R. have received grant funding and have intellectual property licensed to Lyell Immunopharma. J.R.V. and A.M.H. have received research support from Bristol Myers Squibb. R.G. has received consulting income from Illumina and declares ownership in Ozette Technologies, Modulus Therapeutics, and minor stock ownerships in 10X Genomics.

Figures

Figure 1.
Figure 1.. Identification of neoantigen specific TCRVb clonotypes from melanoma patients
A. FACS sorting of CD3+ CD4+ T cells based on PD-1 expression in patients X205 and X422. B-C. IFN-γ secretion by T cell lines expanded in limiting dilution cultures from intratumoral PD-1high CD4+ T cells from patient X205 (B) and X422 (C) after incubation with 1μM 27-mer peptide containing the mutant or wildtype amino acid at position +14. The dominant TCR Vb clonotype present in each culture was identified by TCR Vb sequencing. Horizontal lines denotes the median. D-E. T cell cultures expanded in bulk from intratumoral PD-1high CD4+ T cells from patient X205 were incubated with indicated pools of peptides and stained for expression of CD40L and CD4 (D). CD40L+ CD4+ cells were isolated by FACS, TCRVb genes in sorted CD40L positive T cells were identified by sequencing, and the percentage of selected clonotypes (rows) found in replicate assays relative to the total across all peptide stimulations (columns) are shown (WT= wildtype peptide) (E). F. IFN-γ release by T cells lentivirally transduced with synthetic TCR sequences corresponding to the clonotypes that expanded with BRAF peptide stimulation after incubation with the indicated concentrations of mutant and wildtype 27-mer BRAF peptide. Data shown as the mean plus or minus the standard error of the mean. G. PBMC from patient X198 was stimulated with a pool of mutant peptides and restimulated on day +13 with individual 27-mer peptides containing the wildtype or mutated amino acid at position +14 and the frequency of IFN-γ secreting CD4+ T cells was measured by Elispot. H. Duplicate parallel cultures of PBMC from patient X198 were stimulated with individual mutant peptides and cultured for 13 days followed by TCRVb sequencing of enriched CD4+ T cells. The percentage of TCRVb templates (rows) seen in replicate cultures stimulated with a single mutant peptide (columns) relative to other stimulations are shown. I. Summary of the total number of TCRVb clonotypes specific for neoantigens, tumor self-antigens and viral antigens that were identified from each of the 4 patients. N/A indicates no such clones were identified. N/E indicates not evaluated. See also Figures S1 and S2 and Tables S1 and S2.
Figure 2.
Figure 2.. Tumor antigen specific conventional CD4+ T cells exhibit transcriptional signatures distinct from Treg and bystander conventional CD4+ T cells.
A-B. Unsupervised clustering of 10,186 CD4+ T cells from primary tumor samples of 4 patients visualized by UMAP with cells labelled by patient (A) and phenotypic clusters (B). C. Expression of FOXP3, CXCL13, LAG3, TCF7, GZMA, TYMS, IL7R and IFNG mRNA, and PD-1/CD279, Tim3, CXCR5, CD103, CD127 and CD39 surface protein in tumor infiltrating CD4+ T cells is shown with color reflecting log2 of expression. D. Summary of antigen specific CD4+ T cells identified in the tumor infiltrate by TCRVb sequence. E. Cells with TCRVb clonotypes specific for neoantigens and self-antigens are shown. F. Proportion of neoantigen, self-antigen and viral antigen specific cells in CXCL13+, CXCL13, and FOXP3+ clusters. G-H. The number of cells with each clonotype (G) and the relative enrichment of TCR clonotypes detected in tumor relative to peripheral blood(H). I. mRNA expression of immune related genes defining each cluster of CD4+ T cells in the tumor. See also Figure S3 and Tables S3 and S4.
Figure 3:
Figure 3:. The fraction of CXCL13+ CD4+ T cells correlates with overall survival in melanoma
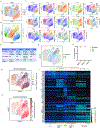
A-B. Data from 26773 sorted CD4+ T cells from 20 patients were visualized by UMAP with (A) cells clustered by phenotype and (B) log2 expression of the indicated mRNA or surface markers. C. Heatmap showing log2 expression of mRNA that define phenotypic clusters of CD4+ T cells. D. Donor T cells transduced with TCR sequences from CXCL13+ T cells from patient X231 were incubated with wildtype or mutant SEC31A peptide and IFN-γ production was measured by ICS. E. Overall survival of 20 melanoma patients stratified by greater or less than the median of conventional CD4+ T cells belonging to CXCL13+ clusters. F. Overall survival of 471 patients in the cancer genome atlas based on the median of CXCL13 expression normalized to CD4 expression. G. Overall survival of 471 patients based on the median predicted fraction of TFH cells using the CIBERSORT algorithm. See also figures S3 and S4 and tables S5 and S6.
Figure 4.
Figure 4.. Tumor infiltrating CD8+ T cells share gene expression signatures and their frequency and proliferative state correlate with tumor antigen specific CD4+ T cells
A. 2585 CD8+ T cells from 2 melanoma patients were visualized by UMAP and clustered by phenotype. B. Presence of tumor antigen specific TCRVb in the UMAP plots. C. 15332 CD8+ T cells from 20 patients visualized by UMAP showing mRNA expression of CXCL13, TYMS, IL7R, TCF7, TOX, and GZMB, and surface expression of CD279/PD-1, CD39, Tim3 and CD103. D. Phenotypic categories of CD8+ T cells are indicated. E. Jaccard similarity index expressed as a percentage of mRNA expressed genes upregulated at least 2-fold in phenotypic categories of CD4+ and CD8+ T cells. F. Spearman correlation of different CD4+ T cell populations as a fraction of CD4+ T cells compared to CD8+ T cell populations as a fraction of CD45+ cells across the 20-patient cohort. G. Spearman correlation of CXCL13 expression with CD8a expression in the 471 patients with melanoma. H. Spearman correlations of CXCL13, BTLA and IL21 expression to CD8A expression, with and without normalization to CD4 expression. * FDR <.05 ** FDR<0.01 *** p <10−4. p<10−6 for all correlations in H, false discovery rates for spearman correlations determined using Benjamini Hockberg correction. See also figures S5 and S6.
Figure 5.
Figure 5.. The presence of CXCL13+ CD4+ T cells correlates with an immune stimulatory phenotype in macrophages
A-B. 12977 CD45+ CD19 CD3 cells from 20 melanoma patients were separated into phenotypic clusters with differentially expressed genes shown (A) and phenotypic clusters visualized by UMAP (B). C. Spearman correlations of expression of the indicated mRNA in macrophages in the 20-patient cohort with the fraction of CD4+ T cells in CXCL13+ clusters. D. Correlation of the fraction of CXCL9+ macrophages and the fraction of CXCL13+ CD4+ cells of total CD4+ T cells. E-F. Expression of CXCL13 compared to CXCL9 (E) or the indicated chemokines (F) in 471 melanoma patients compared to expression of CXCL13, BTLA, and IL21, with or without normalization of these to CD4, with Spearman correlations shown. *significant with FDR <0.05 ** significant with FDR <0.01 by spearman correlation with the Benjamini-Hockberg correction. All correlations in (F) p < 10−10 for correlations with CXCL9, CXCL10, CXCL11 and IL15. G. Receptor ligand interactions between CD4+ T cell subsets and B cells, CD8+ T cells and myeloid cells generated by cellphoneDB. See also figure S7.
Figure 6.
Figure 6.. TFH-like CD4+ T cells correlate with B cell infiltration and co-localize with B cells in melanoma.
A-B. 9428 CD19+ B lineage cells from 20 patients were visualized by UMAP with expression of individual genes shown (A) as well as phenotypic clusters (B). C-D. Correlation of memory B cells as a percentage of CD45+ cells and CXCL13+, TCF7+, CD4+ T cells as a percentage of CD4+ T cells (C) and Spearman correlation with B cells subsets with CXCL13+ CD4+ T cell subsets in 20 melanoma patients (D) E-F. Spearman correlations of CXCL13 versus IGHG1 (E) or CXCL13, BTLA, and IL21 expression versus B cell markers in 471 melanoma patients (F). G. Multiplex immunohistochemistry of a tertiary lymphoid structure in patient X198, with CD4+ T cells inferred from cells staining for CD3 but not CD8. H-I. Proximity analysis of the number of CD79a+ B lineage cells within 100 microns of each CD4+ or CD8+ T cell based on CXCL13 staining in patient X197 (H) and X198 (I). Boxplots show minimum, 25th percentile, median, 75th percentile, and maximum. J. Representative image showing distribution of PD-1high Tcf7+ (red) and PD-1high Tcf7 (blue) CD4+ T cells overlayed on classifier showing B cell rich (light blue) versus poor (yellow) regions. K. Fraction of either CD4+ or CD4+ PD1+ T cells in B cell rich zones in n=8 melanoma cases with significant B cell infiltrates. * FDR<0.05 ** p<0.0001. See also figures S7 and S8.
Figure 7.
Figure 7.. Infiltrating CD4+ T cells in breast cancer patients treated with immune checkpoint inhibitors exhibit similar phenotypes and correlate to activation of CD8+ T cells and myeloid cells.
A. Single cell RNA sequencing of CD4+ T cells from 31 patients with breast cancer visualized by UMAP for the expression of the indicated genes, with cells clustered by phenotype (right lower panel). B. Correlation between CXCL13+ cell populations as a fraction of CD4+ T cells and proliferating CD8+ T cells as a fraction of all cells, C. Spearman correlations of the indicated cell subsets. D-F. Correlation between CXCL13+ CD4+ T cells as a fraction of CD4+ T cells and the fraction of myeloid cells expressing CXCL9 (D), IL15 (E), and a panel of genes (F).

Comment in

  • Tracking down tumor-specific T cells.
    Reading J, Foster K, Joshi K, Chain B. Reading J, et al. Cancer Cell. 2022 Apr 11;40(4):351-353. doi: 10.1016/j.ccell.2022.03.007. Cancer Cell. 2022. PMID: 35413268

References

    1. Ahmadzadeh M, Pasetto A, Jia L, Deniger DC, Stevanović S, Robbins PF, and Rosenberg SA (2019). Tumor-infiltrating human CD4+ regulatory T cells display a distinct TCR repertoire and exhibit tumor and neoantigen reactivity. Science immunology 4, eaao4310. - PMC - PubMed
    1. Alfaro C, Teijeira A, Oñate C, Pérez G, Sanmamed MF, Andueza MP, Alignani D, Labiano S, Azpilikueta A, and Rodriguez-Paulete A (2016). Tumor-produced interleukin-8 attracts human myeloid-derived suppressor cells and elicits extrusion of neutrophil extracellular traps (NETs). Clinical Cancer Research 22, 3924–3936. - PubMed
    1. Alspach E, Lussier DM, Miceli AP, Kizhvatov I, DuPage M, Luoma AM, Meng W, Lichti CF, Esaulova E, and Vomund AN (2019). MHC-II neoantigens shape tumour immunity and response to immunotherapy. Nature, 1–6. - PMC - PubMed
    1. Balança C-C, Salvioni A, Scarlata C-M, Michelas M, Martinez-Gomez C, Gomez-Roca C, Sarradin V, Tosolini M, Valle C, and Pont F (2021). PD-1 blockade restores helper activity of tumor-infiltrating, exhausted PD-1hiCD39+ CD4 T cells. JCI insight 6. - PMC - PubMed
    1. Bassez A, Vos H, Van Dyck L, Floris G, Arijs I, Desmedt C, Boeckx B, Bempt MV, Nevelsteen I, and Lambein K (2021). A single-cell map of intratumoral changes during anti-PD1 treatment of patients with breast cancer. Nature Medicine 27, 820–832. - PubMed

Publication types

Substances