. 2022 May 3;34(5):761-774.e9.
doi: 10.1016/j.cmet.2022.03.009. Epub 2022 Apr 11.

Klebsiella pneumoniae induces host metabolic stress that promotes tolerance to pulmonary infection

Affiliations

Klebsiella pneumoniae induces host metabolic stress that promotes tolerance to pulmonary infection

Tania Wong Fok Lung et al. Cell Metab. .

Abstract

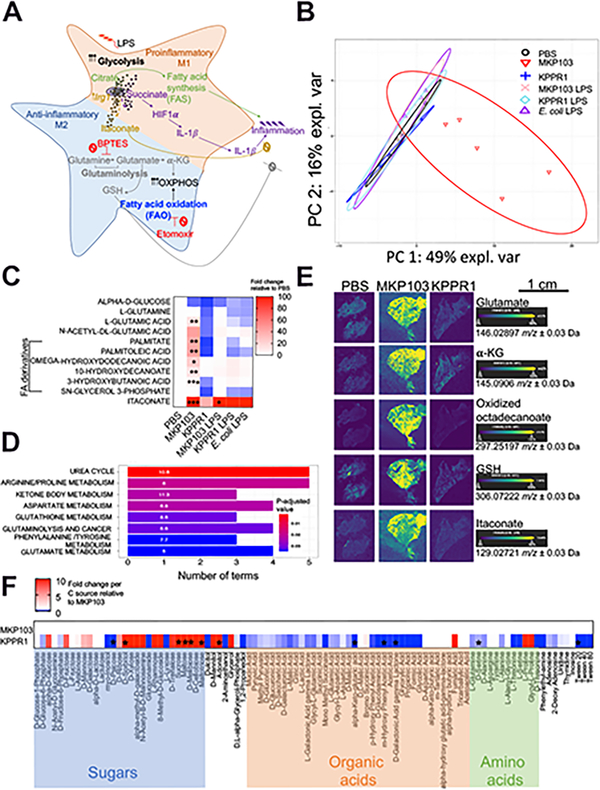
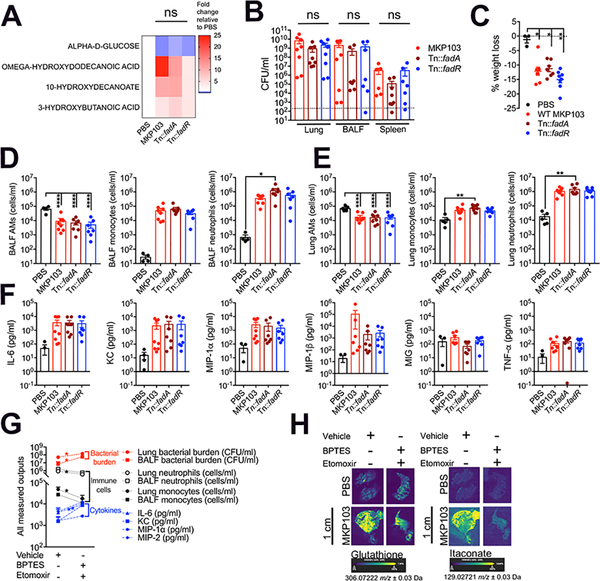
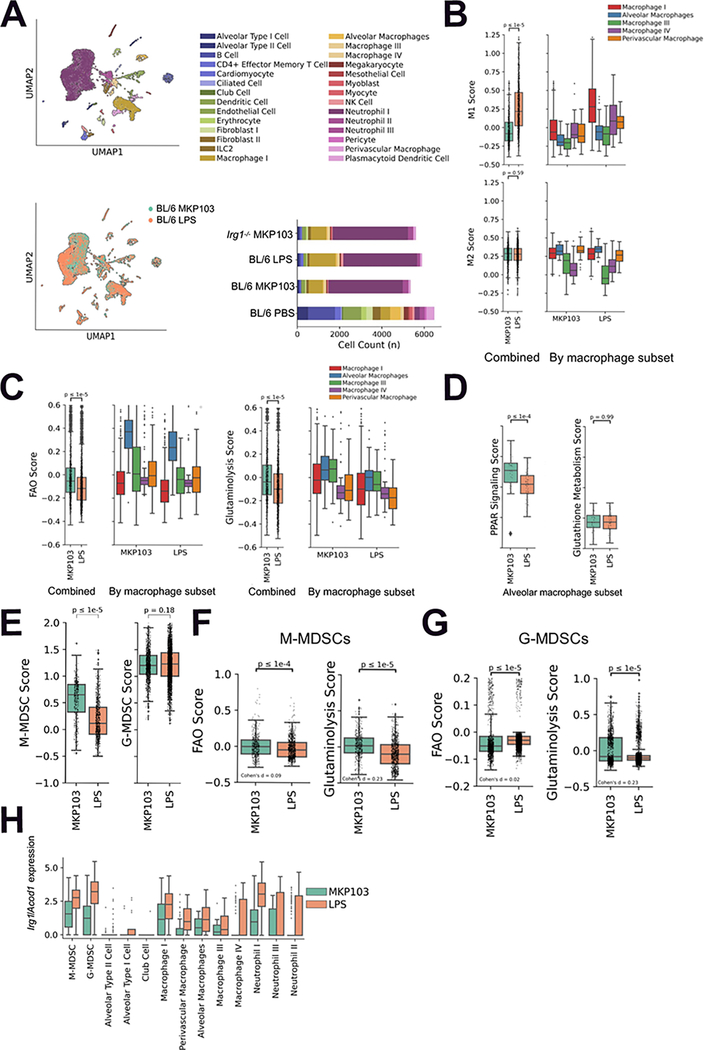
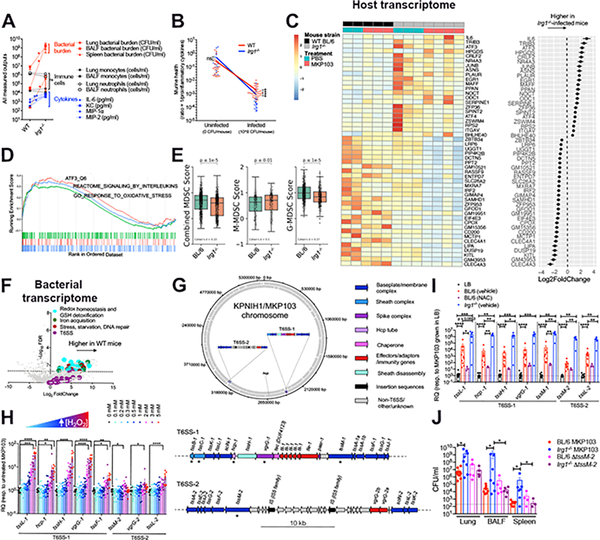
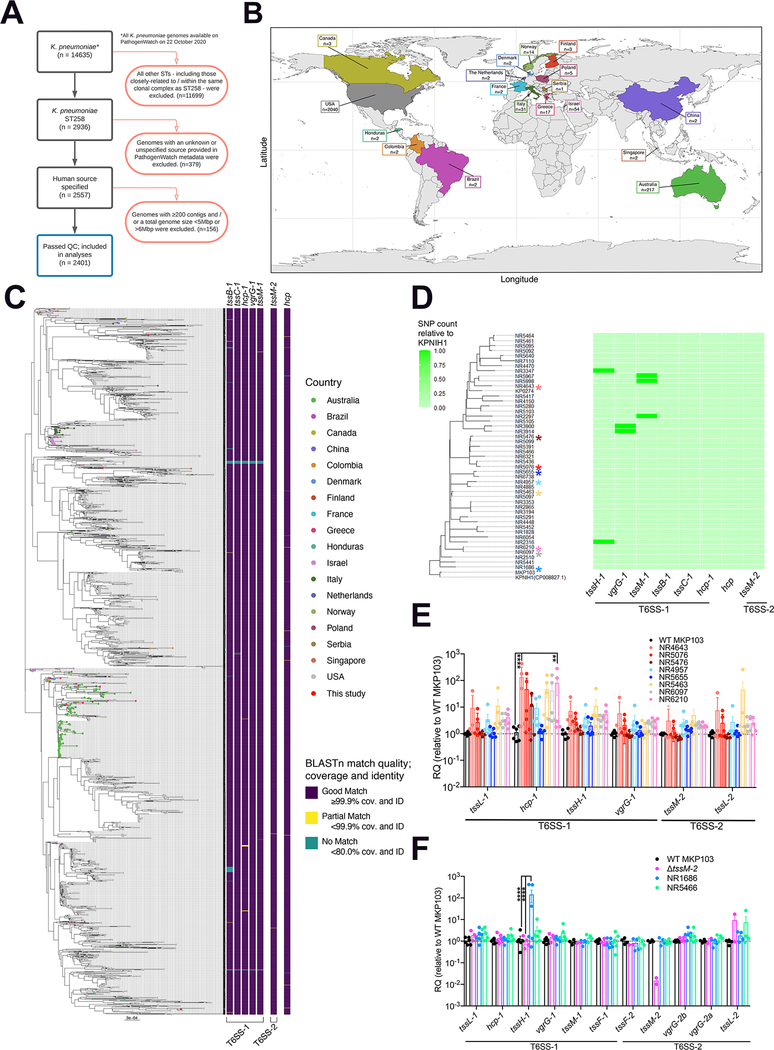
K. pneumoniae sequence type 258 (Kp ST258) is a major cause of healthcare-associated pneumonia. However, it remains unclear how it causes protracted courses of infection in spite of its expression of immunostimulatory lipopolysaccharide, which should activate a brisk inflammatory response and bacterial clearance. We predicted that the metabolic stress induced by the bacteria in the host cells shapes an immune response that tolerates infection. We combined in situ metabolic imaging and transcriptional analyses to demonstrate that Kp ST258 activates host glutaminolysis and fatty acid oxidation. This response creates an oxidant-rich microenvironment conducive to the accumulation of anti-inflammatory myeloid cells. In this setting, metabolically active Kp ST258 elicits a disease-tolerant immune response. The bacteria, in turn, adapt to airway oxidants by upregulating the type VI secretion system, which is highly conserved across ST258 strains worldwide. Thus, much of the global success of Kp ST258 in hospital settings can be explained by the metabolic activity provoked in the host that promotes disease tolerance.

Keywords: Klebsiella pneumoniae; M2 macrophages; MDSCs; bacterial adaptation; disease tolerance; immunometabolism; immunosuppression; itaconate; pulmonary infection; type 6 secretion system.


Conflict of interest statement

Declaration of interests B.R.S. is an inventor on patents and patent applications related to GPX4 and ferroptosis, a consultant to and co-founder of Inzen Therapeutics and Nevrox Limited, and a member of the Scientific Advisory Board of Weatherwax Biotechnologies Corporation. The other authors declare no competing interests.

Figures

Figure 1.
Figure 1.. Live MKP103 induces a host metabolic response distinct from that stimulated by PAMPs or KPPR1.
(A) Schematic diagram showing the metabolic activities that fuel pro- and anti-inflammatory effector functions in immune cells. (B) Principal component analysis (PCA) score plot showing principal component 1 (PC1) versus PC2 of the metabolites extracted from the BALF of uninfected mice (PBS, n = 4 mice/biological replicates) and mice treated intranasally 48 h earlier with live MKP103 (n = 5 mice) or KPPR1 (n = 5 mice) or with purified LPS from each Kp strain and E. coli (n = 4, 4 and 6 mice respectively). The above-mentioned biological replicates were from 2 independent experiments and the data represent the median with 95% confidence interval. (C) Heatmap showing specific BALF metabolites from (B). The level of each metabolite in response to the different stimuli is compared by fold increase over the uninfected control (PBS). Statistical analysis was performed by one-way ANOVA for each metabolite; *P < 0.05, **P < 0.01, ***P < 0.001. (D) Pathway enrichment analysis of BALF metabolites depicting significantly upregulated pathways in MKP103-infected versus uninfected mice. (E) DESI-MS spectral images of glutamate, α-ketoglutarate (α-KG), oxidized octadecenoate (FA derivative), glutathione (GSH) and itaconate in 10 μm representative lung sections from uninfected (n = 2 mice, i.e., 1 spectral image/technical replicate of 2 biological samples from 2 experiments) and MKP103 (n = 2 mice, i.e., 1 technical replicate of 2 biological samples from 2 experiments) or KPPR1 (n = 1 mouse, i.e., 1 technical replicate of 1 biological sample)-infected mice. Scale bar (E): 1cm. (F) Carbon source assimilation of KPPR1 relative to MKP103 (PM1 Biolog, n = 3 biological replicates from 3 independent experiments). The color intensity in the heatmap corresponds to the absorbance of KPPR1 (OD590nm) as a readout of bacterial respiration in the presence of the indicated carbon source, normalized to the absorbance (OD590nm) of MKP103 in the same carbon source. Asterisks denote statistically significant differences as determined by multiple t-test (two-stage step-up method of Benjamini, Krieger and Yekutieli, one unpaired t-test per carbon source) with a false discovery rate (FDR) of 1%.
Figure 2.
Figure 2.. Host metabolic responses to infection predominantly dictate the airway metabolome.
(A) Heatmap showing BALF metabolites from mice treated intranasally with PBS (n = 5 mice), WT MKP103 (n = 5 mice) or transposon mutants impaired in bacterial fatty acid oxidation (Tn::fadA, n = 5 mice) and synthesis (Tn::fadR, n = 5 mice) 48 h earlier. The above-mentioned total number of mice per group were from 2 independent experiments. The level of each metabolite in response to the different stimuli is compared by fold increase over the uninfected control (PBS); ns: not significant. (B) Bacterial burden from the lung, BALF and spleen of WT BL/6 mice infected with MKP103 (n = 8 mice), Tn::fadA (n = 8 mice) or Tn::fadR (n = 8 mice) 48 h earlier. The above-mentioned total number of mice per group were from 3 independent experiments. The dotted line indicates the limit of detection. (C) Percentage of murine body weight loss 48 h post treatment. (D-E) Innate immune cells (alveolar macrophages (AMs), monocytes and neutrophils) from the (D) BALF and (E) lungs of uninfected (PBS, n = 5 mice from 3 independent experiments) and infected mice (same number of replicates as in (B)) at 48 h pi. (F) Cytokine measurements from the BALF of uninfected and infected mice at 48 h pi. (G) Bacterial burden and host immune cells and cytokines from the airway of mice infected with MKP103 48 h earlier and treated with BPTES and etomoxir (n = 6 mice) or the vehicle control (n = 8 mice). The above-mentioned total number of mice per group were spread across 2 independent experiments. (H) DESI-MS spectral images of GSH and itaconate in 10 μm lung sections from uninfected (n = 1 technical replicate of 1 biological sample) and MKP103-infected (n = 1 technical replicate of 1 biological sample) mice (48 h post infection, pi) treated with BPTES and etomoxir or the vehicle control. Scale bar (H): 1cm. The data represent mean values ± SEM, statistical analysis for (A), (C-F) and (B), (G) was performed by one-way ANOVA; *P < 0.05, **P < 0.01, ***P < 0.001, ***P < 0.0001 and Mann Whitney non-parametric U-test, *P < 0.05, **P < 0.01, respectively.
Figure 3.
Figure 3.. Viable MKP103 induces both metabolic and immune changes that promote immunosuppression.
(A) UMAP embedding of cells from MKP103 and MKP103 LPS-stimulated BL/6 mice, colored by annotated cell type (top-left) and sample (bottom-left). Absolute cell counts colored by annotated cell type for all study samples (bottom-right). For each of the above conditions, n = 1 mouse. (B) M1 (top) and M2 (bottom) macrophage scores for MKP103 and LPS-stimulated BL/6 mouse macrophage populations combined (left) and stratified by sub-cluster (right). (C) Fatty acid oxidation (FAO) and glutaminolysis scores for MKP103 and LPS-stimulated BL/6 mouse macrophage populations combined (left) and stratified by sub-cluster (right). (D) PPAR signaling and glutathione metabolism scores for MKP103 and LPS-stimulated BL/6 mouse alveolar macrophage subset. (E) M-MDSC and G-MDSC scores for MKP103 and LPS-stimulated BL/6 mice. (F-G) FAO and glutaminolysis scores for MKP103 and LPS-stimulated BL/6 mouse (F) M-MDSC and (G) G-MDSC subpopulations. (H) Irg1/Acod1 expression in M/G-MDSC, macrophage and neutrophil subpopulations as well as epithelial alveolar and club cells in MKP103 and LPS-stimulated BL/6 mice.
Figure 4.
Figure 4.. Itaconate dictates both host and pathogen responses during MKP103 infection.
(A) Bacterial burden and host immune cells and cytokines from the airway of WT BL/6 or Irg1−/−-infected mice (at 48 h pi), n = 10 mice and 8 mice respectively (from 3 independent experiments). Statistical analysis was performed by Mann Whitney non-parametric U-test, *P < 0.05, **P < 0.01. ***P < 0.001. (B) Murine health (inversely proportional to proinflammatory cytokine levels) plotted against infection state. The slope of the curves indicates stronger disease tolerance in WT versus Irg1−/−-infected mice. Statistical analysis was performed by Mann Whitney non-parametric U-test, *P < 0.05, **P < 0.01. ***P < 0.001. (C) Heatmap showing top 50 differentially expressed murine genes (Padj < 10−4, ordered by effect size) between infected WT and Irg1−/− mice (48 h pi), with each gene also normalized for basal expression in the respective uninfected mice (n = 2 uninfected and 3 infected WT BL/6 mice versus 3 uninfected and 4 infected Irg1−/− mice, 1 experiment). Biological replicates are adjacently grouped. The accompanying dot plot (right of heatmap) shows the direction and magnitude of expression change in infected Irg1−/− versus WT mice as log2-transformed fold change ± SEM. (D) Gene set enrichment analysis (GSEA) of ranked genes from (C) against KEGG and GO gene sets involved in atf3-mediated (orange) or oxidative (green) stress responses and interleukin production (blue). The top portion plots the enrichment scores for each gene. (E) Combined and stratified M/G-MDSC score plots for MKP103-infected BL/6 and Irg1−/−mice (n = 1 mouse per condition). (F) Volcano plot of bacterial transcriptome displaying the pattern of gene expression values from MKP103 isolated from WT BL/6 mice (n = 3 mice, 1 experiment) at 48 h pi relative to in vitro LB culture (n = 3 biological replicates, 1 experiment). Significantly differentially expressed genes (FDR-corrected P≤ 0.05) are shown above the dotted line. Selected genes related to oxidative stress detoxification (cyan), iron acquisition (green), stress and repair (maroon) and T6SS (purple) are indicated. (G) Schematic diagram showing the distribution of T6SS genes in the chromosome of KPNIH1, the parental strain of MKP103. The top panel shows the position and orientation of T6SS genes in the KPNIH1/MKP103 chromosome. The bottom panel shows both of these loci in detail; all T6SS-associated genes are annotated and the asterisk (*) indicates the T6SS genes of interest that were initially used to identify each of these regions. Genes are colored according to their role in T6SS. This figure was made using DNAplotter (Carver et al., 2009) in R (v3.6.0) using the R package genoplotR (v0.8.10) (Guy et al., 2010). (H-I) Expression of T6SS genes from MKP103 (H) grown in increasing concentrations of H2O2 in LB, n = 10 biological samples per condition from 4 independent experiments or (I) harvested directly from the lungs of infected-WT BL/6 mice (48 h pi) treated (n = 10 biological samples from 3 independent experiments) or untreated with NAC (n = 3 biological samples from 1 experiment) and infected-Irg1−/− mice (n = 5 biological samples from 2 independent experiments), by qRT-PCR. RQ, relative quantification to MKP103 grown in LB only. For (H-I), columns represent mean values ± SEM, statistical analysis was performed by one-way ANOVA for each condition; *P < 0.05, **P < 0.01, ***P < 0.001, ***P < 0.0001. (J) Bacterial burden (WT MKP103 or ΔtssM-2) from the lung, BALF and spleen of WT and Irg1−/− mice (n = 9 BL/6 mice infected with WT MKP103, n = 5 BL/6 mice infected with the ΔtssM-2 mutant, n = 8 Irg1−/− mice infected with WT MKP103 and n = 5 Irg1−/− mice infected with the ΔtssM-2 mutant, 2 independent experiments), at 48 h pi, *P < 0.05 by Mann Whitney non-parametric U-test.
Figure 5.
Figure 5.. T6SS-encoding genes are conserved and expressed by Kp ST258 isolates worldwide.
(A) Decision tree showing inclusion (black boxes) and exclusion (red boxes) criteria used to determine which genome assembly samples were included for T6SS key gene screening (blue box) of publicly available dataset. (B) Country of isolation for the K. pneumoniae ST258 genome assemblies from Pathogenwatch included in analysis (date of analysis − 22nd October 2020). (C) The phylogenetic tree, created from Mash distances, has been midpoint-rooted and has tips coloured by country of sample isolation according to Pathogenwatch metadata. The figure was made in R using the R packages ggplot2 (v3.3.2,) (Wickham, 2009), sf (v0.9–7), rnaturalearth (v0.2.0), and rnaturalearthdata (v0.2.0). The heatmap shows the conservation of seven T6SS genes according to BLASTn results; ‘Good match’ in purple indicates a minimum 99.9% query coverage and nucleotide identity, ‘Partial match’ in yellow indicates coverage and identity of less than 99.9% but more than 80%, ‘No match’ in green indicates coverage and identity of less than 80%. The heatmap has been separated according to which T6SS loci the genes were located in, in the KPNIH1 chromosome (parental strain of MKP103): T6SS-1 includes tssB-1, tssC-1, hcp-1, vgrG-1, tssM-1; T6SS-2 includes tssM-2; and the additional hcp gene which did not sit in a region with other T6SS-associated genes. The phylogenetic tree and BLASTn results were visualized in R using the R packages ape (v5.4–1) (Paradis et al., 2004), phytools (v0.7–70) (Revell, 2012), ggplot2 (Wickham, 2009), ggtree (v1.16.6) (Yan et al., 2019), RColorBrewer (v1.1–2), and viridis (v0.5.1). (D) The heatmap shows SNP counts in each of eight T6SS genes relative to KPNIH1. Colored asterisks indicate clinical Kp ST258 isolates (NR4643, NR5476, NR5076, NR5655, NR4957, NR5463, NR6210, NR6097, NR1686) which were also tested for T6SS gene expression in (E-F). (E-F) Expression of T6SS genes from MKP103, Kp ST258 respiratory isolates and ΔtssM-2 (control for tssM-2 expression) by qRT-PCR, n = 6 biological samples from 3 independent experiments except for ΔtssM-2, whereby n = 4 biological samples from 2 independent experiments, columns represent mean values ± SEM, statistical analysis for (E-F) was performed by one-way ANOVA for each gene; *P < 0.05, **P < 0.01, ***P < 0.001, ***P < 0.0001.

References

    1. Agius L, Meredith EJ, and Sherratt HS (1991). Stereospecificity of the inhibition by etomoxir of fatty acid and cholesterol synthesis in isolated rat hepatocytes. Biochem Pharmacol, 42, 1717–20. 10.1016/0006-2952(91)90507-2. - DOI - PubMed
    1. Ahn D, Bhushan G, Mcconville TH, Annavajhala MK, Soni RK, Wong Fok Lung T, Hofstaedter CE, Shah SS, Chong AM, Castano VG, et al. (2021). An acquired acyltransferase promotes Klebsiella pneumoniae ST258 respiratory infection. Cell reports, 35, 109196. 10.1016/j.celrep.2021.109196. - DOI - PMC - PubMed
    1. Ahn D, Penaloza H, Wang Z, Wickersham M, Parker D, Patel P, Koller A, Chen EI, Bueno SM, Uhlemann AC, et al. (2016). Acquired resistance to innate immune clearance promotes Klebsiella pneumoniae ST258 pulmonary infection. JCI Insight, 1, e89704. 10.1172/jci.insight.89704. - DOI - PMC - PubMed
    1. Altschul SF, Gish W, Miller W, Myers EW, and Lipman DJ (1990). Basic local alignment search tool. J Mol Biol, 215, 403–10. 10.1016/S0022-2836(05)80360-2. - DOI - PubMed
    1. Angelidis I, Simon LM, Fernandez IE, Strunz M, Mayr CH, Greiffo FR, Tsitsiridis G, Ansari M, Graf E, Strom TM, et al. (2019). An atlas of the aging lung mapped by single cell transcriptomics and deep tissue proteomics. Nat Commun, 10, 963. 10.1038/s41467-019-08831-9. - DOI - PMC - PubMed

Publication types