. 2022 Apr 12;13(1):1970.
doi: 10.1038/s41467-022-29539-3.

Distinct molecular and immune hallmarks of inflammatory arthritis induced by immune checkpoint inhibitors for cancer therapy

Affiliations

Distinct molecular and immune hallmarks of inflammatory arthritis induced by immune checkpoint inhibitors for cancer therapy

Sang T Kim et al. Nat Commun. .

Erratum in

Abstract

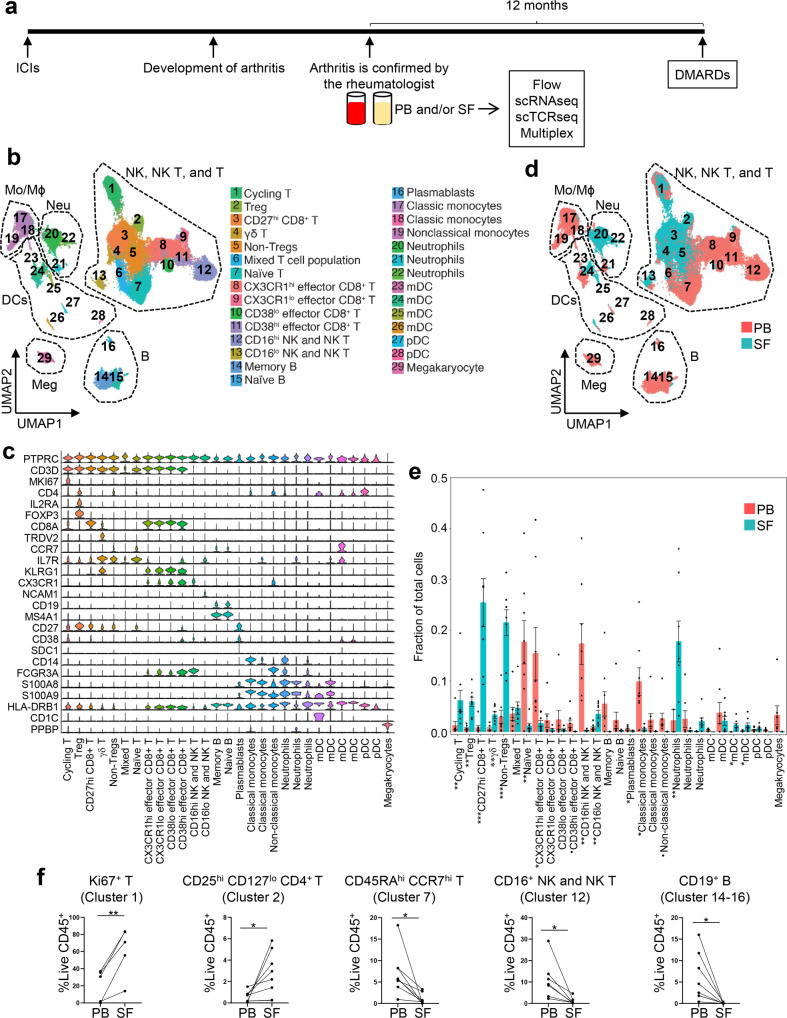
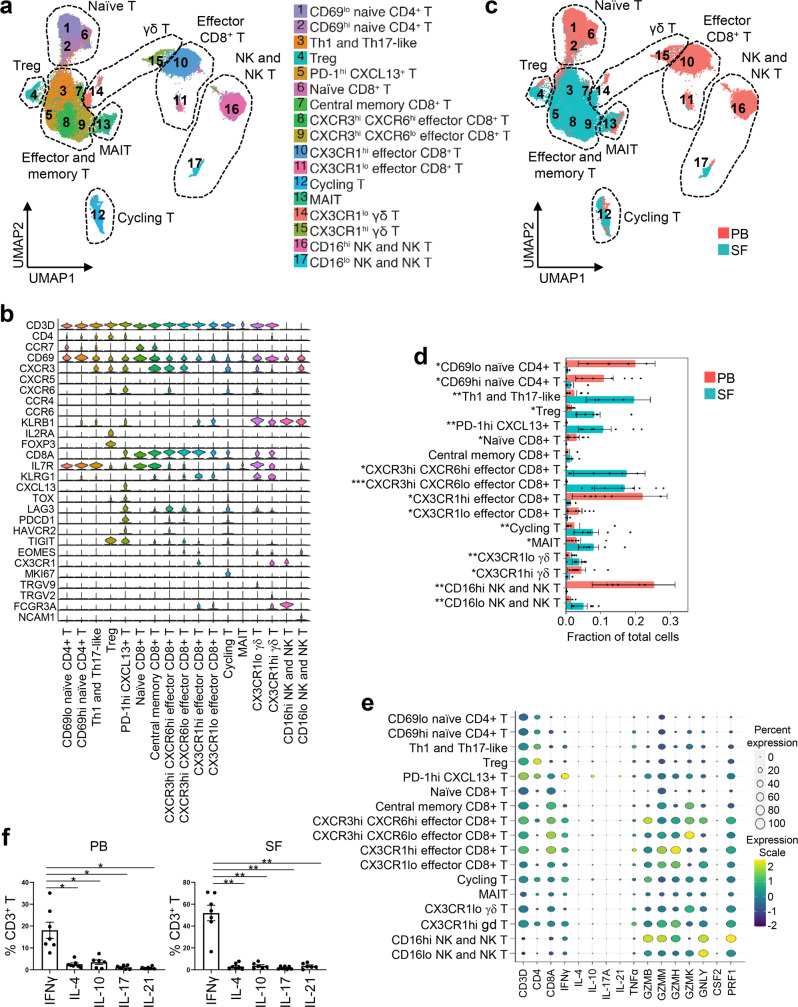
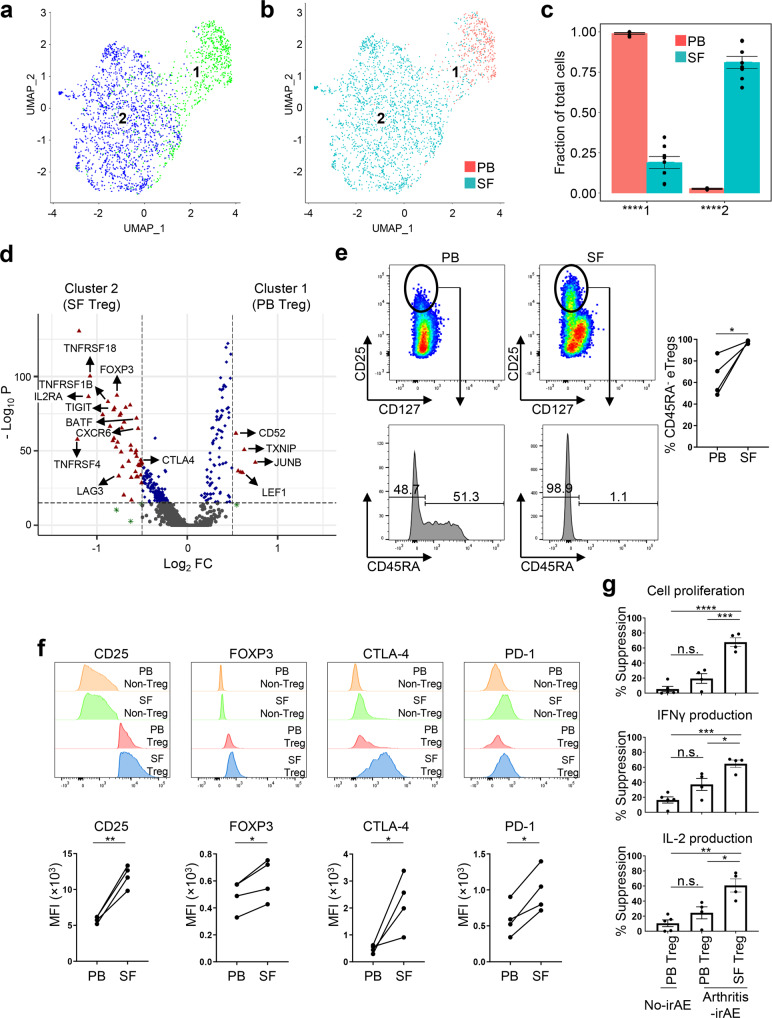
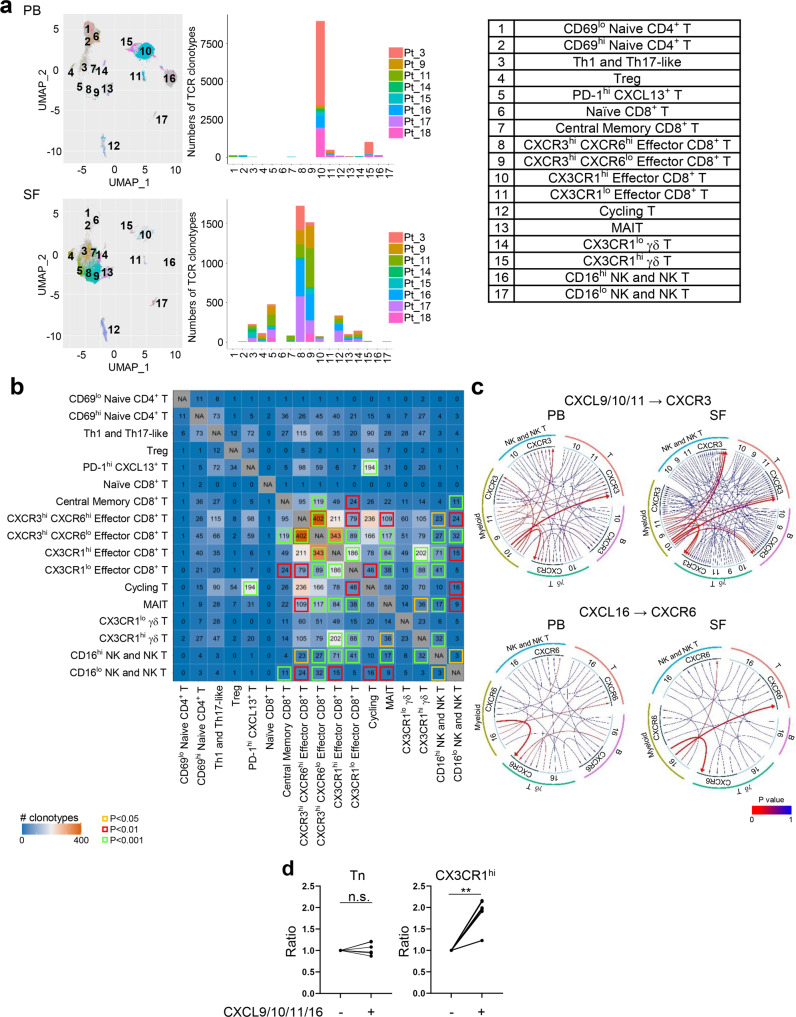
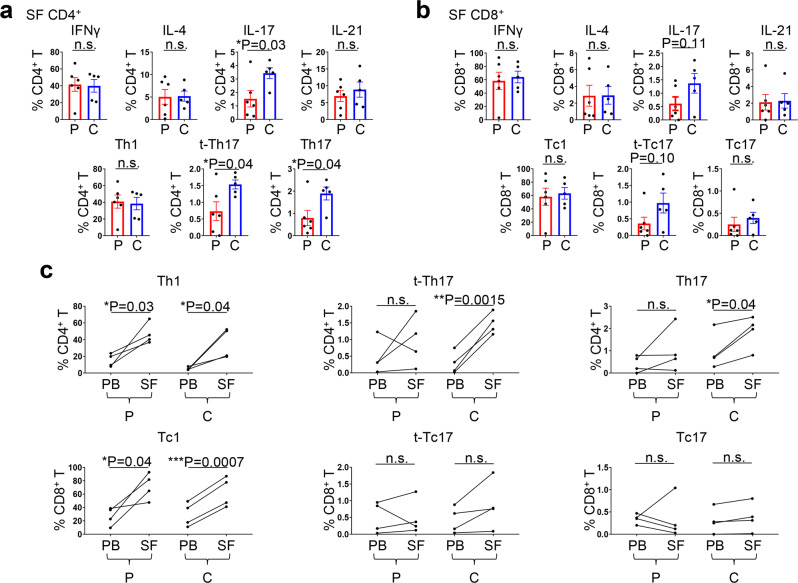
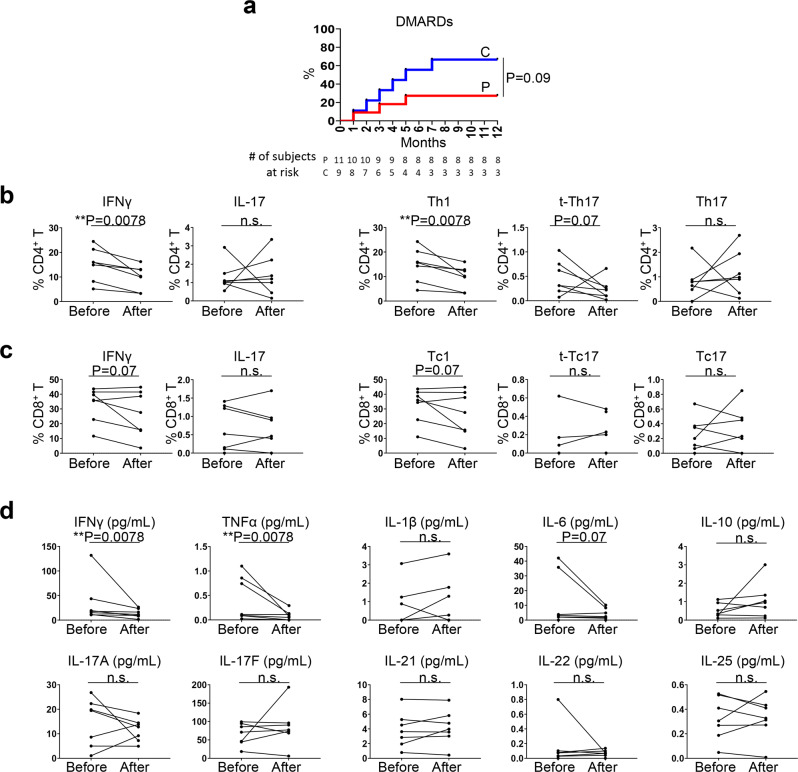
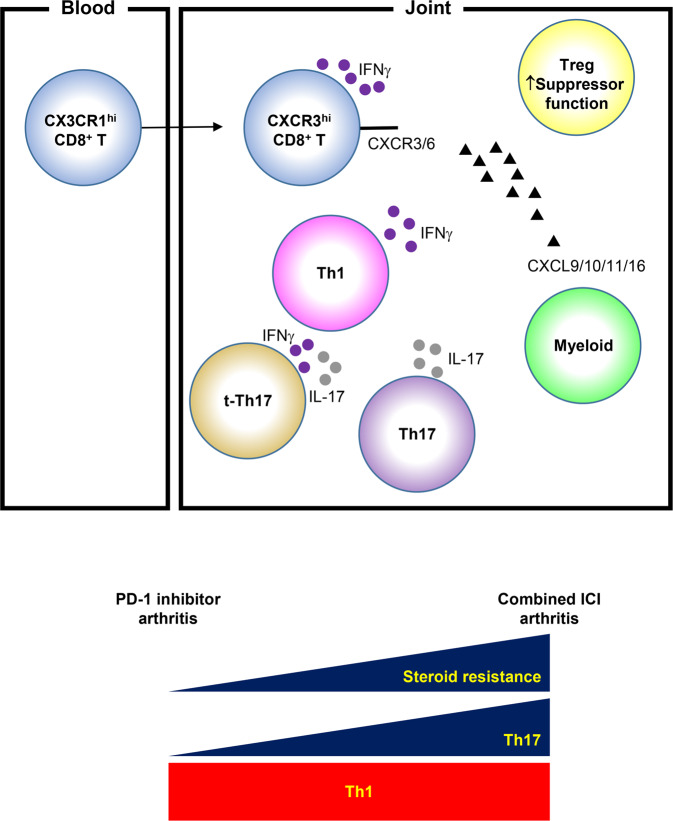
Immune checkpoint inhibitors are associated with immune-related adverse events (irAEs), including arthritis (arthritis-irAE). Management of arthritis-irAE is challenging because immunomodulatory therapy for arthritis should not impede antitumor immunity. Understanding of the mechanisms of arthritis-irAE is critical to overcome this challenge, but the pathophysiology remains unknown. Here, we comprehensively analyze peripheral blood and/or synovial fluid samples from 20 patients with arthritis-irAE, and unmask a prominent Th1-CD8+ T cell axis in both blood and inflamed joints. CX3CR1hi CD8+ T cells in blood and CXCR3hi CD8+ T cells in synovial fluid, the most clonally expanded T cells, significantly share TCR repertoires. The migration of blood CX3CR1hi CD8+ T cells into joints is possibly mediated by CXCL9/10/11/16 expressed by myeloid cells. Furthermore, arthritis after combined CTLA-4 and PD-1 inhibitor therapy preferentially has enhanced Th17 and transient Th1/Th17 cell signatures. Our data provide insights into the mechanisms, predictive biomarkers, and therapeutic targets for arthritis-irAE.


Conflict of interest statement

M.S.-A. has served as a consultant for Gilead, Avenue Therapeutics, ChemoCentryx, Pfizer, Eli Lilly and Bristol Myers Squibb. N.A.-W. has received honoraria for serving on a scientific advisory board for ChemoCentryx and served as a consultant for ChemoCentryx. S.S.N. has received personal fees from Kite, a Gilead Company, Merck, Bristol Myers Squibb, Novartis, Celgene, Pfizer, Allogene Therapeutics, Sellas Life Sciences, Cell Medica/Kuur/Athenex, Incyte, Precision Biosciences, Legend Biotech, Adicet Bio, Calibr, Unum Therapeutics, Bluebird Bio, and Sana Biotechnology; research support from Kite, a Gilead Company, Bristol Myers Squibb, Merck, Poseida, Cellectis, Celgene, Karus Therapeutics, Unum Therapeutics, Allogene Therapeutics, Precision Biosciences, Acerta, and Adicet Bio; royalties from Takeda Pharmaceuticals; and has intellectual property related to cell therapy. M.T.C. has received honoraria for serve on a Scientific Advisory Board for Astellas, Eisai, EMD Serono, Exelixis, Genentech, Pfizer, Seattle Genetics, served as a consultant for ApricityHealth, Exelixis, Pfizer, non-branded educational programs supported by Bristol Myers Squibb, Exelixis, Merck, Pfizer, Roche, and research funding for clinical trials from ApricityHealth, AstraZeneca, EMD Serono/Pfizer, Exelixis, and Janssen. D.L.G. declares advisory board work for Janssen, AstraZeneca, GlaxoSmithKline and Sanofi. D.L.G. receives research grant funding from AstraZeneca, Janssen, Astellas, Ribon Therapeutics, NGM Therapeutics and Takeda. M.A. declares advisory board work for GlaxoSmithKline, Shattuck Lab, Bristol Myers Squibb, AstraZeneca. M.A. has received speaker fees from AstraZeneca, and Nektar Therapeutics. M.A. received research funding from Genentech, Nektar Therapeutics, Merck, GlaxoSmithKline, Novartis, Jounce Therapeutics, Bristol Myers Squibb, Eli Lilly, Adaptimmune, and Shattuck Lab. S.N.W. received research grants to the institution from AstraZeneca, Clovis Oncology, GSK/Tesaro, Roche/Genentech, Novartis, Cotinga Pharmaceuticals, Bayer, Bio-Path, and ArQule, and received consulting fees from AstraZeneca, Clovis Oncology, GSK/Tesaro, Roche/Genentech, Novartis, Merck, Pfizer, Eisai, Zentalis, Circulogene, and Agenus. A.N. received research grants to the institution from NCI, EMD Serono, MedImmune, Healios Onc. Nutrition, Atterocor/Millendo, Amplimmune, ARMO BioSciences, Karyopharm Therapeutics, Incyte, Novartis, Regeneron, Merck, Bristol- Myers Squibb, Pfizer, CytomX Therapeutics, Neon Therapeutics, Calithera Biosciences, TopAlliance Biosciences, Eli Lilly, Kymab, PsiOxus, Arcus Biosciences, NeoImmuneTech, ImmuneOncia, Surface Oncology, Monopteros Therapeutics, BioNTech SE, Seven & Eight Biopharma, and SOTIO Biotech AG. M.A.D. has been a consultant to Roche/Genentech, Array, Pfizer, Novartis, BMS, GSK, Sanofi-Aventis, Vaccinex, Apexigen, Eisai, and ABM Therapeutics, and he has been the PI of research grants to MD Anderson by Roche/Genentech, GSK, Sanofi-Aventis, Merck, Myriad, and Oncothyreon. T.C. has received speakers’ fees from the Society for Immunotherapy of Cancer, Bristol Myers Squibb, Roche, Medscape Oncology and PeerView Institute for Medical Education; reports consulting/advisory role fees from MedImmune, AstraZeneca, Bristol Myers Squibb, Merck & Co., Genentech, Arrowhead Pharmaceuticals and EMD Serono; reports institutional clinical research funding from Boehringer Ingelheim, MedImmune, AstraZeneca, EMD Serono, and Bristol Myers Squibb. The remaining authors declare no competing interests.

Figures

Fig. 1
Fig. 1. Peripheral blood (PB) and synovial fluid (SF) exhibit distinctive immune cell landscapes in arthritis as an immune-related adverse event.
a Project outline. Created by authors using PowerPoint. ICI, immune checkpoint inhibitor; scRNAseq, single cell RNA sequencing; scTCRseq, single cell T cell receptor sequencing; DMARD, disease-modifying anti-rheumatic drug. b UMAP view of 6 major cell lineages and 29 cell subsets. Each dot represents a single cell that is color-coded by cluster ID. Mo, Monocytes; Mϕ, macrophages; NK, natural killer cells; Neu, neutrophils; DCs, dendritic cells; Meg, megakaryocytes; B, B cells; T, T cells; Treg, regulatory T cells; mDC, myeloid dendritic cells; pDC, plasmacytoid dendritic cells. c Gene expression of canonical markers across clusters. See Supplementary Data 2 for all differentially expressed genes. d Identification of cell clusters distinctly present in PB or SF. The cells are color-coded by their sample origins. e Quantification of cell clusters and comparison of the cellular fraction of each cluster between PB (n = 8) and matching SF samples. Two-sided unpaired t test. Cycling T cells, **P = 0.009; Tregs, **P = 0.0014; CD27hi CD8+ T cells, ***P = 0.0008; γδ T cells, **P = 0.004; non-Tregs, ***P = 0.0007; naïve T cells, **P = 0.007; CX3CR1hi effector CD8+ T cells, *P = 0.038; CD38hi effector CD8+ T cells, P = 0.059; CD16hi natural killer (NK)/NK T cells, **P = 0.003; CD16lo NK/NK T cells, **P = 0.003; Plasmablasts, *P = 0.032; Classical monocytes (left), *P = 0.011; Non-classical monocytes, P = 0.064; neutrophils (left), **P = 0.0055; myeloid dendritic cells (mDCs; third from the left), *P = 0.011; mDC (fourth from the left), *P = 0.043. Bars indicate the mean and SEM. f Flow cytometry analysis to quantify proportions of Ki67+ T cells (n = 5), CD25hi CD127lo CD4+ T cells (n = 8), CD45RAhi CCR7hi T cells (n = 8), CD16hi NK and NK T cells (n = 7), and CD19+ B cells (n = 8) from PB and matching SF samples. Two-sided paired t test. (left to right) **P = 0.0068, *P = 0.0280, *P = 0.0164, *P = 0.0237, *P = 0.0214. Source data are provided as a Source Data file.
Fig. 2
Fig. 2. Interferon gamma (IFNγ)-producing Th1/Tc1 cells might play a role in arthritis as an immune-related adverse event, according to subcluster analysis of T, natural killer (NK), and NK T cells.
a Identification of 17 subclusters of NK, NK T, and T cell populations across all samples and annotation of the subclusters. Treg, regulatory T cells; MAIT, mucosal-associated invariant T cells. b Gene expression of canonical markers across subclusters. See Supplementary Data 3 for all differentially expressed genes. c Identification of subclusters distinctly present in PB or SF. d Quantification of the subclusters and comparison of the cellular fraction of each cluster between PB and SF samples. n = 8 PB and matching SF samples. Two-sided unpaired t test. CD69lo naïve CD4+ T cells, *P = 0.011; CD69hi naïve CD4+ T cells, *P = 0.016; Th1 and Th17-like, **P = 0.009; Treg, *P = 0.011; PD-1hi CXCL13+ T cells, **P = 0.003; Naïve CD8+ T cells, *P = 0.010; CXCR3hi CXCR6hi effector CD8+ T cells, *P = 0.014; CXCR3hi CXCR6lo effector CD8+ T cells, ***P = 0.0008; CX3CR1hi effector CD8+ T cells, *P = 0.021; CX3CR1lo effector CD8+ T cells, *P = 0.020; Cycling T, **P = 0.0012; MAIT, *P = 0.028; CX3CR1lo γδ T cells. **P = 0.005; CX3CR1hi γδ T cells, *P = 0.022; CD16hi NK/NK T cells, **P = 0.004; CD16lo NK/NK T cells, **P = 0.003. Bars indicate the mean and SEM. e Bubble plots showing expression levels and frequencies of key effector T cell cytokines and inflammatory molecules across subclusters. n = 8 PB and matching SF samples. f Flow cytometry analysis to quantify cytokine-producing T cells after stimulation with PMA and ionomycin for 4 h. n = 6 (PB IL-10; SF IL-10; SF IL-21) or n = 7 (PB IFNγ; PB IL-4; PB IL-17; PB IL-21; SF IFNγ; SF IL-4; SF IL-17). One-way analysis of variance. *P < 0.05, **P < 0.01. PB (left to right): *P = 0.0245, *P = 0.0267, *P = 0.0102, *P = 0.0125. SF (left to right): **P = 0.0011, **P = 0.0041, **P = 0.0013, **P = 0.0030. Bars indicate the mean and SEM. Source data are provided as a Source Data file.
Fig. 3
Fig. 3. Regulatory T cells (Tregs) are enriched and have enhanced suppressive functions in synovial fluid (SF) of patients with arthritis as an immune-related adverse event.
a, b Identification of two subclusters of Tregs and compartmental distribution of Treg subclusters. c Quantification of the subclusters and comparison of their cellular fractions between 8 peripheral blood (PB) and SF samples. Two-sided unpaired t test. Subcluester 1, ****P < 0.0001; Subcluster 2, ****P < 0.0001. Bars indicate the mean and SEM. d Volcano plot showing differentially expressed genes between PB Tregs and SF Tregs. FC, fold change. See Supplementary Data 4 for all differentially expressed genes (DEGs) and Supplementary Data 5 for DEGs with log2 fold changes >0.5 or < −0.5 and -log10 P > 15. e Representative flow cytometry plots of Tregs (left panels) and quantification analysis (right panel). n = 4 PB and matching SF samples. Two-sided paired t test. *P = 0.0354. f Mean fluorescence intensity (MFI) of CD25, FOXP3, CTLA-4, and PD-1 on non-Tregs (CD25lo CD127hi/lo) and Tregs (CD25hi CD127lo). Representative flow cytometry plots (upper panels) and quantification analysis (lower panel) are shown. n = 4 PB and matching SF samples. Two-sided paired t test. CD25, **P = 0.0030; FOXP3, *P = 0.0224; CTLA-4, *P = 0.0460; PD-1, *P = 0.0116. g Suppression of polyclonal response of naïve CD4+ T cells with autologous PB Tregs or SF Tregs. The percentage of suppression of cell proliferation (CFSE dilution) and cytokine production were calculated as described in the Methods. Parallel experiments were performed with PB Tregs from patients in the no-irAE group. n = 4 PB and matching SF samples from arthritis-irAE patients; n = 5 PB samples from no-irAE patients. One-way analysis of variance. Cell proliferation, ***P = 0.0002, ****P < 0.0001; IFNγ production, *P = 0.0201, ***P = 0.0003; IL-2 production, *P = 0.0130, **P = 0.0011. Bars indicate the mean and SEM. IFNγ, interferon gamma; IL-2, interleukin-2. Source data are provided as a Source Data file.
Fig. 4
Fig. 4. CXCR3hi CXCR6hi/lo effector CD8+ T cells, recruited via CXCL9/10/11 and CXCL16 secreted by myeloid cells, may contribute pathogenesis of arthritis as an immune-related adverse event.
a UMAP view of the distribution of top 100 expanded T cell clones in natural killer (NK), NK T, and T cell clusters (left), number of top 100 expanded T cell clones across clusters from each patient (middle), and annotation of the 17 cell clusters (right). n = 8 PB and matching SF samples. PB, peripheral blood; SF, synovial fluid; TCR, T cell receptor; Treg, regulatory T cells; MAIT, mucosal-associated invariant T cells. b Heatmap showing T cell repertoire overlap across clusters. Numbers indicate the number of shared clonotypes between each cluster pair. Statistically significant overlap of T cell clones is indicated by colored boxes, based on a one-sided Fisher’s Exact test followed by adjusting the false discovery rate using the Benjamini-Hochberg method. n = 8 PB and matching SF samples. c Circos plots showing interactions between major immune cells subsets via chemokine receptors (CXCR3 and CXCR6) and their ligands (CXCL9/10/11 and CXCL16). The lines were colored based on their statistically significance and the weight of the lines denotes their corresponding gene expression levels, the higher the expression level, the thicker the line. n = 8 PB and matching SF samples. d Ratio of migrated cells in response to CXCL9/10/11/16 to migrated cells in the absence of the chemokines. n = 6 PB samples from arthritis-irAE patients. Tn: naïve CD8+ T cells; CX3CR1hi, CX3CR1hi effector CD8+ T cells. Two-sided paired t test. CX3CR1hi, **P = 0.0014. Source data are provided as a Source Data file.
Fig. 5
Fig. 5. Th17 cells are enriched in the synovial fluid (SF) of patients who develop arthritis after combined immune checkpoint inhibitor (ICI) therapy.
a Percentage of CD4+ T cells in SF producing key effector cytokines (upper panels) and percentage of Th1, transient (t-)Th17, and Th17 cells (lower panels). Two-sided unpaired t test. *P < 0.05. Bars indicate the mean and SEM. IFNγ, interferon gamma; IL, interleukin. See Supplementary Table 2 for demographic and clinical profiles of patients who developed arthritis after PD-1 inhibitor monotherapy (PD-1 inhibitor arthritis; P in the figure) and patients who developed arthritis after combined CTLA-4 and PD-1 inhibitor therapy (combined ICI arthritis; C in the figure). n = 6 from the PD-1 arthritis group and 5 from the combined ICI arthritis group. b Percentage of CD8+ T cells in SF producing key effector cytokines (upper panels) and percentage of Tc1, t-Tc17, and Tc17 cells (lower panels). Two-sided unpaired t test. Bars indicate the mean and SEM. n = 6 from the PD-1 arthritis group and 5 from the combined ICI arthritis group. c Frequencies of Th1/Tc1, t-Th17/t-Tc17, and Th17/Tc17 cells in 4 peripheral blood (PB) and matching SF samples. Two-sided paired t test. Source data are provided as a Source Data file.
Fig. 6
Fig. 6. Th17 and Tc17 cells are steroid-resistant.
a Kaplan–Meier curves showing the proportion of patients whose steroid monotherapy failed and warranted disease-modifying anti-rheumatic drugs (DMARDs) over 12 months of follow-up based on ICI regimen. Two-sided Log rank test. P, PD-1 inhibitor arthritis; C, Combined ICI arthritis. b Percentage of interferon gamma (IFNγ)- and interleukin (IL)-17–producing CD4+ T cells in PB (left panels) and Th1, transient (t-)Th17, and Th17 cells (right panels) before and after treatment of arthritis from 7 patients with arthritis-irAE. One-sided Wilcoxon matched-pairs signed-rank test. c Percentage of IFNγ- and IL-17–producing CD8+ T cells in PB (left panels) and Tc1, t-Tc17, and Tc17 cells (right panels) before and after treatment of arthritis from 7 patients with arthritis-irAE. One-sided Wilcoxon matched-pairs signed-rank test. d Concentration of inflammatory cytokines in serum before and after treatment of arthritis from 7 patients with arthritis-irAE. One-sided Wilcoxon matched-pairs signed-rank test. Source data are provided as a Source Data file.
Fig. 7
Fig. 7. Graphical abstract of the study.
ICI immune checkpoint inhibitors; IFNγ interferon gamma.

References

    1. Suarez-Almazor ME, Kim ST, Abdel-Wahab N, Diab A. Review: immune-related adverse events with use of checkpoint inhibitors for immunotherapy of cancer. Arthritis Rheumatol. 2017;69:687–699. doi: 10.1002/art.40043. - DOI - PubMed
    1. Khoja L, Day D, Wei-Wu Chen T, Siu LL, Hansen AR. Tumour- and class-specific patterns of immune-related adverse events of immune checkpoint inhibitors: a systematic review. Ann. Oncol. 2017;28:2377–2385. doi: 10.1093/annonc/mdx286. - DOI - PubMed
    1. Calabrese LH, Calabrese C, Cappelli LC. Rheumatic immune-related adverse events from cancer immunotherapy. Nat. Rev. Rheumatol. 2018;14:569–579. doi: 10.1038/s41584-018-0074-9. - DOI - PubMed
    1. Boutros C, et al. Safety profiles of anti-CTLA-4 and anti-PD-1 antibodies alone and in combination. Nat. Rev. Clin. Oncol. 2016;13:473–486. doi: 10.1038/nrclinonc.2016.58. - DOI - PubMed
    1. Subedi, A., Strauss, J. & Gupta, S. Erosive deforming inflammatory arthritis in a patient with cervical adenocarcinoma. JAMA Oncol.5,1628–1629 (2019). - PubMed

Publication types

MeSH terms

Substances