. 2022 Apr 12;23(1):93.
doi: 10.1186/s13059-022-02665-3.

Strand asymmetry influences mismatch resolution during a single-strand annealing

Affiliations

Strand asymmetry influences mismatch resolution during a single-strand annealing

Victoria O Pokusaeva et al. Genome Biol. .

Abstract

Background: Biases of DNA repair can shape the nucleotide landscape of genomes at evolutionary timescales. The molecular mechanisms of those biases are still poorly understood because it is difficult to isolate the contributions of DNA repair from those of DNA damage.

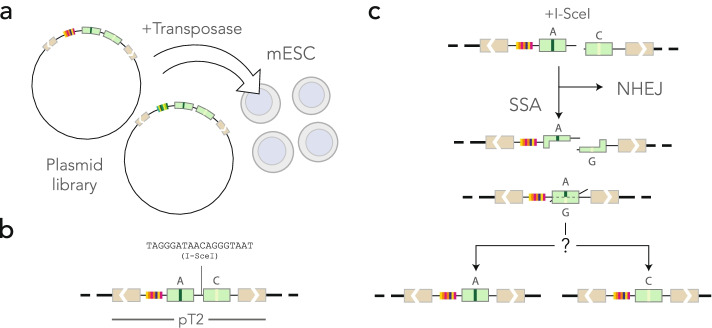
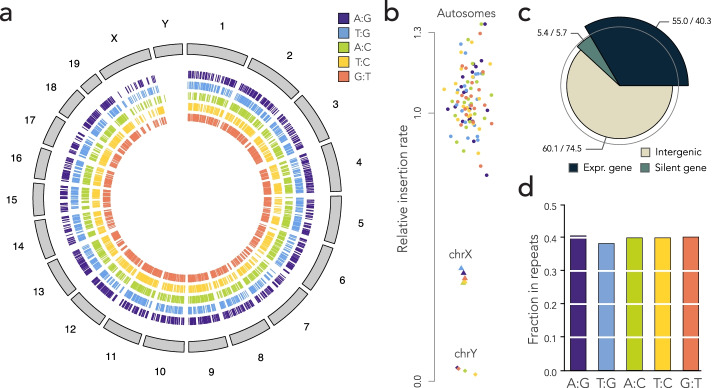
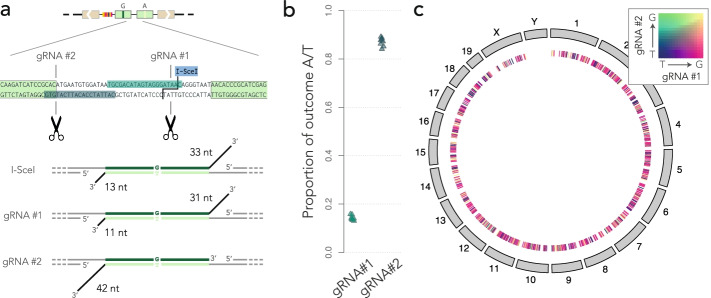
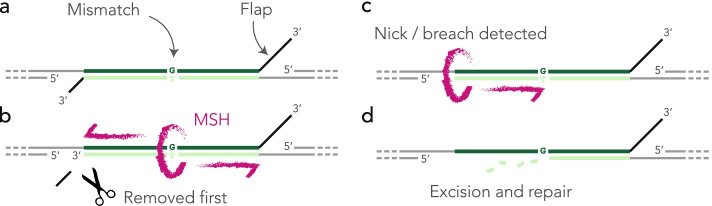
Results: Here, we develop a genome-wide assay whereby the same DNA lesion is repaired in different genomic contexts. We insert thousands of barcoded transposons carrying a reporter of DNA mismatch repair in the genome of mouse embryonic stem cells. Upon inducing a double-strand break between tandem repeats, a mismatch is generated if the break is repaired through single-strand annealing. The resolution of the mismatch showed a 60-80% bias in favor of the strand with the longest 3' flap. The location of the lesion in the genome and the type of mismatch had little influence on the bias. Instead, we observe a complete reversal of the bias when the longest 3' flap is moved to the opposite strand by changing the position of the double-strand break in the reporter.

Conclusions: These results suggest that the processing of the double-strand break has a major influence on the repair of mismatches during a single-strand annealing.

Keywords: Chromatin; Genome-wide technologies; Mismatch repair; Mouse embryonic stem cells; Single-strand annealing.


Conflict of interest statement

The authors declare that they have no competing interests.

Figures

Fig. 1
Fig. 1
Experimental approach. a Mouse ES cells in culture are co-transfected with a barcoded reporter library and with the Sleeping Beauty 100X transposase. b The reporters in the pT2 transposon backbone are integrated at random in the mouse genome. c Mismatches occur during the repair of a double-strand break induced by the transient expression of I-SceI. If the double-strand break is repaired through non-homologous end joining (NHEJ), no mismatch is formed. If it is repaired by single-strand annealing (SSA), a mismatch is formed and repaired in favor of one of the two nucleotides. Sequencing the construct reveals the outcome of DNA repair at different locations identified through the barcode
Fig. 2
Fig. 2
Mapping of the reporters. a Overview of the insertions. For each construct, 1000 insertions were drawn at random and plotted on a circular representation of the mouse genome. Each tick mark represents a mapped insertion. b Dot plot of the relative insertion rate per chromosome. For each chromosome and each construct, the insertion rate was computed as the number of insertions per bp, normalized by the expected number of insertions under the uniform model. c Insertions relative to genes. The spie chart represents the global number of observed vs expected insertions inside and outside genes. The area of a wedge is proportional to the observed value, and its angle is proportional to the expected value (so depleted categories are within the gray circle and enriched categories protrude outside). The numbers represent observed over expected insertions, expressed in thousand. d Insertion sites in repeats. The bar plot shows the proportion of barcodes mapping to repeated sequences (see Table 1)
Fig. 3
Fig. 3
Measure of repair biases. a Quantification methods. In UMI-LA (left), barcoded reporters are amplified by 50 cycles of linear amplification using a primer decorated by UMIs. In UMI-PCR (right), reporters are amplified by 6 PCR cycles where one primer is decorated by UMIs. Either way, the products are further amplified by regular PCR. After sequencing, each barcode is associated with several UMIs, themselves associated with alleles. Repair biases are quantified by giving one vote per UMI. b Repair outcome. The dot plot shows the measured bias toward A or T (whichever applies) in each technical replicate. For each construct, data points obtained 24 and 48 h post I-SceI induction are shown on the left and on the right, respectively. c Graphical summary of the results. The nucleotide of the top strand is most frequently kept during the resolution of the mismatch
Fig. 4
Fig. 4
Global differences between reporters. a Repair across replicates. Each row shows a random barcode from the G:T construct, and each column shows a replicate where it appears. The color of the rectangle indicates the repair outcome. Without I-SceI induction (Mock), barcodes are typically present in more than two replicates, always with the same outcome. Twenty-four or 48 h post-I-SceI induction, barcodes are typically present in two replicates with different outcomes. The results are similar for all the constructs (not shown). b Amplification of unrepaired mismatches. If the mismatch is unrepaired, UMI-LA (left) produces UMIs with the allele of the top strand only, whereas UMI-PCR produces UMIs with both alleles. c Conflicts among UMIs. The dot plot shows the proportion of barcodes such that at least one UMI reports a different allele than the majority. Colors and symbols are the same as in Fig. 3b. d Mutual information between replicates. The bar graph shows the average mutual information per barcode between pairs of replicates (experiments with the T:C construct had only 100 pairs, compared to > 1000 pairs for the other constructs and the no I-SceI controls)
Fig. 5
Fig. 5
Mismatch resolution and chromatin context. a Biases in genomic contexts. The dot plot shows the measured bias toward T with the G:T construct. Expressed genes, silent genes, and intergenic regions are the same as in Fig. 2c. b Biases in chromatin contexts. Same representation as in a for chromatin marks. The P-values of a two-tailed Student’s t test for coefficients in linear models are indicated if they are below 0.01. c Architecture of the artificial neural network. Vertical cartridges represent neuron layers with indicated dimensions. The blue arrows indicate the forward information flow. d Learning curves for the full data set. The median loss on the test set is shown in green for 100 trainings with random restart. The interval between the 1st and 99th percentile is shown by the green shaded area. The median loss for the null model without chromatin features is shown in brown, and percentiles are shown by the brown shaded area. e Learning curves for the local GC content. The repair outcome was replaced by the GC content in a 10 kb window around the reporter. f Learning curves for conflicts among UMIs. The only observations used for learning are UMI-PCR 24 h post-I-SceI induction
Fig. 6
Fig. 6
Using CG>TG transitions during UMI-LA to infer methylation status. a Calibrating the deamination assay with a positive control. UMI-LA is performed on barcoded methylated oligonucleotides. Methylated cytosine can spontaneously deaminate at high temperature and be converted into thymine, thus producing conflicting UMIs. b Frequency of alterations during UMI-LA. The bar graph shows the percentage of barcodes with associated alterations found among their UMIs. c Principle of the assay. Uncut reporters in control experiments contain 19 CpGs that can be assayed as in a. d Dot plot showing the ratio of CG>TG transitions inside vs outside the CpGs of the F segments for four replicates. The average around 10 matches the 10-fold increase observed for methylated CpG in panel b. e Proportion of pristine reporters with CG>TG transitions in different chromatin contexts. Histone marks present at the insertion site are indicated on the x-axis. Dots indicate the local mean and vertical bars show the limits of a 99% confidence interval for this mean. The horizontal bar shows the global average of reporters with CG>TG transitions (the value around 20% is consistent with the baseline of Fig. 6b, taking into accounts that there are 19 CpG and 4 pooled replicates). P-values below 0.01 are indicated on the graph (two-tailed Student’s t test to compare proportions, n = 2182). Significant reductions of CG>TG transitions are observed in H3K27me3, H3K4me2, H3K4me3, and H3K9ac, all associated with active promoters in mouse ES cells
Fig. 7
Fig. 7
Mismatch resolution and flap asymmetry.a Sketch of the construct and of the guide RNAs used to induce double-strand breaks at alternative locations. b Global bias reversal. The dot plot shows the bias toward T with the G:T construct, measured by UMI-PCR 24 h after inducing a double-strand break with the guide RNAs shown in a. c Local bias reversal. The circular map of the mouse genomes shows a random sample of 1000 inserted G:T reporters where the final state after repair was known with both guide RNAs shown in a. Each tick mark represents an integrated reporter, and its color represents the outcome of both experiments, as per the heat map in the top right corner. Most tick marks are magenta, indicating that the reporter was repaired toward G when using guide RNA #1 and toward T when using guide RNA #2
Fig. 8
Fig. 8
First-nick model.a After resection of the 5′ ends and annealing of the complementary strands, unannealed flaps extend in 3′. b The MSH complex recognizes the mismatches and slides to initiate strand discrimination but the flaps jam the process. Shorter flaps tend to be removed earlier, allowing for strand discrimination. c The nick or breach exposed by the removal of the flap is recognized by the MSH complex that backtracks to initiate the repair of the mismatch. d The mismatch is repaired as usual by excising and re-synthesizing the strand

References

    1. Filipski J. Evolution of DNA sequence contributions of mutational bias and selection to the origin of chromosomal compartments. In: Obe G, editor. Advances in Mutagenesis Research. Berlin: Springer Berlin Heidelberg; 1990. pp. 1–54.
    1. Freese E. On the evolution of the base composition of DNA. J Theor Biol. 1962;3(1):82–101. doi: 10.1016/S0022-5193(62)80005-8. - DOI
    1. Sueoka N. On the genetic basis of variation and heterogeneity of DNA base composition. Proc Natl Acad Sci U S A. 1962;48:582–592. doi: 10.1073/pnas.48.4.582. - DOI - PMC - PubMed
    1. Sinsheimer RL. The action of pancreatic deoxyribonuclease. II. Isomeric dinucleotides. J Biol Chem. 1955;215(2):579–583. doi: 10.1016/S0021-9258(18)65979-4. - DOI - PubMed
    1. Gale JM, Nissen KA, Smerdon MJ. UV-induced formation of pyrimidine dimers in nucleosome core DNA is strongly modulated with a period of 10.3 bases. Proc Natl Acad Sci U S A. 1987;84(19):6644–6648. doi: 10.1073/pnas.84.19.6644. - DOI - PMC - PubMed

Publication types