

The national economic burden of rare disease in the United States in 2019
- PMID: 35414039
- PMCID: PMC9004040
- DOI: 10.1186/s13023-022-02299-5
The national economic burden of rare disease in the United States in 2019
Abstract
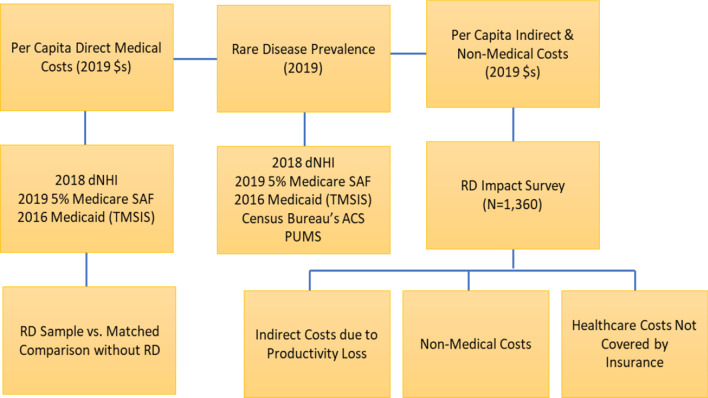
Background: To provide a comprehensive assessment of the total economic burden of rare diseases (RD) in the United States (U.S.) in 2019. We followed a prevalence-based approach that combined the prevalence of 379 RDs with the per-person direct medical and indirect costs, to derive the national economic burden by patient age and type of RD. To estimate the prevalence and the direct medical cost of RD, we used claims data from three sources: Medicare 5% Standard Analytical File, Transformed Medicaid Statistical Information System, and Optum claims data for the privately insured. To estimate indirect and non-medical cost components, we worked with the rare disease community to design and implement a primary survey.
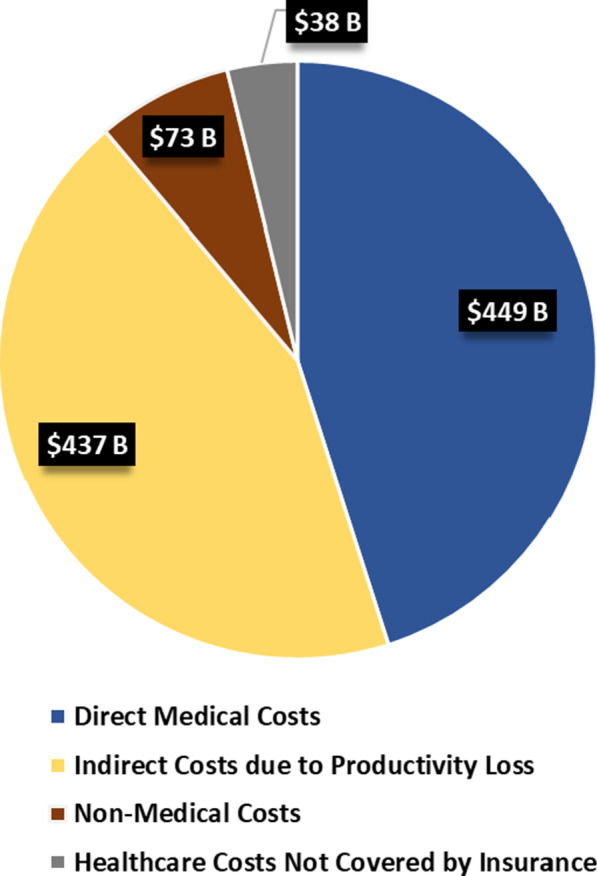
Results: There were an estimated 15.5 million U.S. children (N = 1,322,886) and adults (N = 14,222,299) with any of the 379 RDs in 2019 with a total economic burden of $997 billion, including a direct medical cost of $449 billion (45%), $437 billion (44%) in indirect costs, $73 billion in non-medical costs (7%), and $38 billion (4%) in healthcare costs not covered by insurance. The top drivers for excess medical costs associated with RD are hospital inpatient care and prescription medication; the top indirect cost categories are labor market productivity losses due to absenteeism, presenteeism, and early retirement.
Conclusions: Our findings highlight the scale of the RD economic burden and call for immediate attention from the scientific communities, policy leaders, and other key stakeholders such as health care providers and employers, to think innovatively and collectively, to identify new ways to help improve the care, management, and treatment of these often-devastating diseases.
Keywords: Direct cost; Economic burden; Indirect cost; Rare disease.
© 2022. The Author(s).
Conflict of interest statement
The authors declare that they have no competing interests.
Figures
References
-
- National Human Genome Research Institute. Rare diseases FAQ. January 10, 2020. https://www.genome.gov/FAQ/Rare-Diseases. Accessed 19 Apr 2021.
-
- Forshaw R. What is the cost of living with rare disease? https://raremark.com/articles/what-does-it-cost-to-live-with-a-rare-dise.... Accessed 29 Jan 2021.
-
- Therapies, Shire Human Genetic. Rare disease impact report: insights from patients and the medical community. Shire Human Genetic Therapies, Tech. Rep; 2013.
-
- Mighiu C, O'Hara S, Ferri Grazzi E, Murray KF, Schattenberg JM, Ventura E, Karakaidos M, Taylor A, Brrang H, Dhawan A, Willemse J, Finnegan A. Impact of progressive familial intrahepatic cholestasis on caregivers: caregiver-reported outcomes from the multinational PICTURE study. Orphanet J Rare Dis. 2022;17(1):32. doi: 10.1186/s13023-022-02177-0. - DOI - PMC - PubMed
Publication types
MeSH terms
LinkOut - more resources
Full Text Sources
Medical
Miscellaneous
