. 2022 Apr 12;13(1):1925.
doi: 10.1038/s41467-022-29203-w.

A machine learning algorithm with subclonal sensitivity reveals widespread pan-cancer human leukocyte antigen loss of heterozygosity

Affiliations

A machine learning algorithm with subclonal sensitivity reveals widespread pan-cancer human leukocyte antigen loss of heterozygosity

Rachel Marty Pyke et al. Nat Commun. .

Abstract

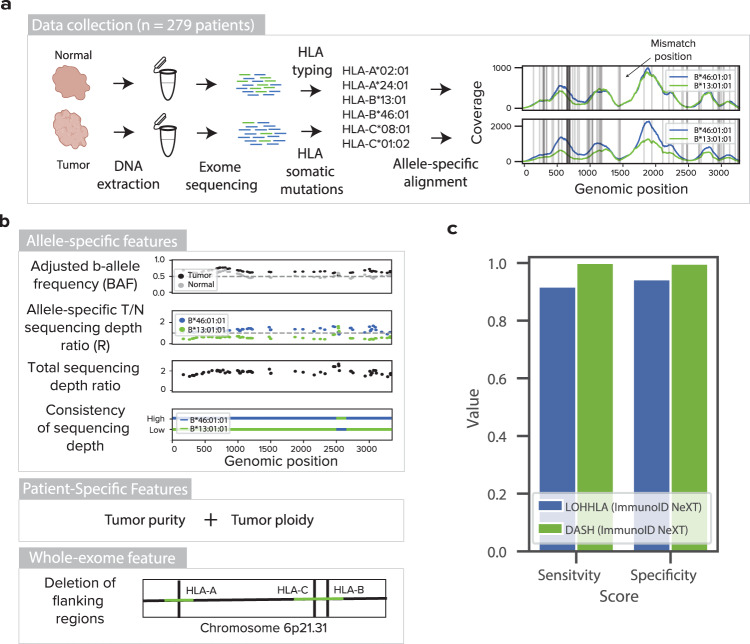
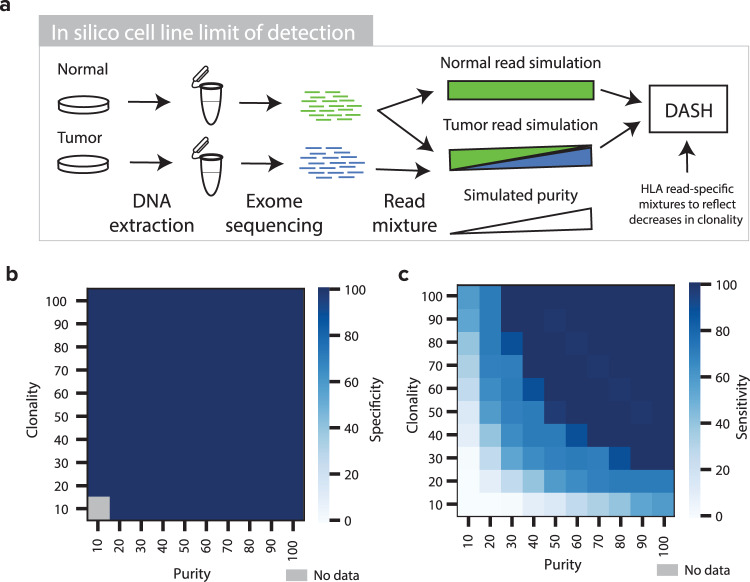
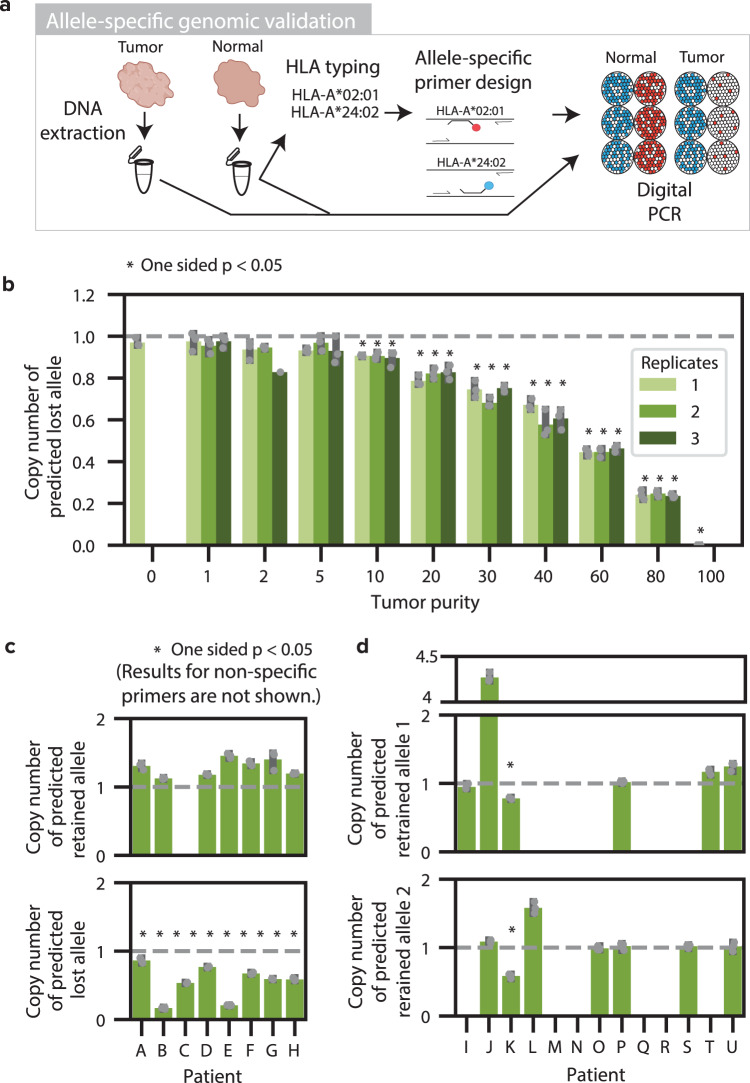
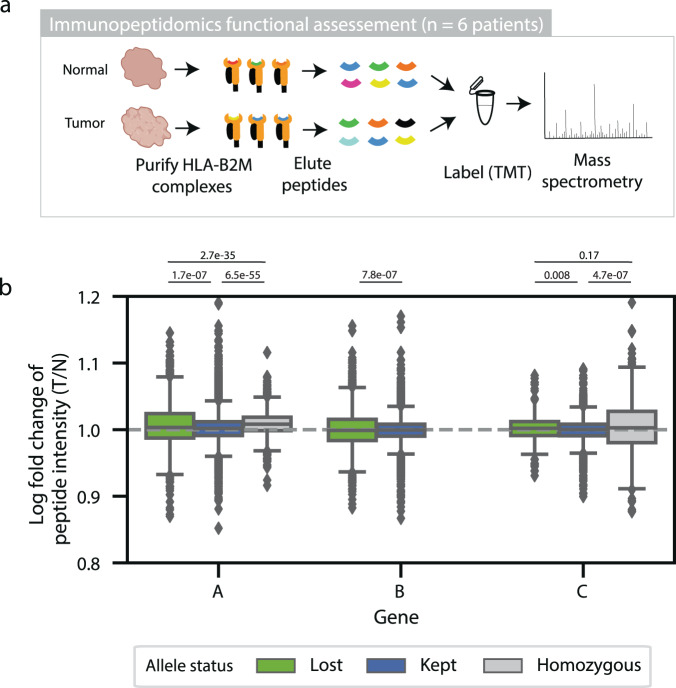
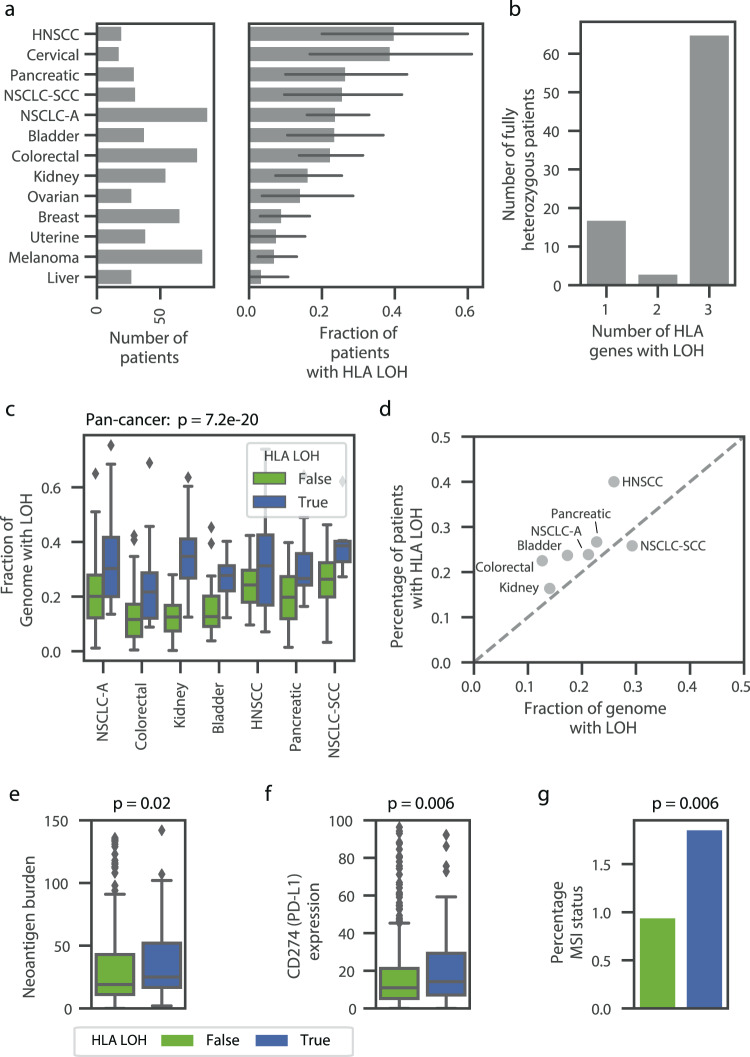
Human leukocyte antigen loss of heterozygosity (HLA LOH) allows cancer cells to escape immune recognition by deleting HLA alleles, causing the suppressed presentation of tumor neoantigens. Despite its importance in immunotherapy response, few methods exist to detect HLA LOH, and their accuracy is not well understood. Here, we develop DASH (Deletion of Allele-Specific HLAs), a machine learning-based algorithm to detect HLA LOH from paired tumor-normal sequencing data. With cell line mixtures, we demonstrate increased sensitivity compared to previously published tools. Moreover, our patient-specific digital PCR validation approach provides a sensitive, robust orthogonal approach that could be used for clinical validation. Using DASH on 610 patients across 15 tumor types, we find that 18% of patients have HLA LOH. Moreover, we show inflated HLA LOH rates compared to genome-wide LOH and correlations between CD274 (encodes PD-L1) expression and microsatellite instability status, suggesting the HLA LOH is a key immune resistance strategy.


Conflict of interest statement

R.M.P., D.M., S.D., C.W.A., L.M., D.P.B., S.V.Z., E.L., G.B., J.W., R.O.C. and S.M.B. are full time employees of Personalis. M.P.S. co-founded and is a scientific advisor for Personalis.

Figures

Fig. 1
Fig. 1. Training, performance, and limit of detection of DASH algorithm.
a Tumor and adjacent normal samples were collected for 279 patients. DNA was extracted and exome sequencing was performed. HLA typing was derived from the normal sample and HLA somatic mutations were obtained from the tumor sample. Reads mapping to an HLA reference database were assembled and mapped onto the patient-specific HLA alleles. Horizontal gray lines denote positions where the homologous alleles differ from each other. b Features used to train the DASH algorithm include the adjusted b-allele frequency, sequencing depth ratio, total sequencing depth ratio, consistency of sequencing depth, tumor purity, tumor ploidy and deletion of flanking regions. Dashed gray lines represent the expected values for a sample without copy number change. All features were used to train an XGBoost prediction model. c A bar plot showing the sensitivity and specificity of HLA LOH detection by DASH and LOHHLA for samples in the 10-fold cross validation data set. Both algorithms were tested on the HLA-enhanced ImmunoID NeXT Platform. Only samples with at least 20% tumor purity were included. Source data are provided with this paper.
Fig. 2
Fig. 2. In silico cell line mixtures to determine DASH limit of detection.
a A schematic showing the tumor and normal cell line mixing approach for simulating low-purity sample pairs. b and c Heatmaps showing the b specificity and c sensitivity of DASH to capture HLA LOH in simulated samples of differing purity and clonality. Dark blue denotes high sensitivity or specificity, light blue denotes low sensitivity or specificity and gray denotes no data. Source data are provided with this paper.
Fig. 3
Fig. 3. Allele-specific genomic validation with digital PCR.
a Allele-specific genomic validation was performed using paired tumor and adjacent normal fresh frozen samples. DNA was extracted from each sample. Allele-specific primers were designed specifically for each patient. Digital PCR was performed on each sample to orthogonally determine the allele-specific copy number. b Bar plot showing the allele-specific copy number of the predicted lost allele, relative to RNase P, as measured by dPCR for cell line mixtures of 11 varying tumor purities, with n = 3 technical replicates examined over three independent experiments per tumor purity (tumor purity 2 replicate 3 only had 1 independent experiment; tumor purity 0 and 100 only have 1 technical replicate). The dashed line denotes the expected value for no change in copy number. Asterisks denote a statistically significant difference (p < 0.05) from the copy number in the normal sample with a one-sided Student T test. c Bar plots denoting the HLA allele dPCR copy number relative to the multiplexed RNase P for 8 patient tumor samples with n = 3 technical replicates. The alleles predicted by DASH to be retained are shown on the top plot while the alleles predicted to be deleted are shown on the bottom plot. The dashed gray lines denote the expected copy number of one if there are no copy number alterations. Asterisks denote samples with p-values < 0.05 as determined by a one-sided Student T test. d Bar plots showing the HLA allele dPCR copy number relative to the multiplexed RNAse P for 13 patient tumor samples where both alleles were predicted to be retained with n = 3 technical replicates. Asterisks denote samples with p-values < 0.05 as determined by a one-sided Student T test. 95% confidence intervals are shown in gray. Source data and exact p values are provided with this paper in the Source Data file.
Fig. 4
Fig. 4. Functional immunopeptidomic validation.
a Functional immunopeptidomic validation was performed using paired tumor and adjacent normal fresh frozen samples. HLA-B2M complexes were purified from each sample and peptides were gently eluted. Peptides from each sample were labeled with TMT tags and measured using quantitative mass spectrometry. b Box plots showing the log2 fold change of peptide intensity between lost, kept, and homozygous alleles across all six patients. HLA-A is represented by 1490 peptides in the ‘lost’ category, 6613 peptides in the ‘kept’ category, and 2814 peptides in the ‘homozygous’ category. HLA-B is represented by 3823 peptides in the ‘lost’ category and 9910 peptides in the ‘kept’ category. HLA-C is represented by 703 peptides in the ‘lost’ category, 3421 peptides in the ‘kept’ category and 620 peptides in the ‘homozygous’ category. The center of the box denotes the median value, the box denotes the quartiles and the whiskers denote the remainder of the distribution apart from outliers. Statistical significance was assessed using a two-sided student T-test with asterisks denoting p-values < 0.05. Source data are provided with this paper.
Fig. 5
Fig. 5. Widespread impact of HLA LOH across tumor types.
a Bar plots denoting the number of patients and the frequency of HLA LOH in each tumor type cohort. Only cohorts with at least 10 patients are shown (see source data for precise n of each cohort). 95% confidence intervals are shown in dark gray. b A bar plot showing the number of patients with 1, 2, or 3 genes impacted by HLA LOH. Only patients that are fully heterozygous across HLA-A, HLA-B, and HLA-C are shown. c Boxplots showing the distribution of the fraction of each genome impacted by LOH. Each tumor type is divided into patients with HLA LOH and without HLA LOH. Only tumor types with at least 10 patients impacted by HLA LOH are shown (with n = 88 for NSCLC-A; 80 for Colorectal; 31 for NSCLC-SCC; 55 for Kidney; 38 for Bladder; 30 for Pancreatic; 20 for HNSCC). The center of the box denotes the median value, the box denotes the quartiles and the whiskers denote the remainder of the distribution apart from outliers. Statistical analyses are performed with two-sided Mann–Whitney U tests and are Bonferroni corrected (p = 7.2e−20). d A scatter plot showing the relationship between the average fraction of the genome impacted by LOH and the frequency of HLA LOH in each tumor type. The gray dashed line denotes x = y. e and f Box plots denoting the average difference for patients without HLA LOH (green) and patients with HLA LOH (blue) for e neoantigen burden (n = 468 patients) and f CD274 (PD-L1) expression (n = 605 patients). The center of the box denotes the median value, the box denotes the quartiles and the whiskers denote the remainder of the distribution apart from outliers. Some outliers are excluded from the plot in order to focus on the majority of the distribution. Statistical significance was assessed using a two-sided Mann–Whitney U test. g Bar plot denoting the average difference for patients without HLA LOH (green) and patients with HLA LOH (blue) for percentage of microsatellite sites with instability (n = 576 patients). Source data are provided with this paper. NSCLC-A non-small cell lung cancer adenocarcinoma, NSCLC-SCC non-small cell lung cancer squamous cell carcinoma, HNSCC head and neck squamous cell carcinoma.

References

    1. Hargadon KM, Johnson CE, Williams CJ. Immune checkpoint blockade therapy for cancer: an overview of FDA-approved immune checkpoint inhibitors. Int. Immunopharmacol. 2018;62:29–39. doi: 10.1016/j.intimp.2018.06.001. - DOI - PubMed
    1. Havel JJ, Chowell D, Chan TA. The evolving landscape of biomarkers for checkpoint inhibitor immunotherapy. Nat. Rev. Cancer. 2019;19:133–150. doi: 10.1038/s41568-019-0116-x. - DOI - PMC - PubMed
    1. Lesterhuis WJ, et al. Dynamic versus static biomarkers in cancer immune checkpoint blockade: unravelling complexity. Nat. Rev. Drug Discov. 2017;16:264–272. doi: 10.1038/nrd.2016.233. - DOI - PubMed
    1. Jenkins RW, Barbie DA, Flaherty KT. Mechanisms of resistance to immune checkpoint inhibitors. Br. J. Cancer. 2018;118:9–16. doi: 10.1038/bjc.2017.434. - DOI - PMC - PubMed
    1. Marty R, et al. MHC-I genotype restricts the oncogenic mutational landscape. Cell. 2017;171:1272–1283.e15. doi: 10.1016/j.cell.2017.09.050. - DOI - PMC - PubMed

Publication types

Substances