. 2022 Apr 12;12(1):6124.
doi: 10.1038/s41598-022-09857-8.

Optimal intervention strategies to mitigate the COVID-19 pandemic effects

Affiliations

Optimal intervention strategies to mitigate the COVID-19 pandemic effects

Andreas Kasis et al. Sci Rep. .

Abstract

Governments across the world are currently facing the task of selecting suitable intervention strategies to cope with the effects of the COVID-19 pandemic. This is a highly challenging task, since harsh measures may result in economic collapse while a relaxed strategy might lead to a high death toll. Motivated by this, we consider the problem of forming intervention strategies to mitigate the impact of the COVID-19 pandemic that optimize the trade-off between the number of deceases and the socio-economic costs. We demonstrate that the healthcare capacity and the testing rate highly affect the optimal intervention strategies. Moreover, we propose an approach that enables practical strategies, with a small number of policies and policy changes, that are close to optimal. In particular, we provide tools to decide which policies should be implemented and when should a government change to a different policy. Finally, we consider how the presented results are affected by uncertainty in the initial reproduction number and infection fatality rate and demonstrate that parametric uncertainty has a more substantial effect when stricter strategies are adopted.


Conflict of interest statement

The authors declare no competing interests.

Figures

Figure 1
Figure 1
The controlled SIDARE model. Schematic representation of the controlled SIDARE model, used to describe the evolution of the COVID-19 pandemic. The model splits the population into Susceptible, Infected undetected, infected Detected, Acutely symptomatic—threatened, Recovered and deceased—Extinct. Model parameters β,ξi,ξd,ν,γi,γd and γa describe the transition rates between the states. The effect of government interventions is described by u which limits the rate of infection. The rate at which the acutely symptomatic population deceases is described by μ¯, which depends on the healthcare system capacity.
Figure 2
Figure 2
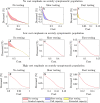
Deceased population vs. cost. Proportion of deceased population versus cost of optimal government intervention when the available healthcare capacity for COVID-19 patients is limited (red), full (blue), and extended (yellow) and when no testing (a,d,g), slow testing (b,e,h) and fast testing (c,f,i) policies are adopted. In addition, we present the cases where no emphasis (a–c), low emphasis (d–f) and high emphasis (g–i) is given to the cost associated with the acutely symptomatic population. When identical relations are obtained for different healthcare capacity levels, as in (e–i), then only the lowest capacity is presented. Shaded regions show the ranges of the relations between deceased population percentage and cost of government interaction when the healthcare capacity is between the limited and extended levels. All presented costs are normalised using as basis the cost of the optimal government strategy with no testing resulting to 0.01% deceases.
Figure 3
Figure 3
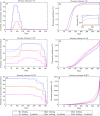
Optimal intervention strategies and deceased population. Optimal government intervention strategy (a,c,e) and proportion of deceased population (b,d,f) versus time for government strategies with 1% decease tolerance (a,b), 0.1% decease tolerance (c,d) and 0.01% decease tolerance (e,f) when (i) no testing (blue), (ii) slow testing (red) and (iii) fast testing (magenta) policies are adopted. The intensity of government intervention strategies corresponds to the strictness of government policies, where 0 corresponds to no interventions and 1 to the strictest possible intervention (e.g. a full scale lockdown). The approach to obtain the optimal continuous strategy is explained in the SI. Dotted plots correspond to optimized discrete implementations of the selected strategies by allowing a maximum of 4 policy levels and 6 policy changes. The distinct policy levels and the times where the policies changed were selected in an optimized way, as described in the “Methods” section and the SI (see Optimal control methodology, Algorithms 1 and 2 and Supplementary Figs. S1, S2). Implementations with 7 and 10 policy levels and 12 and 18 policy changes are presented in the SI (Supplementary Figs. S3–S10).
Figure 4
Figure 4
Additional cost from implementing a limited number of policies. Implementing a limited number of policies results in increased costs compared to the optimal continuously changing intervention strategy. This figure depicts the average and range of the percentage differences between the costs of the continuous strategies presented in Fig. 3 and strategies with a small number of policies, for different numbers of allowed distinct implemented policies. In each case, the number of allowed policy changes was twice the number of the implemented policies minus two. The boxed plot focuses on implementing between 4 and 8 distinct policies and demonstrates that 4 policies result in a cost difference of less than 1% in all cases.
Figure 5
Figure 5
Effect of uncertainty in the initial reproduction and infection fatality rates on the aggregate deceased population. Portion of aggregate deceased population for R¯0[3.17,3.38] and infection fatality rate ranging between 0.39 and 1.33% associated with decease tolerances of 1% (a,b), 0.1% (c–e) and 0.01% (f–h) when no (a,c,f), slow (b,d,g), and fast (e,h) testing policies are implemented. Fast testing always limits the deceases to less than 1% and hence there is no corresponding case. The values were acquired by applying in each case the optimal continuous government intervention strategy obtained with R¯0=3.27 and infection fatality rate of 0.66%. Dark red and dark blue colours correspond to aggregate deceases that are at least twice the adopted tolerance levels and zero respectively. Additional results that demonstrate the impact of parametric uncertainty in forming effective government mitigation strategies are provided in the SI (Supplementary Figs. S11–S26).

References

    1. Li R, et al. Substantial undocumented infection facilitates the rapid dissemination of novel coronavirus (SARS-CoV-2) Science. 2020;368:489–493. - PMC - PubMed
    1. International Coronaviridae Study Group The species severe acute respiratory syndrome-related coronavirus: Cassifying 2019-ncov and naming it SARS-CoV-2. Nat. Microbiol. 2020;5:536. - PMC - PubMed
    1. Maier BF, Brockmann D. Effective containment explains subexponential growth in recent confirmed COVID-19 cases in China. Science. 2020;368:742–746. - PMC - PubMed
    1. Maharaj S, Kleczkowski A. Controlling epidemic spread by social distancing: Do it well or not at all. BMC Public Health. 2012;12:679. - PMC - PubMed
    1. International Monetary Fund . World Economic Outlook: Gross Domestic Product. International Monetary Fund; 2020.

Publication types