. 2022 Apr 12;41(1):139.
doi: 10.1186/s13046-022-02333-1.

Growth factor independence underpins a paroxysmal, aggressive Wnt5aHigh/EphA2Low phenotype in glioblastoma stem cells, conducive to experimental combinatorial therapy

Affiliations

Growth factor independence underpins a paroxysmal, aggressive Wnt5aHigh/EphA2Low phenotype in glioblastoma stem cells, conducive to experimental combinatorial therapy

Nadia Trivieri et al. J Exp Clin Cancer Res. .

Abstract

Background: Glioblastoma multiforme (GBM) is an incurable tumor, with a median survival rate of only 14-15 months. Along with heterogeneity and unregulated growth, a central matter in dealing with GBMs is cell invasiveness. Thus, improving prognosis requires finding new agents to inhibit key multiple pathways, even simultaneously. A subset of GBM stem-like cells (GSCs) may account for tumorigenicity, representing, through their pathways, the proper cellular target in the therapeutics of glioblastomas. GSCs cells are routinely enriched and expanded due to continuous exposure to specific growth factors, which might alter some of their intrinsic characteristic and hide therapeutically relevant traits.

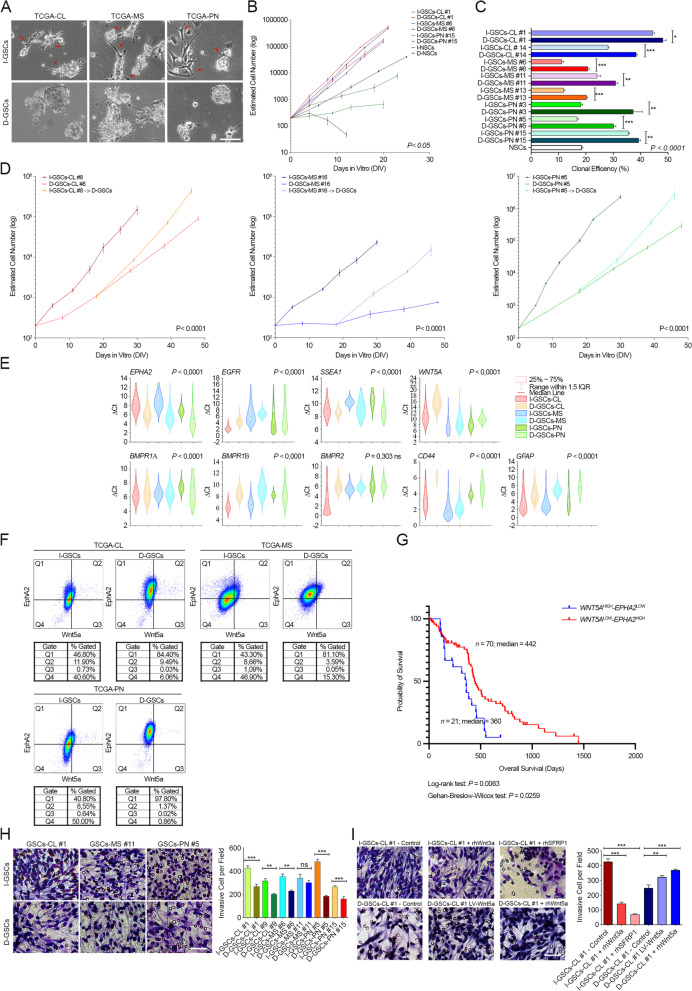
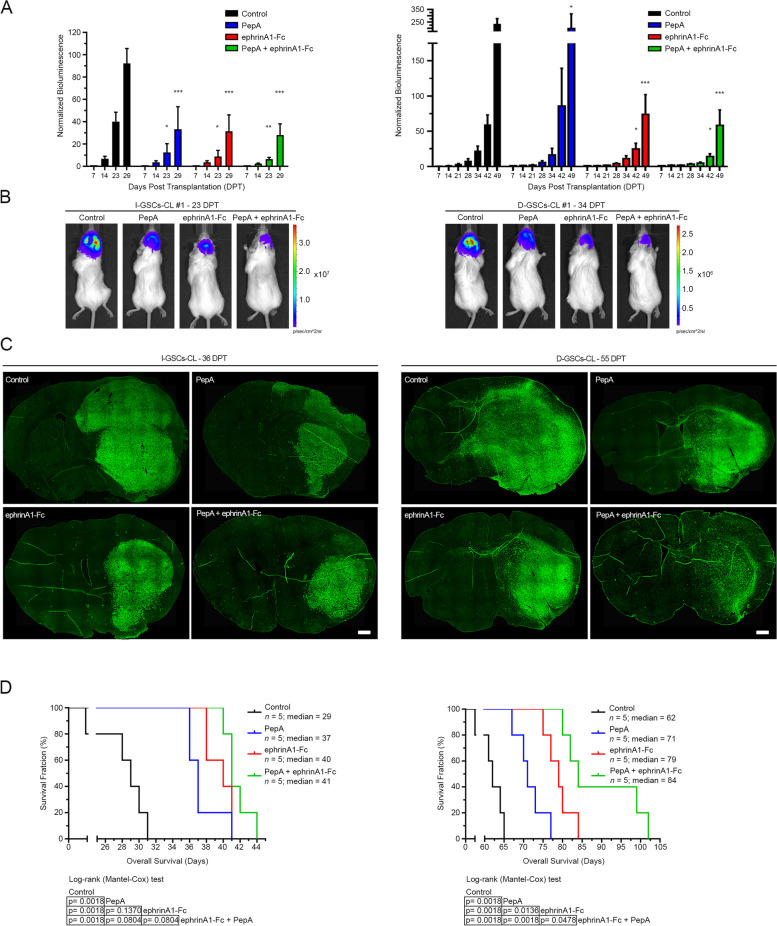
Methods: By removing exogenous growth factors stimulation, here we isolated and characterized a subset of GSCs with a "mitogen-independent" phenotype (I-GSCs) from patient's tumor specimens. Differential side-by-side comparative functional and molecular analyses were performed either in vitro or in vivo on these cells versus their classical growth factor (GF)-dependent counterpart (D-GSCs) as well as their tissue of origin. This was performed to pinpoint the inherent GSCs' critical regulators, with particular emphasis on those involved in spreading and tumorigenic potential. Transcriptomic fingerprints were pointed out by ANOVA with Benjamini-Hochberg False Discovery Rate (FDR) and association of copy number alterations or somatic mutations was determined by comparing each subgroup with a two-tailed Fisher's exact test. The combined effects of interacting in vitro and in vivo with two emerging GSCs' key regulators, such as Wnt5a and EphA2, were then predicted under in vivo experimental settings that are conducive to clinical applications. In vivo comparisons were carried out in mouse-human xenografts GBM model by a hierarchical linear model for repeated measurements and Dunnett's multiple comparison test with the distribution of survival compared by Kaplan-Meier method.

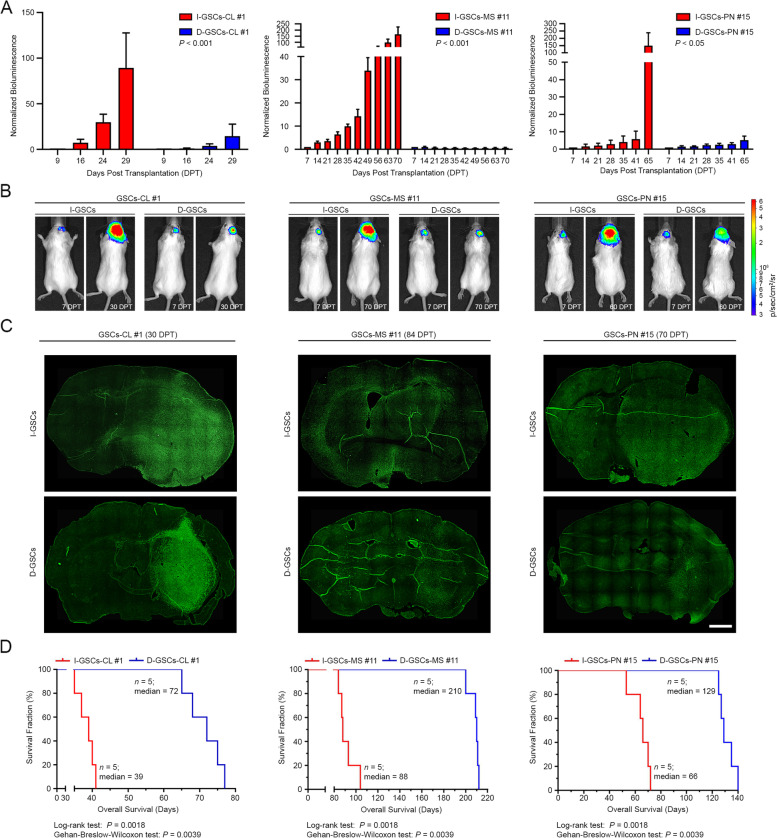
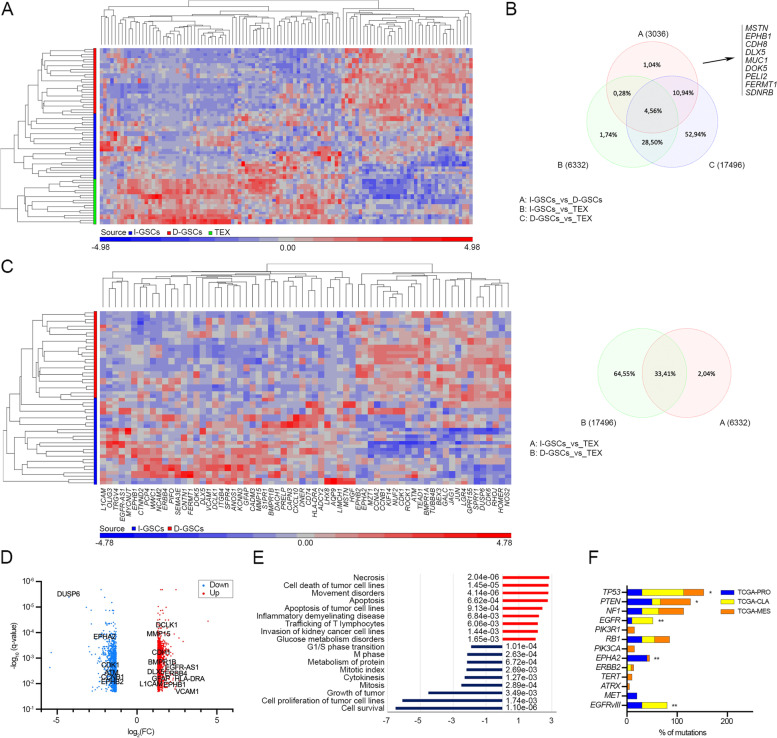
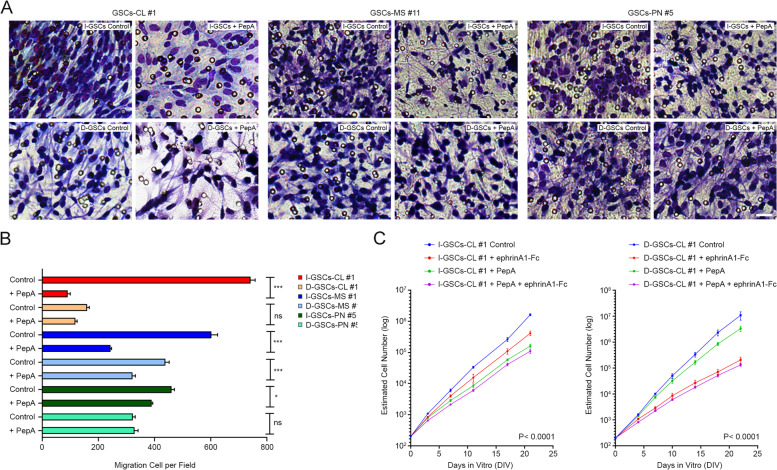
Results: Here, we assessed that a subset of GSCs from high-grade gliomas is self-sufficient in the activation of regulatory growth signaling. Furthermore, while constitutively present within the same GBM tissue, these GF-independent GSCs cells were endowed with a distinctive functional and molecular repertoire, defined by highly aggressive Wnt5aHigh/EphA2Low profile, as opposed to Wnt5aLow/EphA2High expression in sibling D-GSCs. Regardless of their GBM subtype of origin, I-GSCs, are endowed with a raised in vivo tumorigenic potential than matched D-GSCs, which were fast-growing ex-vivo but less lethal and invasive in vivo. Also, the malignant I-GSCs' transcriptomic fingerprint faithfully mirrored the original tumor, bringing into evidence key regulators of invasiveness, angiogenesis and immuno-modulators, which became candidates for glioma diagnostic/prognostic markers and therapeutic targets. Particularly, simultaneously counteracting the activity of the tissue invasive mediator Wnt5a and EphA2 tyrosine kinase receptor addictively hindered GSCs' tumorigenic and invasive ability, thus increasing survival.

Conclusion: We show how the preservation of a mitogen-independent phenotype in GSCs plays a central role in determining the exacerbated tumorigenic and high mobility features distinctive of GBM. The exploitation of the I-GSCs' peculiar features shown here offers new ways to identify novel, GSCs-specific effectors, whose modulation can be used in order to identify novel, potential molecular therapeutic targets. Furthermore, we show how the combined use of PepA, the anti-Wnt5a drug, and of ephrinA1-Fc to can hinder GSCs' lethality in a clinically relevant xenogeneic in vivo model thus being conducive to perspective, novel combinatorial clinical application.

Keywords: Anti-GSCs patient-tailored strategies; GBM cancer stem cells (GSCs); GSCs biology and biomarkers; Glioblastoma; Mitogen-independence.


Conflict of interest statement

The authors declare no competing interests. AL Vescovi has ownership interest in Hyperstem SA.

Figures

Fig. 1
Fig. 1
I-GSCs can be isolated from GBM surgery specimens in the absence of mitogenic stimulation. A. GFs-independent (I-GSCs) (top) and dependent GSCs (D-GSCs) (bottom) can be either isolated from the very same patient’s tissue across subtypes, with the former exhibiting many adhesion-related protrusions (arrowheads) and the latter typical rounded morphology. B-C. Significant differences in the expansion rate (B) and self-renewal potential (C) between I- and D-GSCs across subtypes, with the former comprising slower-dividing GSCs with a lower clonogenicity. *P < 0.05 I-GSCs vs. D-GSCs, hierarchical linear model for repeated measurements and ***P < 0.001, **P < 0.01, *P < 0.05 and P < 0.0001 I-GSCs vs. D-GSCs, one-way Student’s t-test in B and C, respectively. Lines I-GSCs and D-GSCs #1 (TCGA-CL GSCs, red), #6 (TCGA-MS, blue) and #15 (TCGA-PN, green) are shown as representative examples in B. Data are mean ± SD (B) and mean ± SEM (C) (n = 3). D. When exposed to mitogens, I-GSCs’ proliferation closely mirrors that one of D-GSCs, regardless of subtype (TCGA-CL GSCs, right; TCGA-MS GSCs, middle; TCGA-PN GSCs, right). ***P < 0.001 I-GSCs vs. D-GSCs, hierarchical linear model for repeated measurements. Data are mean ± SD (n = 3). E. Violin plot displaying the different enrichment of genes associated to stemness, differentiation and invasion in I-GSCs vs. D-GSCs across subtypes, as detected by qPCR. P-values are from Kruskal-Wallis test. F. Dot plots showing flow cytometric analysis confirming the enrichment of Wnt5a in I-GSCs across subtypes when compared to D-GSCs, shown to upregulate EphA2. Lines I-GSCs and D-GSCs #1 (TCGA-CL GSCs), #5 (TCGA-PN GSCs) and #11 (TCGA-MS GSCs) are shown as representative examples (n = 3). G. High level of WNT5A combined with low EPHA2 expression is associated with lower GBM patients’ survival according to TCGA public dataset (P = 0.0063 and P = 0.0259; n = 91, Log-rank and Gehan-Breslow-Wilcoxon test), as depicted by Kaplan-Meier plots. H-I. In vitro migration assay showing that, irrespective of the molecular subtype, I-GSCs migrate and invade more efficiently than their D-GSCs counterpart (H). I Blockade of Wnt5a signaling by Wnt5a-endogenous antagonists (rhWnt3a; middle and rhSFRP1; right) lessens I-GSCs’ exacerbated invasiveness (top), whereas enhancement of Wnt5a expression in D-GSCs by stable lentiviral-mediated overexpression (LV-Wnt5a; middle) or by exposure to rhWnt5a (right) elicits cell migration (bottom). Bars in A, H-I, 100um, 50um. Quantification in H-I is shown as mean ± SEM. ***P < 0.001, **P < 0.01, ns not significant, one-way Student’s t-test and ANOVA Tukey’s multiple comparison test
Fig. 2
Fig. 2
I-GSCs are endowed in vivo with enhanced tumorigenic ability. A. GBM xenografts derived from I-GSCs display higher growth than those generated by D-GSCs sibling regardless of the transcriptional subtype, as depicted by quantitative time-course bioluminescence analysis. Data are mean ± SEM. P-values are from hierarchical linear model; n = 5 mice/group. B. Mice carrying luc-I- and D-GSCs cells are imaged from 7 days post-transplantation (DPT) to the endpoint. C. Serial immunohistochemical reconstructions confirming that I-GSCs give rise to more extended and invasive tumors than those from D-GSCs injection. Bar, 1 mm. D. Kaplan-Meier plot of survival demonstrating that animals receiving I-GSCs die much earlier than those implanted with their sibling D-GSCs. P-values are from Log-rank and Gehan-Breslow-Wilcoxon test
Fig. 3
Fig. 3
I-GSCs’ transcriptional profile is defined by migration and invasiveness. A-B Unsupervised hierarchical clustering analysis based on global gene expression profile of nine I-GSCs lines (blue), D-GSCs (red) counterpart and their GBM tissues (TEX; green) reporting a matching transcriptional signature between I-GSCs and tissue samples. Samples are coded by color. A dual-color code represents genes over- (red) and under-represented (blue), respectively (A). B Venn diagram confirming the exclusive over-expression in I-GSCs of genes mainly involved in cell migration (FDR < 0.05 and FC = 2). C. Hierarchical clustering using 66 differentially expressed genes when comparing I-GSCs to D-GSCs (left). Higher overlap of genes between I-GSCs and their original GBM tissue as compared to D-GSCs versus the same tissue, as reported by Venn diagram (right). D. Volcano plots based on expression data showing the higher infiltrative and mature, “astrocyte-like” profile of I-GSCs vs D-GSCs. Significant hits are depicted in red and blue. The top candidates are labelled. E. When compared to their D-GSCs siblings, I-GSCs’ overexpress transcripts belonging to biological functions as cell death, invasion and inflammatory/immune response, whereas downregulated mRNAs are mainly involved in cell cycle, cell proliferation and survival processes. Red and blue bars count for up- and downregulated genes, respectively. F. Distribution of the frequently mutated genes in GBM across subtype in both GSCs population and their tissue. **P < 0.01, *P < 0.05, Fisher’s exact test
Fig. 4
Fig. 4
Ex vivo effects of PepA and ephrinA1-Fc treatments on GSCs. A Ex vivo treatment of GSCs with exogenous PepA hinders invasiveness of either I- (top) or D-GSCs (bottom) regardless of subtype. Bars, 50um Quantification is shown in B as mean ± SEM. ***P < 0.001, *P < 0.05, ns, not significant, one-way Student’s t-test; n = 3. C. Exposure of I- (left) and D-GSCs (right) to PepA (green line), ephrinA1-Fc (red line) or a combination of both (purple line) lessens steady growth of both GSCs to nearly half than in control GSCs, showing a clear additive effect of the two molecules. Data are mean ± SD. ***P < 0.001 I-GSCs vs. D-GSCs, hierarchical linear model for repeated measurements; n = 3
Fig. 5
Fig. 5
A combinatorial PepA/ephrinA1-Fc-manipulation approach impairs tumorigenicity and invasiveness of GSCs cells. A. Quantitative analysis of luc-GSCs signal showing that both PepA and ephrinA1-Fc hinder I-GSCs-derived tumors’ growth (left) and, to a lesser extent, of their D-GSCs counterpart (right) and that the combined use of the two molecules has an additive effect. Data are mean ± SEM. ***P < 0.001, *P < 0.05, Dunnett’s multiple comparison test; n = 5 mice. B. Imaging of luciferase-tagged I- and D-GSCs injected into the brain of Scid/bg mice showing that after 23 and 34 days, respectively, untreated mice develop larger and spreaded tumors than PepA and ephrinA1-Fc-infused mice. Tumor growth is markedly inhibited with the combination of both molecules. C. Brain sections confirming that tumors from mice carrying I-GSCs or D-GSCs cells and infused with vehicle proliferated and spread through the brain parenchyma more than those infused either with PepA or ephrinA1-Fc, being the combination of both even more efficacious in reducing cell proliferation and invasiveness. Bar, 1 mm. D. Survival of mice harboring I-GSCs (left) and D-GSCs-tumors (right) is significantly enhanced when infused with PepA (blue bar) and ephrinA1-Fc (red bar) alone, or even more with the combination of the two molecules (green bar). A league table of comparison by Log-rank is shown; n = 5 mice

References

    1. Louis DN, Perry A, Reifenberger G, von Deimling A, Figarella-Branger D, Cavenee WK, et al. The 2016 World Health Organization classification of tumors of the central nervous system: a summary. Acta Neuropathol. 2016;131:803–820. doi: 10.1007/s00401-016-1545-1. - DOI - PubMed
    1. Krex D, Klink B, Hartmann C, von Deimling A, Pietsch T, Simon M, et al. Long-term survival with glioblastoma multiforme. Brain. 2007;130:2596–2606. doi: 10.1093/brain/awm204. - DOI - PubMed
    1. Riemenschneider MJ, Reifenberger G. Novel insights into the pathogenesis of gliomas based on large-scale molecular profiling approaches. Curr Opin Neurol. 2009;22:619–624. doi: 10.1097/WCO.0b013e32833245b0. - DOI - PubMed
    1. Network CGAR. Comprehensive genomic characterization defines human glioblastoma genes and core pathways. Nature. 2008;455:1061–1068. doi: 10.1038/nature07385. - DOI - PMC - PubMed
    1. Patel AP, Tirosh I, Trombetta JJ, Shalek AK, Gillespie SM, Wakimoto H, et al. Single-cell RNA-seq highlights intratumoral heterogeneity in primary glioblastoma. Science. 2014;344:1396–1401. doi: 10.1126/science.1254257. - DOI - PMC - PubMed