. 2022 Apr 12;5(1):350.
doi: 10.1038/s42003-022-03293-0.

Bovine host genome acts on rumen microbiome function linked to methane emissions

Affiliations

Bovine host genome acts on rumen microbiome function linked to methane emissions

Marina Martínez-Álvaro et al. Commun Biol. .

Abstract

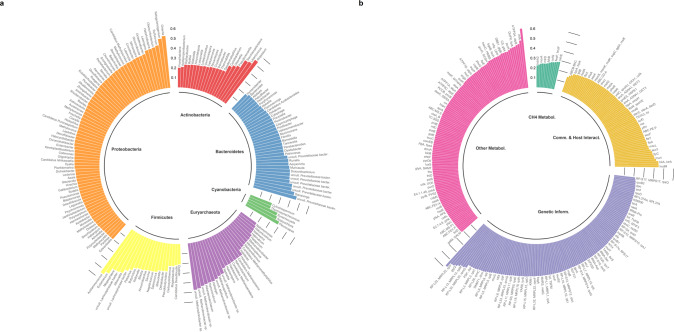
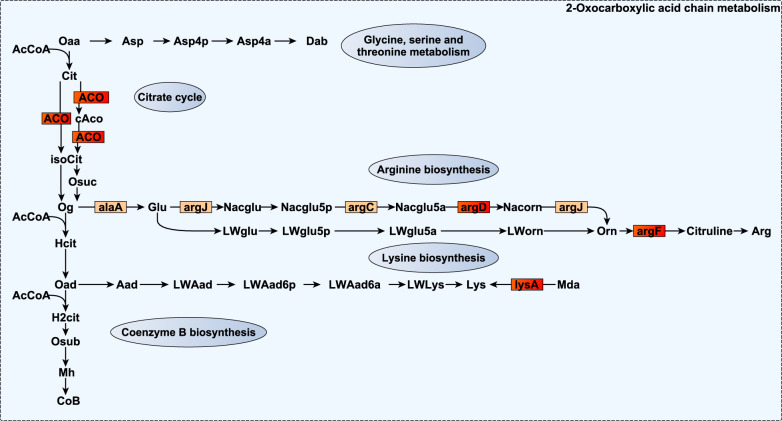
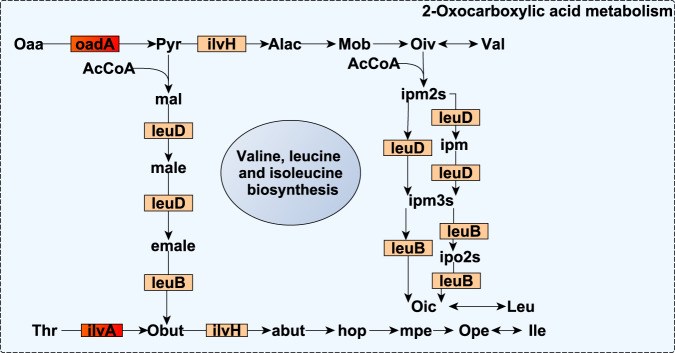
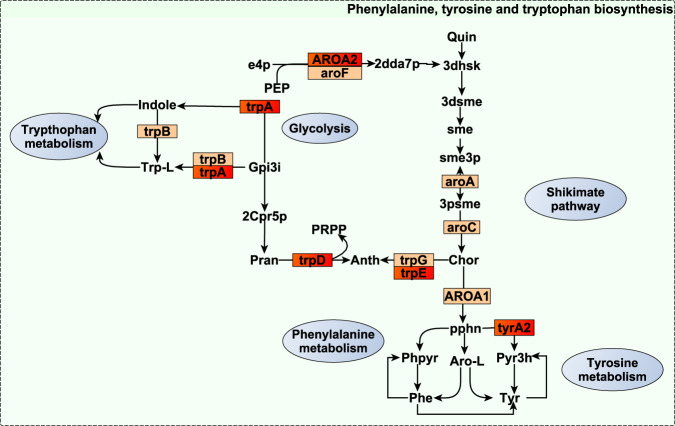
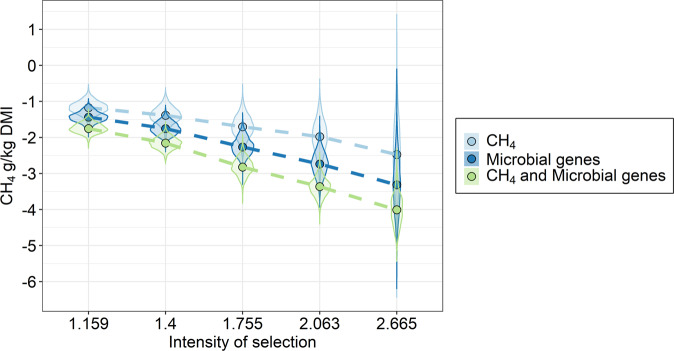
Our study provides substantial evidence that the host genome affects the comprehensive function of the microbiome in the rumen of bovines. Of 1,107/225/1,141 rumen microbial genera/metagenome assembled uncultured genomes (RUGs)/genes identified from whole metagenomics sequencing, 194/14/337 had significant host genomic effects (heritabilities ranging from 0.13 to 0.61), revealing that substantial variation of the microbiome is under host genomic control. We found 29/22/115 microbial genera/RUGs/genes host-genomically correlated (|0.59| to |0.93|) with emissions of the potent greenhouse gas methane (CH4), highlighting the strength of a common host genomic control of specific microbial processes and CH4. Only one of these microbial genes was directly involved in methanogenesis (cofG), whereas others were involved in providing substrates for archaea (e.g. bcd and pccB), important microbial interspecies communication mechanisms (ABC.PE.P), host-microbiome interaction (TSTA3) and genetic information processes (RP-L35). In our population, selection based on abundances of the 30 most informative microbial genes provided a mitigation potential of 17% of mean CH4 emissions per generation, which is higher than for selection based on measured CH4 using respiration chambers (13%), indicating the high potential of microbiome-driven breeding to cumulatively reduce CH4 emissions and mitigate climate change.


Conflict of interest statement

The authors declare no competing interests.

Figures

Fig. 1
Fig. 1. Genomic heritability (h2) estimates of additive log-ratio-transformed abundances of microbial taxa and their genes in the rumen of 359 bovines.
Bars show the h2 values of 194/14/337 rumen microbial genera/uncultured genomes (RUGs)/genes tested exhibiting non-zero h2 estimates and significant host genomic effects (based on Bayes Factor >3 and Deviance Information Criterion difference between models with or without host genomic effects ≤−20). a Cultured microbial genera and RUGs classified within the phylum. b Microbial genes grouped by microbial biological processes: microbial communication and host-microbiome interaction (Comm. & Host Interact.), genetic information processes (Genetic Inform.), metabolism other than methane (Other Metabol.), and methane metabolism (CH4 Metabol.). Source data is in Supplementary Data 4–6.
Fig. 2
Fig. 2. Reaction scheme of 2-oxocarboxylic acid metabolism and glycine, serine, threonine, arginine, lysine, and Coenzyme B biosynthesis in which additive log-ratio transformed microbial gene abundances strongly host-genomically correlated with methane emissions (rgCH4) are involved.
Small rectangles symbolize proteins encoded by the microbial genes. Microbial genes are highlighted in red when their rgCH4 estimates range between −0.74 and −0.93 and show a probability of being different from 0 (P0) ≥ 0.95, and in orange when they range between |0.55| and |0.77| and P0 ≥ 0.85. Source data is in Supplementary Data 9. Compounds are denoted by their short names. Full names of compounds and microbial genes are given in Supplementary Data 17.
Fig. 3
Fig. 3. Reaction scheme of 2-oxocarboxylic acid metabolism and branched-chain amino acid biosynthesis, in which additive log-ratio transformed microbial gene abundances strongly host genomically correlated with methane emissions (rgCH4) are involved.
Small rectangles symbolize proteins encoded by the microbial genes. Microbial genes are highlighted in red when their rgCH4 estimates range between −0.74 and −0.93 and show a probability of being different from 0 (P0) ≥ 0.95, and in orange when they range between |0.55| and |0.77| and P0 ≥ 0.85. Source data is in Supplementary Data 9. Compounds are denoted by their short names. Full names of compounds and microbial genes are given in Supplementary Data 17.
Fig. 4
Fig. 4. Reaction scheme of phenylalanine, tyrosine and tryptophan biosynthesis in which additive log-ratio transformed microbial gene abundances strongly host genomically correlated with methane emissions (rgCH4) are involved.
Small rectangles symbolize proteins encoded by the microbial genes. Microbial genes are highlighted in red when their rgCH4 estimates range between −0.74 and −0.93 and show a probability of being different from 0 (P0) ≥ 0.95, and in orange when they range between |0.55| and |0.77| and P0 ≥ 0.85. Compounds are denoted by their short names. Source data is in Supplementary Data 9. Full names of compounds and microbial genes are given in Supplementary Data 17.
Fig. 5
Fig. 5. Reaction scheme of starch and sucrose metabolism in which additive log-ratio transformed microbial gene abundances strongly host genomically correlated with methane emissions (rgCH4) are involved.
Small rectangles symbolize proteins encoded by the microbial genes. Microbial genes are highlighted in red when their rgCH4 estimates range between −0.74 and −0.93 and show a probability of being different from 0 (P0) ≥ 0.95, and in orange when they range between |0.55| and |0.77| and P0 ≥ 0.85. Source data is in Supplementary Data 9. Compounds are denoted by their short names. Full names of compounds and microbial genes are given in Supplementary Data 17.
Fig. 6
Fig. 6. Top 20 rumen uncultured genomes (RUGs) highly enriched with the 115 microbial genes host-genomically correlated to methane emissions with a probability of being higher or lower than 0 (P0) ≥ 0.95.
Colour scale represents the number of unique proteins mapping into each KEGG orthologous group (i.e. microbial gene). Source data is in Supplementary Data 11. Full names of microbial genes are given in Supplementary Data 18.
Fig. 7
Fig. 7. Microbial genes selected to be used collectively for selecting the host genomes associated with low CH4 emissions, meeting 3 criteria: showing significant heritability (h2) based on Bayes Factor >3 and Deviance Information Criterion difference between models with or without host genomic effects ≤−20; a host genomic correlation with CH4 (rgCH4) with a probability of being higher or lower than 0 (P0) > 0.95, and showing a relative abundance >0.01%.
a Estimates of h2 and rgCH4 (error bars represent the highest posterior density interval enclosing 95% probability). Microbial genes grouped by microbial biological processes: methane metabolism (CH4), microbial communication and host–microbiome interaction (Comm. & host interact.), genetic information processes and metabolism other than CH4 (Metabolism). b Correlogram showing the median of the pairwise host-genomic correlations estimates among the additive log-ratio transformed microbial gene abundances selected for breeding purposes. Source data is in Supplementary Data 14. Full names of microbial genes selected for breeding purposes are given in Supplementary Data 19.
Fig. 8
Fig. 8. Response to selection per generation on methane (CH4) emissions estimated using direct genomic selection based on measured CH4 emissions (light blue), indirect genomic selection based on 30 microbial gene abundances most informative for host genomic selection for CH4 (dark blue) or selection on both criteria (green).
Intensities of selection 1.1590, 1.400, 1.755, 2.063, or 2.665 are equivalent to selecting 30, 20, 10, 5, or 1%, respectively, of our n = 285 animal population with CH4 and metagenomic data based on the above-described selection criteria. Dots display the medians and violin plots represent the estimated marginal posterior distributions of the response to selection for each intensity of selection and breeding strategy. Source data is in Supplementary Data 16.

References

    1. OECD/FAO. OECD-FAO Agricultural Outlook 2020-2029 (OECD Publishing/Food and Agriculture Organization of the United Nations, 2020).
    1. Vollset SE, et al. Fertility, mortality, migration, and population scenarios for 195 countries and territories from 2017 to 2100: a forecasting analysis for the Global Burden of Disease Study. Lancet. 2020;396:1285–1306. - PMC - PubMed
    1. Gerber, P. J. et al. Tackling Climate Change Through Livestock – A Global Assessment of Emissions and Mitigation Opportunities (Food and Agriculture Organization of the United Nations (FAO), 2013).
    1. Myhre, G. et al. Anthropogenic and Natural Radiative Forcing: Supplementary Material. Climate Change 2013: The Physical Science Basis. Contribution of Working Group I to the Fifth Assessment Report of the Intergovernmental Panel on Climate Change (IPCC, 2013).
    1. Johnson KA, Johnson DE. Methane emissions from cattle. J. Anim. Sci. 1995;73:2483–2492. - PubMed