. 2022 Apr 12;24(1):27.
doi: 10.1186/s13058-022-01524-0.

Genome-wide and transcriptome-wide association studies of mammographic density phenotypes reveal novel loci

Affiliations

Genome-wide and transcriptome-wide association studies of mammographic density phenotypes reveal novel loci

Hongjie Chen et al. Breast Cancer Res. .

Abstract

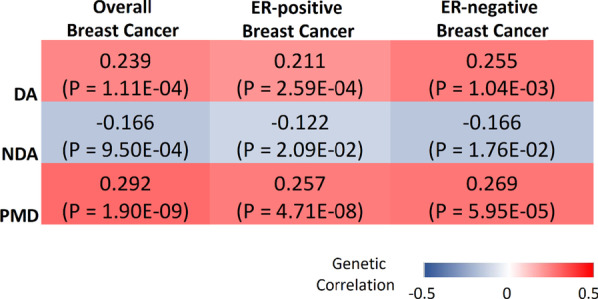
Background: Mammographic density (MD) phenotypes, including percent density (PMD), area of dense tissue (DA), and area of non-dense tissue (NDA), are associated with breast cancer risk. Twin studies suggest that MD phenotypes are highly heritable. However, only a small proportion of their variance is explained by identified genetic variants.

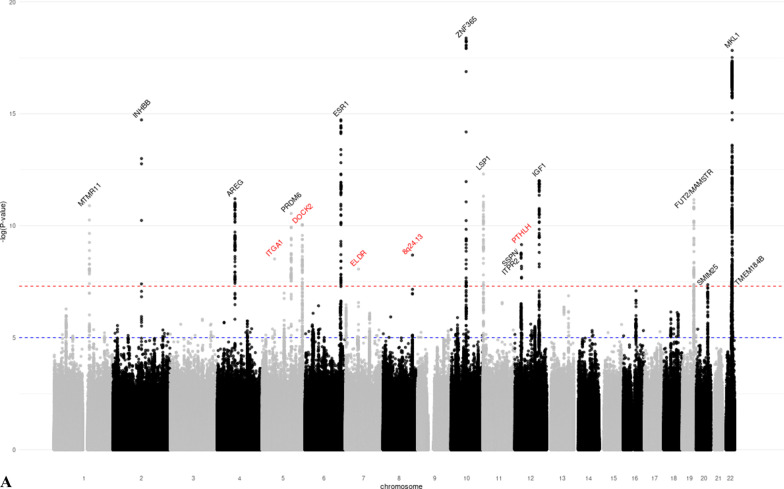
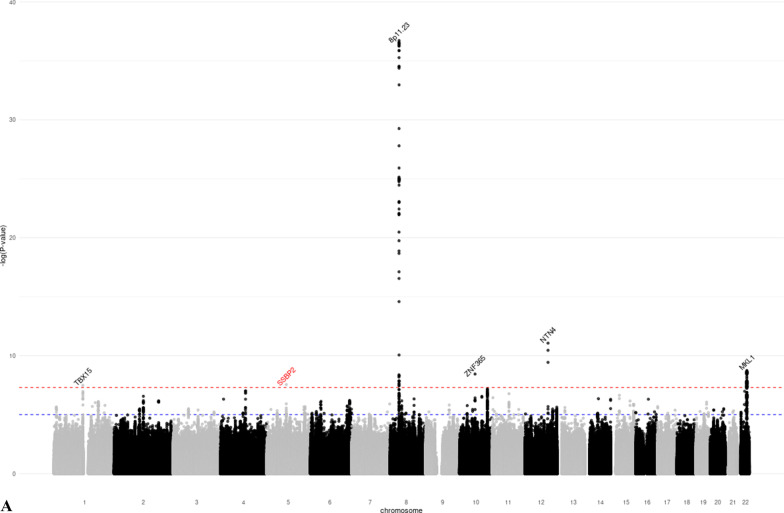
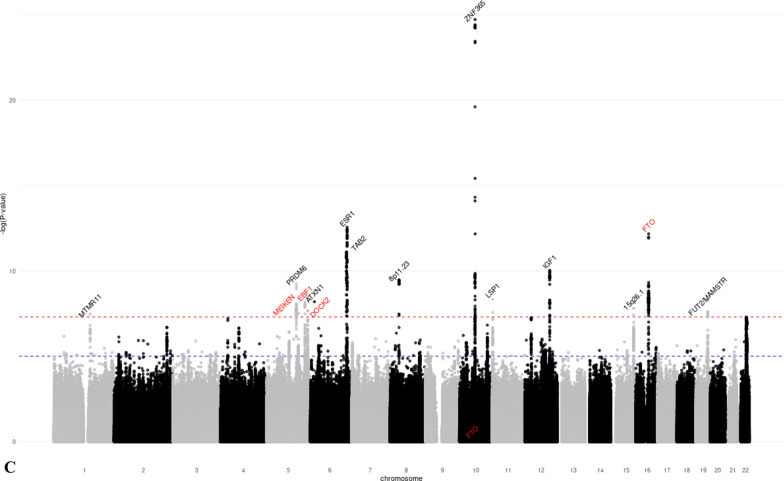
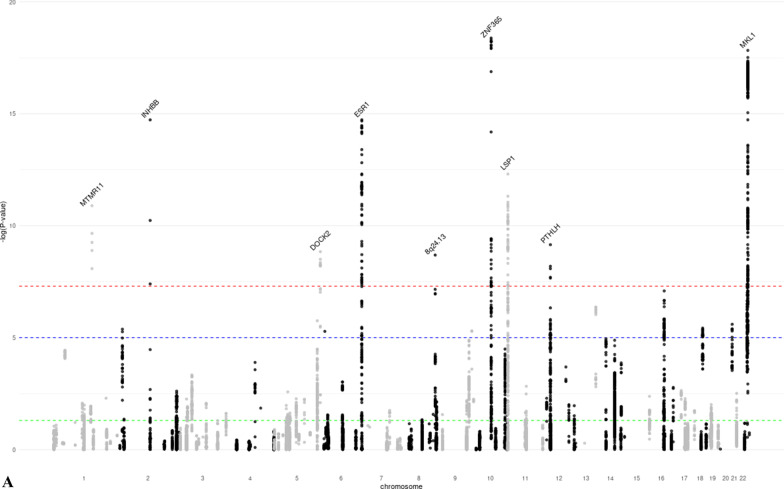
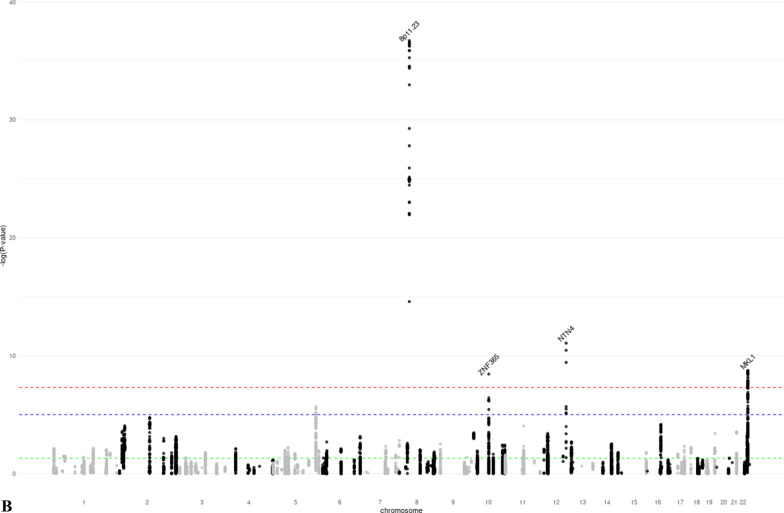
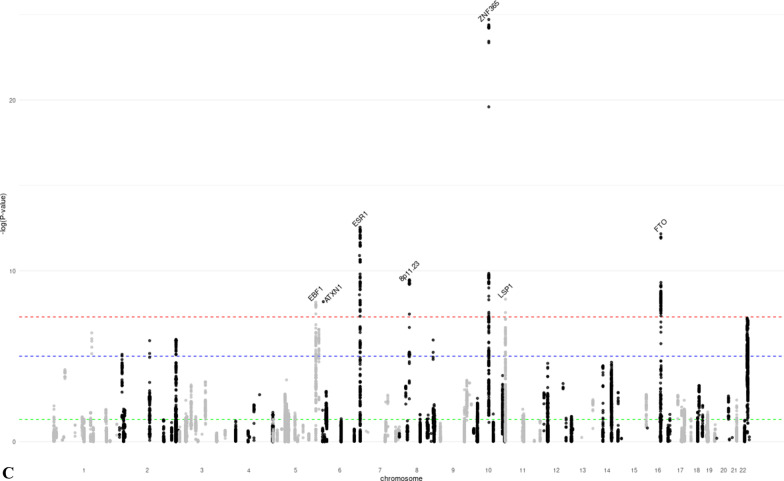
Methods: We conducted a genome-wide association study, as well as a transcriptome-wide association study (TWAS), of age- and BMI-adjusted DA, NDA, and PMD in up to 27,900 European-ancestry women from the MODE/BCAC consortia.

Results: We identified 28 genome-wide significant loci for MD phenotypes, including nine novel signals (5q11.2, 5q14.1, 5q31.1, 5q33.3, 5q35.1, 7p11.2, 8q24.13, 12p11.2, 16q12.2). Further, 45% of all known breast cancer SNPs were associated with at least one MD phenotype at p < 0.05. TWAS further identified two novel genes (SHOX2 and CRISPLD2) whose genetically predicted expression was significantly associated with MD phenotypes.

Conclusions: Our findings provided novel insight into the genetic background of MD phenotypes, and further demonstrated their shared genetic basis with breast cancer.

Keywords: Breast cancer; Genome-wide association study (GWAS); Mammographic density; Transcriptome-wide association study (TWAS).


Conflict of interest statement

The authors declare that they have no competing interests.

Figures

Fig. 1
Fig. 1
Manhattan plots of the GWAS meta-analysis results of mammographic a dense area (DA, N = 24,579), b non-dense area (NDA, N = 24,689), and c percent mammographic density (PMD, N = 27,900). p value thresholds for genome-wide significance (p = 5 × 10−8, red dash line) and suggestive significance (p = 10−5, blue dash line) are shown as horizontal lines. The gene closest to each lead variant is annotated. Novel loci are marked red. a Manhattan plot of the GWAS meta-analysis results of DA. b Manhattan plot of the GWAS meta-analysis results of NDA. c Manhattan plot of the GWAS meta-analysis results of PMD
Fig. 1
Fig. 1
Manhattan plots of the GWAS meta-analysis results of mammographic a dense area (DA, N = 24,579), b non-dense area (NDA, N = 24,689), and c percent mammographic density (PMD, N = 27,900). p value thresholds for genome-wide significance (p = 5 × 10−8, red dash line) and suggestive significance (p = 10−5, blue dash line) are shown as horizontal lines. The gene closest to each lead variant is annotated. Novel loci are marked red. a Manhattan plot of the GWAS meta-analysis results of DA. b Manhattan plot of the GWAS meta-analysis results of NDA. c Manhattan plot of the GWAS meta-analysis results of PMD
Fig. 2
Fig. 2
Manhattan-like plots showing the association between genome-wide significant breast cancer SNPs and the three mammographic density phenotypes (DA, NDA, PMD). p value thresholds for genome-wide significance (p = 5 × 10−8, red line), suggestive significance (p = 10−5, blue line) and nominal significance (p = 0.05, green line) are shown as horizontal dash lines. For signals with genome-wide significance for both MD phenotype and breast cancer, the nearest gene is annotated. a GWAS results of DA for significant SNPs of breast cancer. b GWAS results of NDA for significant SNPs of breast cancer. c GWAS results of PMD for significant SNPs of breast cancer
Fig. 2
Fig. 2
Manhattan-like plots showing the association between genome-wide significant breast cancer SNPs and the three mammographic density phenotypes (DA, NDA, PMD). p value thresholds for genome-wide significance (p = 5 × 10−8, red line), suggestive significance (p = 10−5, blue line) and nominal significance (p = 0.05, green line) are shown as horizontal dash lines. For signals with genome-wide significance for both MD phenotype and breast cancer, the nearest gene is annotated. a GWAS results of DA for significant SNPs of breast cancer. b GWAS results of NDA for significant SNPs of breast cancer. c GWAS results of PMD for significant SNPs of breast cancer
Fig. 3
Fig. 3
Genetic correlations between three MD phenotypes (DA, NDA, PMD) and breast cancer (overall, ER-positive, and ER-negative), estimated by LD score regression

References

    1. Boyd NF, Martin LJ, Yaffe MJ, Minkin S. Mammographic density and breast cancer risk: current understanding and future prospects. Breast Cancer Res. 2011;13(6):223. doi: 10.1186/bcr2942. - DOI - PMC - PubMed
    1. McCormack VA, dos Santos SI. Breast density and parenchymal patterns as markers of breast cancer risk: a meta-analysis. Cancer Epidemiol Biomark Prev. 2006;15(6):1159–1169. doi: 10.1158/1055-9965.EPI-06-0034. - DOI - PubMed
    1. Pettersson A, Graff RE, Ursin G, Santos Silva ID, McCormack V, Baglietto L, Vachon C, Bakker MF, Giles GG, Chia KS, et al. Mammographic density phenotypes and risk of breast cancer: a meta-analysis. J Natl Cancer Inst. 2014;106(5):dju078. doi: 10.1093/jnci/dju078. - DOI - PMC - PubMed
    1. Bond-Smith D, Stone J. Methodological challenges and updated findings from a meta-analysis of the association between mammographic density and breast cancer. Cancer Epidemiol Biomark Prev. 2019;28(1):22–31. doi: 10.1158/1055-9965.EPI-17-1175. - DOI - PubMed
    1. Siegel RL, Miller KD, Jemal A. Cancer statistics, 2018. CA Cancer J Clin. 2018;68(1):7–30. doi: 10.3322/caac.21442. - DOI - PubMed

Publication types