. 2022 Dec;18(12):2985-3003.
doi: 10.1080/15548627.2022.2062111. Epub 2022 Apr 13.

LC3 subfamily in cardiolipin-mediated mitophagy: a comparison of the LC3A, LC3B and LC3C homologs

Affiliations

LC3 subfamily in cardiolipin-mediated mitophagy: a comparison of the LC3A, LC3B and LC3C homologs

Marina N Iriondo et al. Autophagy. 2022 Dec.

Abstract

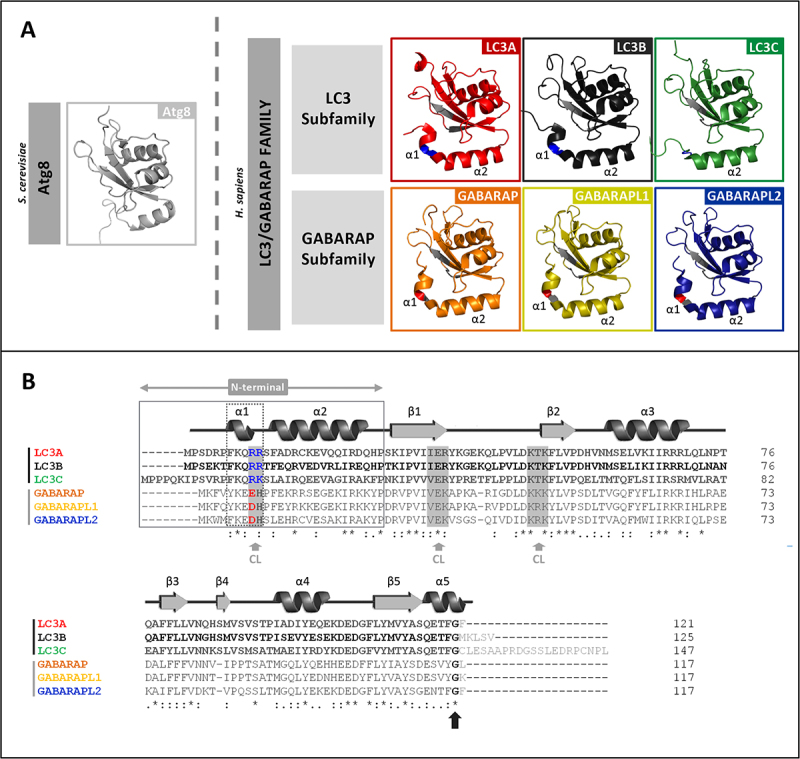
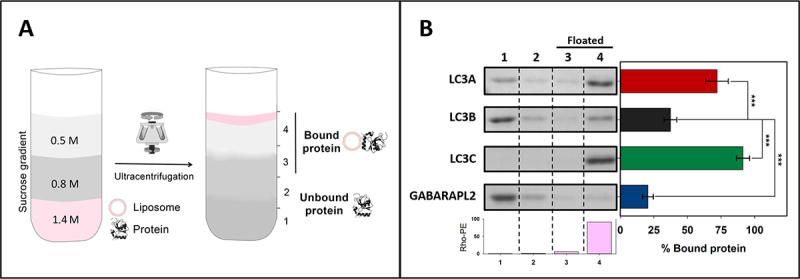
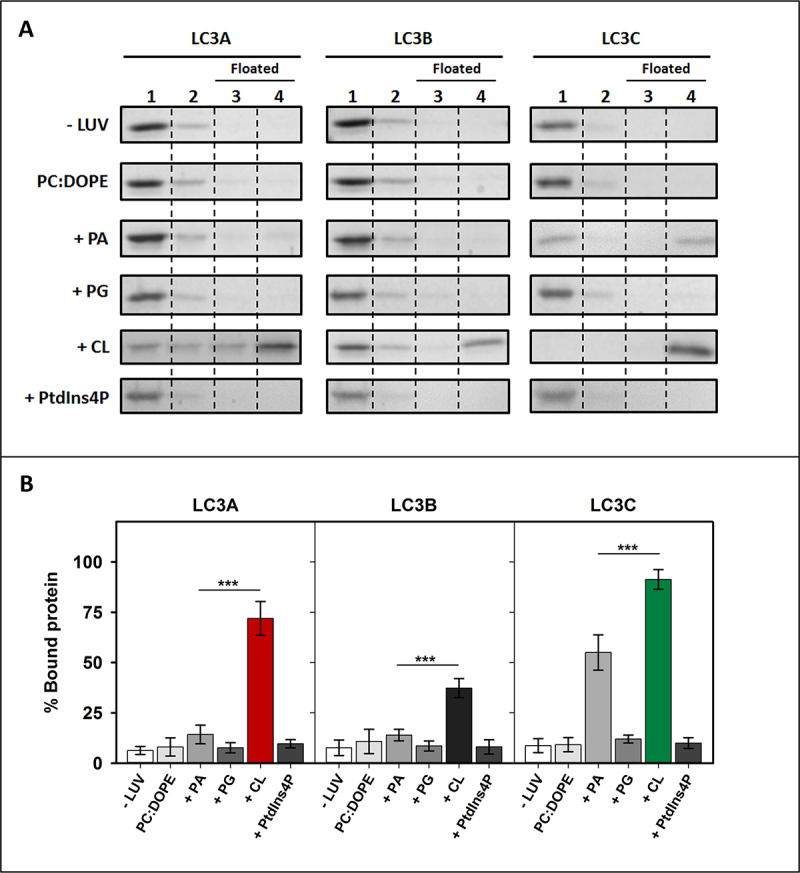
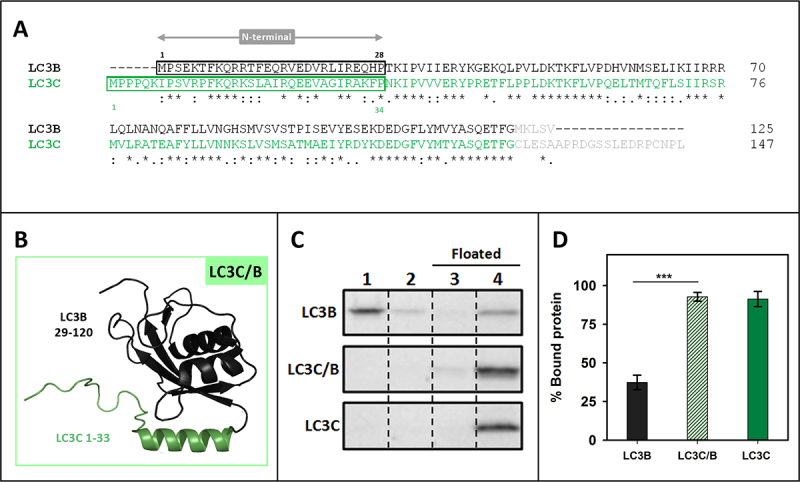
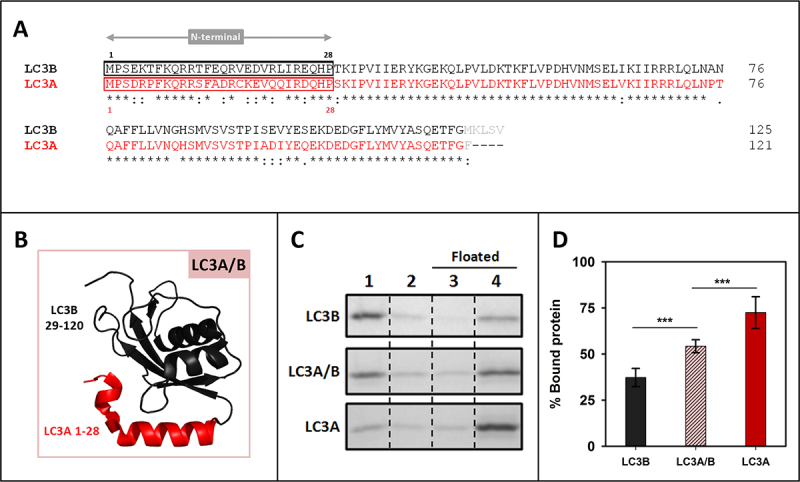
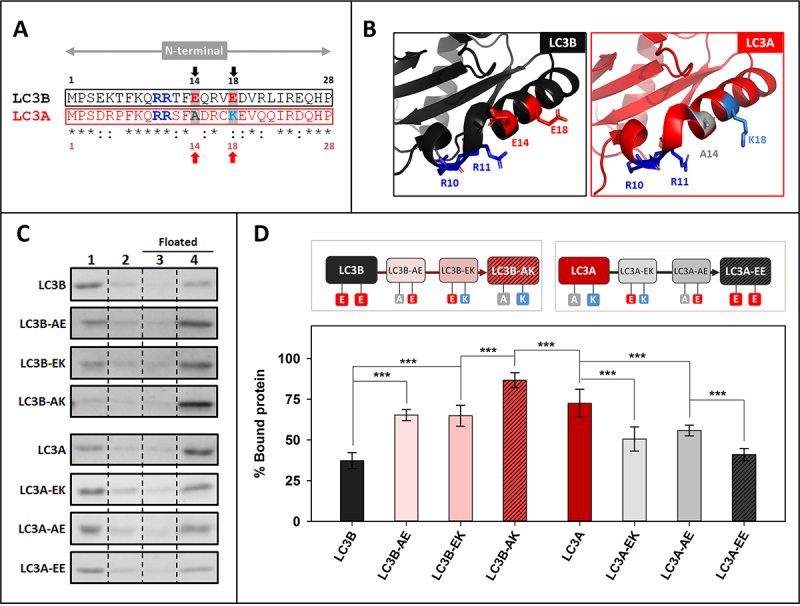
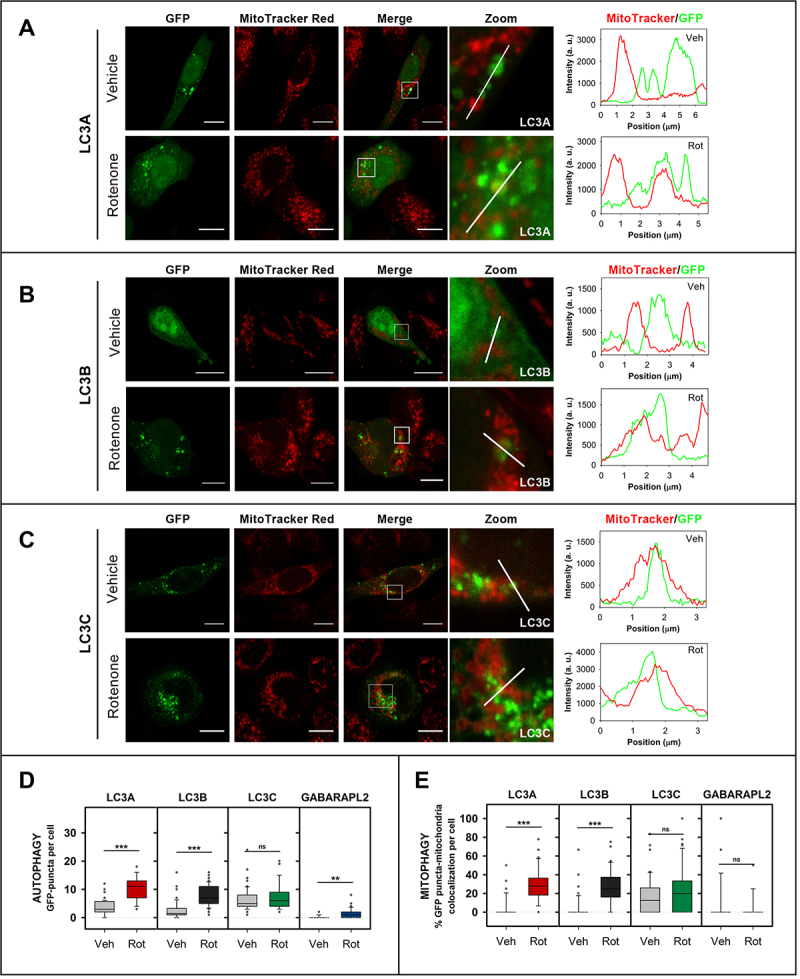
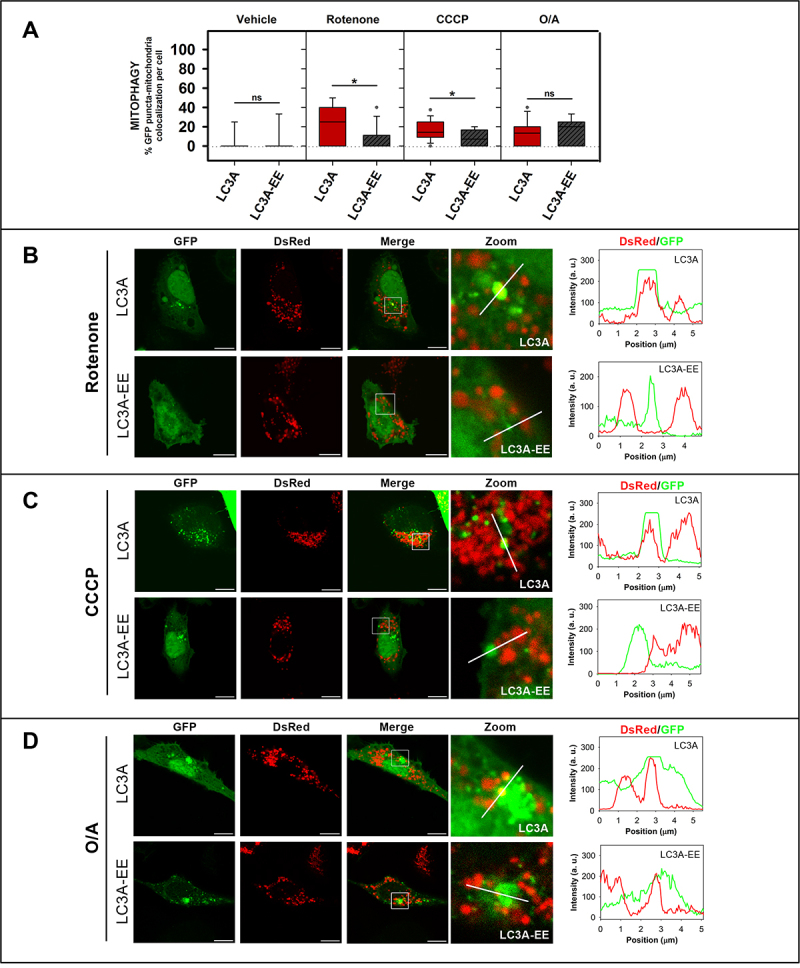
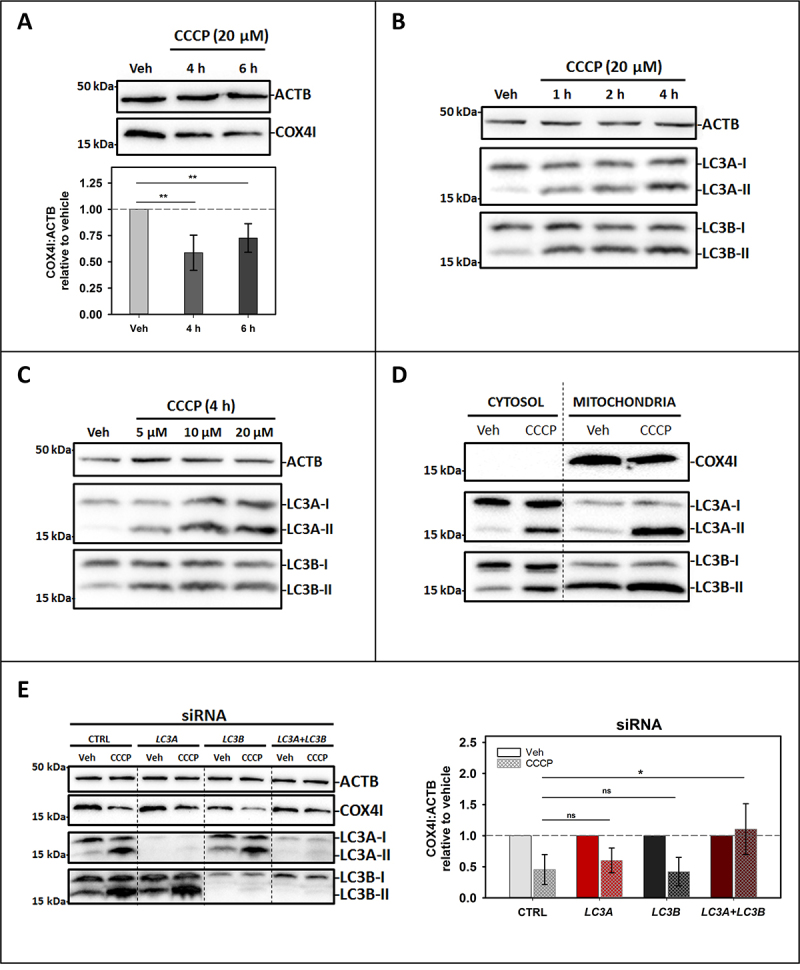
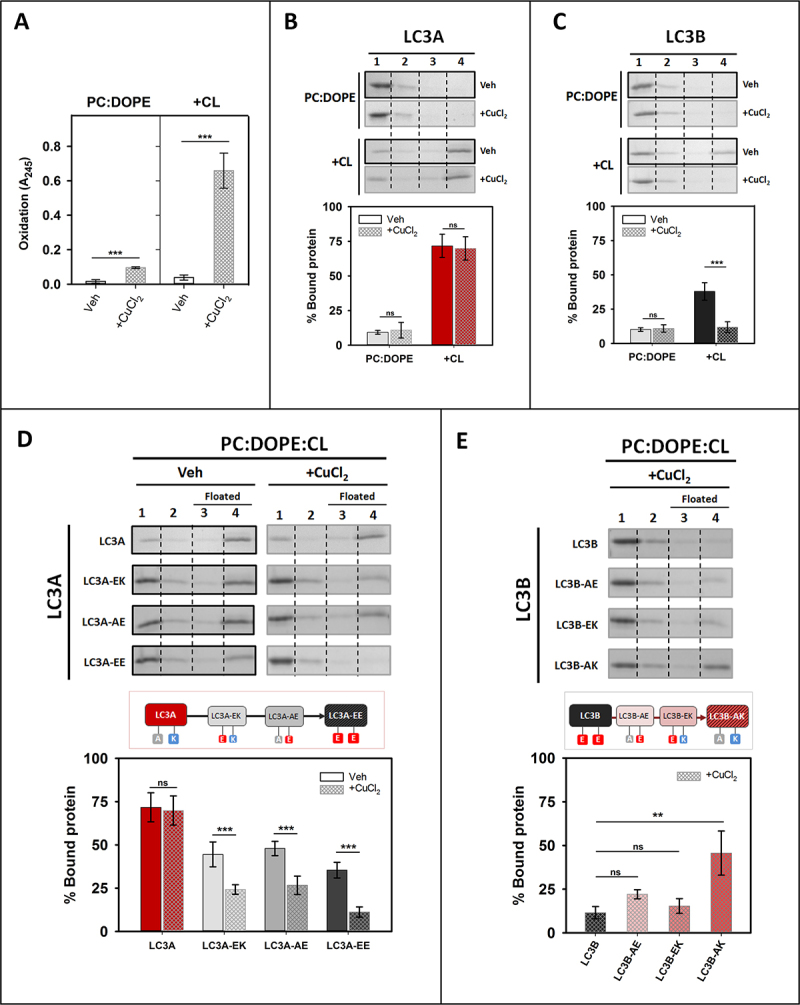
Externalization of the phospholipid cardiolipin (CL) to the outer mitochondrial membrane has been proposed to act as a mitophagy trigger. CL would act as a signal for binding the LC3 macroautophagy/autophagy proteins. As yet, the behavior of the LC3-subfamily members has not been directly compared in a detailed way. In the present contribution, an analysis of LC3A, LC3B and LC3C interaction with CL-containing model membranes, and of their ability to translocate to mitochondria, is described. Binding of LC3A to CL was stronger than that of LC3B; both proteins showed a similar ability to colocalize with mitochondria upon induction of CL externalization in SH-SY5Y cells. Besides, the double silencing of LC3A and LC3B proteins was seen to decrease CCCP-induced mitophagy. Residues 14 and 18 located in the N-terminal region of LC3A were shown to be important for its recognition of damaged mitochondria during rotenone- or CCCP-induced mitophagy. Moreover, the in vitro results suggested a possible role of LC3A, but not of LC3B, in oxidized-CL recognition as a counterweight to excessive apoptosis activation. In the case of LC3C, even if this protein showed a stronger CL binding than LC3B or LC3A, the interaction was less specific, and colocalization of LC3C with mitochondria was not rotenone dependent. These results suggest that, at variance with LC3A, LC3C does not participate in cargo recognition during CL-mediated-mitophagy. The data support the notion that the various LC3-subfamily members might play different roles during autophagy initiation, identifying LC3A as a novel stakeholder in CL-mediated mitophagy. Abbreviations: ACTB/β-actin: actin beta; Atg8: autophagy-related 8; CL: cardiolipin; CCCP: carbonyl cyanide m-chlorophenyl hydrazone; DMSO: dimethyl sulfoxide; DOPE: 1,2-dioleoyl-sn-glycero-3-phosphoethanolamine; DTT: DL-dithiothreitol; FKBP8: FKBP prolyl isomerase 8; GABARAP: GABA type A receptor associated protein; GABARAPL1: GABA type A receptor associated protein like 1; GABARAPL2: GABA type A receptor associated protein like 2; GFP: green fluorescent protein; IMM: inner mitochondrial membrane; LUV/LUVs: large unilamellar vesicle/s; MAP1LC3A/LC3A: microtubule associated protein 1 light chain 3 alpha; MAP1LC3B/LC3B: microtubule associated protein 1 light chain 3 beta; MAP1LC3C/LC3C: microtubule associated protein 1 light chain 3 gamma; NME4/NDPK-D/Nm23-H4: NME/NM23 nucleoside diphosphate kinase 4; O/A: oligomycin A + antimycin A; OMM: outer mitochondrial membrane; PA: phosphatidic acid; PC: phosphatidylcholine; PG: phosphatidylglycerol; PINK1: PTEN induced putative kinase 1; PtdIns4P: phosphatidylinositol-4-phosphate; Rho-PE: lissamine rhodamine phosphatidylethanolamine; SUV/SUVs: small unilamellar vesicle/s.

Keywords: Atg8; LC3/GABARAP-protein family; autophagosome; autophagy cargo recognition; lipid oxidation; lipid-protein interaction; membrane curvature; mitochondria; negatively charged phospholipids.


Conflict of interest statement

No potential conflict of interest was reported by the author(s).

Figures

Figure 1.
Figure 1.
LC3/GABARAP-family members and their interaction with CL. (A) Schematic representation of the 3D structures of yeast Atg8 and of each LC3/GABARAP protein in solution, displayed with PyMOL. PDB: Atg8 (2KQ7), LC3A (5CX3), LC3B (2ZJD), LC3C (2NCN), GABARAP (1GNU), GABARAPL1 (5LXI) and GABARAPL2 (4CO7). The thermodynamically preferred residues for cardiolipin binding on LC3B, identified by docking analysis [16], and their equivalents in the other LC3/GABARAP-family members are highlighted in gray (See Figure 1B). Among them, the two residues in the α1 N-terminal region proposed to be essential for the interaction, and their equivalents in the LC3 subfamily, are colored in blue (positively charged). The amino acid corresponding to R10 of LC3B is a negatively charged residue in the GABARAP subfamily, colored in red (See Figure 1B). (B) Sequence alignment of the human orthologs of Atg8 obtained with Clustal W. UniProt: LC3A (Q9GZQ8), LC3B (Q9GZQ8), LC3C (Q9BXW4), GABARAP (O95166), GABARAPL1 (Q9H0R8) and GABARAPL2 (P60520). The secondary structure elements of LC3B (PDBsum, 2ZJD) are indicated above the alignment as an example. The N-terminal and α-helix 1 (α1) of the two subfamilies are boxed. As in Figure 1A, the thermodynamically preferred residues for cardiolipin binding of LC3B, and their equivalents in the other members of the LC3/GABARAP family are highlighted in gray (gray arrow). The two positively charged α1 N-terminal residues proposed to be essential for the interaction of LC3B with CL and their equivalents are colored; blue: positively charged, red: negatively charged. The C-terminal glycine (black arrow) is conserved in all the LC3/GABARAP-family members.
Figure 2.
Figure 2.
LC3A and LC3C, as well as LC3B, interact with CL-containing model membranes. Interaction of LC3/GABARAP proteins with CL-containing membranes measured by a vesicle flotation assay. (A) Representative scheme of a flotation assay in a sucrose-density gradient. Proteins (10 μM) were incubated with rhodamine-PE (Rho-PE)-labeled LUVs (3 mM) and subsequently mixed within the 1.4 M (final concentration) layer of a discontinuous sucrose gradient. After ultracentrifugation, four equal-volume fractions were collected, 1–4, starting from the bottom; protein found in fractions 3 + 4 was taken as bound protein. (B) Interaction of LC3A, LC3B, LC3C and GABARAPL2 with LUVs containing CL. LUVs were composed of PC:DOPE:CL (33:33:33 mol ratio) + 0.05% Rho-PE. The presence of vesicles and proteins in the different fractions was probed by Rho-PE fluorescence emission and by SDS-PAGE/Coomassie Brillant Blue staining respectively. Bars at the bottom: Rho-PE emission was detected only in fractions 3–4 (i.e., floating fractions). The bars at the right-hand side correspond to the percentage of bound protein, taken as protein co-floating with vesicles and calculated by gel densitometry. Data are means ± SD (n ≥ 9). ***p < 0.001.
Figure 3.
Figure 3.
LC3A and LC3B exhibit a marked specificity for CL. Interaction of LC3 proteins with membranes of different compositions, measured by a vesicle flotation assay. (A) Representative SDS-PAGE Coomassie Brilliant Blue-stained gels of the fractions obtained from LC3A, LC3B or LC3C vesicle flotation assays performed without liposomes (-LUVs) or with liposomes of different compositions, either PC:DOPE (50:50) or PC:DOPE:X (33:33:33 mol ratio) where X was PA, PG, CL or PtdIns4P. Bound protein was computed as the proportion retrieved in fractions 3 + 4 (See Figure 2A). (B) Binding of LC3A, LC3B, and LC3C to liposomes quantified by gel densitometry. Data are means ± SD (n ≥ 3). ***p < 0.001.
Figure 4.
Figure 4.
The higher capacity of LC3C to interact with CL resides in its N-terminal region. (A) Clustal W alignment of LC3B and LC3C amino acid sequences. The N-terminal region of both proteins is boxed. Residues processed by ATG4 and not present in our recombinant proteins are in light gray. (B) 3D outline of the LC3C/B chimera composed of the structures of the LC3C N-terminal region (1–33 amino acids) and 29–120 residues of LC3B. (C) Representative SDS-PAGE/Coomassie Brilliant Blue-stained gels of the fractions obtained from LC3B, LC3C/B or LC3C vesicle flotation assays performed with CL-containing liposomes (PC:DOPE:CL (33:33:33 mol ratio)). Bound protein was computed as the proportion retrieved in fractions 3 + 4 (See Figure 2A) (D) Binding of LC3B, LC3C/B, and LC3C to CL-containing liposomes quantified by gel densitometry. Data are means ± SD (n ≥ 7). ***p < 0.001.
Figure 5.
Figure 5.
The N-terminal regions of LC3A and LC3B are important for their differential interaction with CL. (A) Clustal W alignment of LC3B and LC3A amino acid sequences. The N-terminal region of both proteins is boxed. Residues processed by ATG4 and not present in our recombinant proteins are in light gray (B) 3D outline of the LC3A/B chimera composed of the structures of the LC3A N-terminal region (1–28 amino acids) and 29–120 residues of LC3B. (C) Representative SDS-PAGE/Coomassie Brilliant Blue-stained gels of the fractions obtained from LC3B, LC3A/B or LC3A vesicle flotation assays performed with CL-containing liposomes (PC:DOPE:CL (33:33:33 mol ratio). Bound protein was computed as the proportion retrieved in 3 + 4 (See Figure 2A) (D) Binding of LC3B, LC3A/B, and LC3B to CL-containing liposomes quantified by gel densitometry. Data are means ± SD (n ≥ 8) ***p < 0.001.
Figure 6.
Figure 6.
A14 and K18 residues in LC3A N-terminal region are key for its higher interaction with CL. (A) Comparative analysis of the N-terminal regions of LC3B and LC3A obtained using Clustal W. Amino acids previously proposed to be important in LC3B-CL interaction (R10, R11) and the ones chosen in this study to be mutated (positions 14 and 18) are written in bold and colored; red: negatively charged, blue: positively charged, gray: no charge (B) 3D structures of the N-terminal regions of LC3B and LC3A showing the amino acids chosen for this study and the residues already proposed to be involved in the interaction with CL. (C) Representative SDS-PAGE/Coomassie Brilliant Blue-stained gels of the fractions obtained from LC3B, LC3B-AE (LC3BE14A), LC3B-EK (LC3BE18K), LC3B-AK (LC3BE14A,E18K), LC3A, LC3A-EK (LC3AA14E), LC3A-AE (LC3AK18E), LC3A-EE (LC3AA14E,K18E) vesicle flotation assays performed with CL-containing liposomes (PC:DOPE:CL (33:33:33 mol ratio)). Bound protein was computed as the proportion retrieved in fractions 3 + 4 (see Figure 2A). (D) Binding percentage of LC3B, LC3B-AE (LC3BE14A), LC3B-EK (LC3BE18K), LC3B-AK (LC3BE14A,E18K), LC3A, LC3A-EK (LC3AA14E), LC3A-AE (LC3AK18E), LC3A-EE (LC3AA14E,K18E) to CL-containing liposomes quantified by gel densitometry. Data shown as mean ± SD (n ≥ 5) ANOVA statistical analysis, ***p < 0.001.
Figure 7.
Figure 7.
LC3A and LC3B puncta and their colocalization with mitochondria increase with rotenone treatment. SH-SY5Y cells were transfected with different members of the LC3/GABARAP family tagged with GFP. Mitochondria were labeled using MitoTracker Red, prior to treatment with 1 μM rotenone for 6 h. Vehicle (Veh) controls were treated with DMSO. Images were retrieved using a Nikon Eclipse C1 confocal microscope. Scale bar: 10 μm. At the right-hand side of each condition, MitoTracker (red) and GFP (green) line-profiles show examples of colocalization and non-colocalization events. (A) Representative images of GFP-LC3A SH-SY5Y transfected cells untreated (vehicle) or treated with rotenone. (B) Representative images of GFP-LC3B SH-SY5Y transfected cells untreated (vehicle) or treated with rotenone. (C) Representative images of GFP-LC3C SH-SY5Y transfected cells untreated (vehicle) or treated with rotenone. (Representative images of GFP-GABARAPL2 can be found in Fig. S4C). (D) Number of GFP-LC3A, GFP-LC3B, GFP-LC3C and GFP-GABARAPL2 puncta per cell, an indication of autophagy, in SH-SY5Y cells untreated (Veh) and treated with rotenone (Rot). (E) Percent GFP-LC3A, GFP-LC3B, GFP-LC3C and GFP-GABARAPL2 puncta that colocalize with mitochondria, a signal of mitophagy, in SH-SY5Y cells untreated (Veh) or treated with rotenone (Rot). To compute the percent colocalization, images were analyzed with JACop plugging of ImageJ. At least 30 images were analyzed per condition. ***p < 0.001, **p < 0.01, ns: non-significant.
Figure 8.
Figure 8.
The LC3A-EE double mutation that hampers LC3A binding to CL in vitro also decreases its location to mitochondria in rotenone- and CCCP-induced mitophagy. SH-SY5Y cells were co-transfected with DsRed2-Mito7 (DsRed) and GFP-tagged WT or mutant LC3A. Vehicle (Veh) controls were treated with DMSO. (A) Percent GFP-LC3A or GFP-LC3A-EE puncta that colocalize with mitochondria, a signal of mitophagy, in SH-SY5Y cells untreated (vehicle), or treated with rotenone (1 μM, 6 h), or CCCP (20 μM, 1 h) or O/A (10/4 μM, 6 h). To compute the percent colocalization, images were analyzed with the JACop plugging of ImageJ. At least 30 images were analyzed per condition. *P < 0.05, ns: non-significant. (B) Representative images of GFP-LC3A and GFP-LC3A-EE SH-SY5Y transfected cells treated with 1 μM rotenone for 6 h. (C) Representative images of GFP-LC3A and GFP-LC3A-EE SH-SY5Y transfected cells treated with 20 μM CCCP for 1 h. (D) Representative images of GFP-LC3A and GFP-LC3A-EE SH-SY5Y transfected cells treated with O/A (10/4 μM for 6 h). Images were acquired using a Nikon Eclipse C1 confocal microscope. Scale bar: 10 μm. At the right-hand side of each condition, DsRed (red) and GFP (green) line profiles show examples of co-localization and non-colocalization events.
Figure 9.
Figure 9.
Endogenous LC3A and LC3B are involved in CCCP-induced mitophagy in SH-SY5Y cells. SH-SY5Y cells were used to study the activation of endogenous LC3A and LC3B by western blot after CCCP treatment. Vehicle (Veh) controls were treated with DMSO. (A) Top: Representative western blot of the degradation of the mitochondrial IMM marker COX4I in cells treated with 20 μM CCCP for 4 h or 6 h. Bottom: COX4I:ACTB ratio in treated cells relative to vehicle quantified by gel densitometry. Data shown are means ± SD **P < 0.01. (B) Activation of LC3A and LC3B, shown as an increase of the LC3A-II or LC3B-II corresponding band intensity, in cells treated with 20 μM CCCP for different times (1, 2 and 4 h). (C) Activation of LC3A and LC3B, shown as an increase of the LC3A-II or LC3B-II corresponding band intensity, in cells treated for 4 h with different concentrations of CCCP (5, 10 or 20 μM). (D) Detection of LC3A and LC3B in the mitochondrial fraction in cells treated with 20 μM CCCP for 4 h, COX4I is used as a marker of efficient mitochondrial fractionation. (E) Left: Representative western blot of the degradation of COX4I and the activation of LC3A and LC3B in cells treated with 10 μM CCCP for 4 h where LC3A and/or LC3B had been silenced, compared to control siRNA-transfected cells. Right: Comparison of COX4I:ACTB ratio relative to vehicle in siRNA-transfected cells treated with CCCP, quantified by gel densitometry. Data shown are means ± SD *p < 0.05; ns: non-significant.
Figure 10.
Figure 10.
LC3A, but not LC3B, binds oxidized CL. Interaction of LC3A or LC3B proteins with oxidized membranes measured by a vesicle flotation assay. (A) Lipid oxidation was assessed measuring absorbance at 245 nm (A245) of the PC:DOPE (50:50) or PC:DOPE:CL (33:33:33) liposomes (+CL), treated without (Veh) or with CuCl2 (+CuCl2). Data shown as means ± SD (n ≥ 3). ***p < 0.001. (B and C) Top: Representative SDS-PAGE/Coomassie Brilliant Blue-stained gels of the fractions obtained from LC3A (B) or LC3B (C) vesicle flotation assays performed with liposomes composed of PC:DOPE (50:50) or PC:DOPE:CL (33:33:33) which had been previously treated without (Veh) or with CuCl2. Bound protein is computed as the proportion retrieved in fractions 3 + 4 (See Figure 2A). Bottom: Binding of LC3A (B) or LC3B (C) to non-oxidized and oxidized liposomes, quantified by gel densitometry. Data shown are means ± SD (n ≥ 3). ***p < 0.001; ns: non-significant. (D) Top: Representative SDS-PAGE/Coomassie Brilliant Blue-stained gels of the fractions obtained from LC3A, LC3A-EK (LC3AA14E), LC3A-AE (LC3AK18E)and LC3A-EE (LC3AA14E,K18E) vesicle flotation assays performed with liposomes composed of PC:DOPE:CL (33:33:33) that had been previously treated without (Veh) or with CuCl2. Bottom: Binding of LC3A and LC3A mutants to non-oxidized and oxidized liposomes, quantified by gel densitometry. Data shown are means ± SD (n ≥ 3). ***p < 0.001; ns: non-significant. (E) Top: Representative SDS-PAGE/Coomassie Brilliant Blue-stained gels of the fractions obtained from LC3B, LC3B-AE (LC3BE14A), LC3B-EK (LC3BE18K)and LC3B-AK (LC3BE14A,E18K) vesicle flotation assays performed with liposomes composed of PC:DOPE:CL (33:33:33) which had been previously treated with CuCl2. Bottom: Binding of LC3B and LC3B mutants to oxidized liposomes, quantified by gel densitometry. Data shown are means ± SD (n ≥ 3). **p < 0.01; ns: non-significant.

References

    1. J-h U, Yun J.. Emerging role of mitophagy in human diseases and physiology. BMB Rep. 2017;50:299–307. - PMC - PubMed
    1. Pickles S, Vigié P, Youle RJ. Mitophagy and quality control mechanisms in mitochondrial maintenance. Curr Biol. 2018;28:R170–R185. - PMC - PubMed
    1. Feng Y, He D, Yao Z, et al. The machinery of macroautophagy. Cell Res. 2014;24:24–41. - PMC - PubMed
    1. Schaaf MBE, Keulers TG, Vooijs MA, et al. LC3/GABARAP family proteins: autophagy‐(un)related functions. FASEB J. 2016;30:3961–3978. - PubMed
    1. Jatana N, Ascher DB, Pires DEV, et al. Human LC3 and GABARAP subfamily members achieve functional specificity via specific structural modulations. Autophagy. 2020;16:239–255. - PMC - PubMed

Publication types