

Glucocorticoid receptor modulates myeloid-derived suppressor cell function via mitochondrial metabolism in immune thrombocytopenia
- PMID: 35414712
- PMCID: PMC9243139
- DOI: 10.1038/s41423-022-00859-0
Glucocorticoid receptor modulates myeloid-derived suppressor cell function via mitochondrial metabolism in immune thrombocytopenia
Abstract
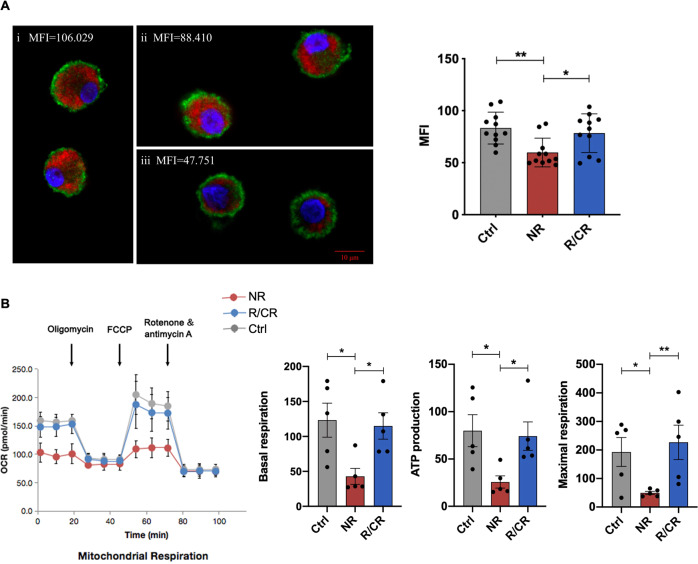
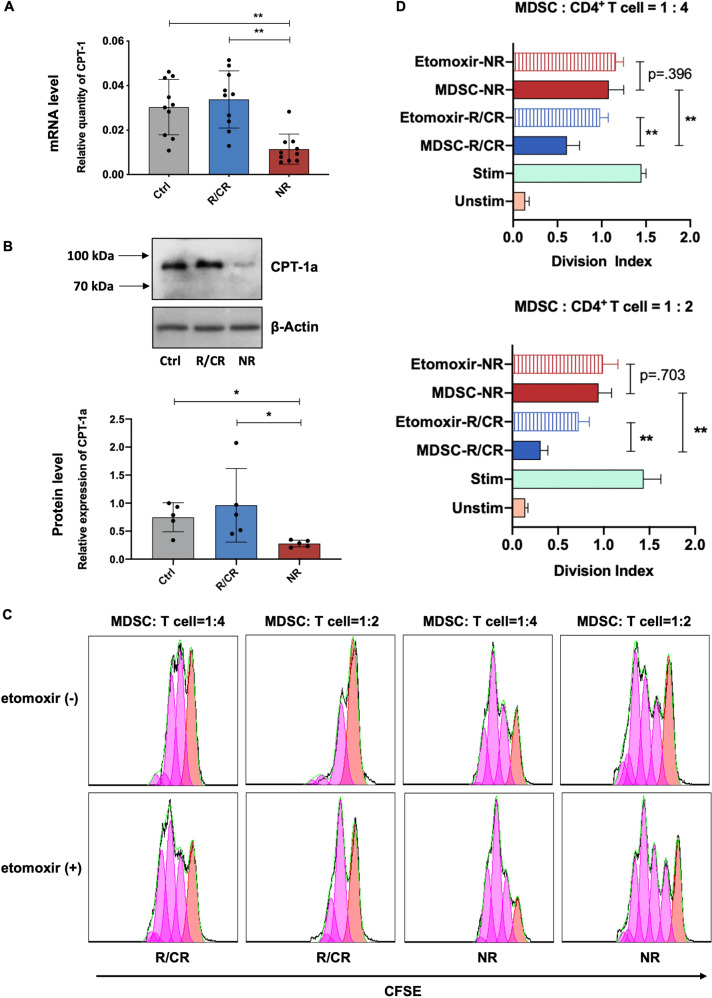
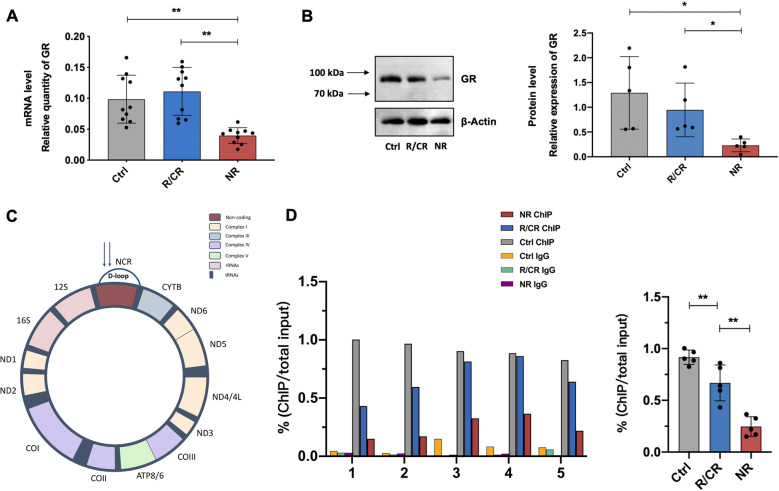
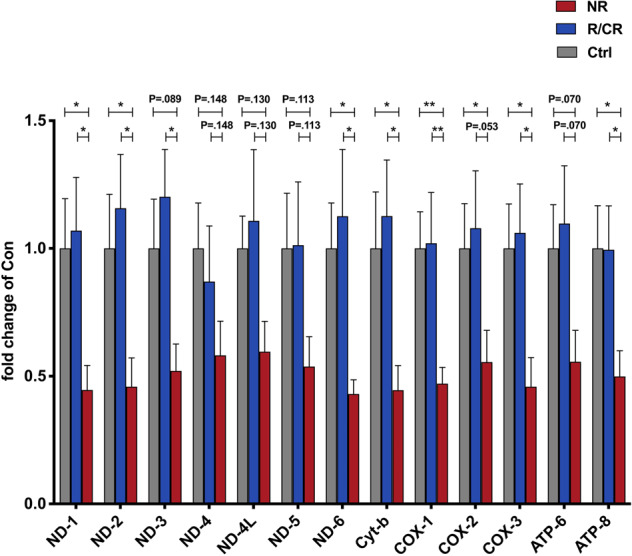
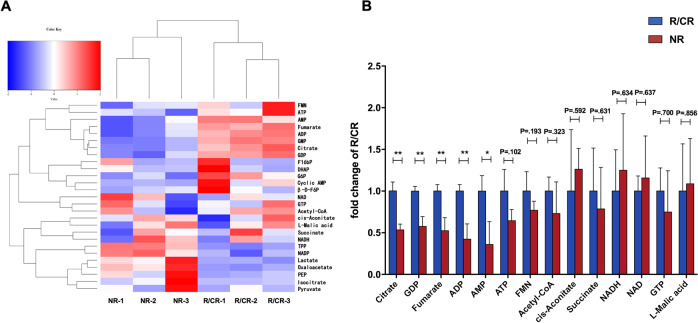
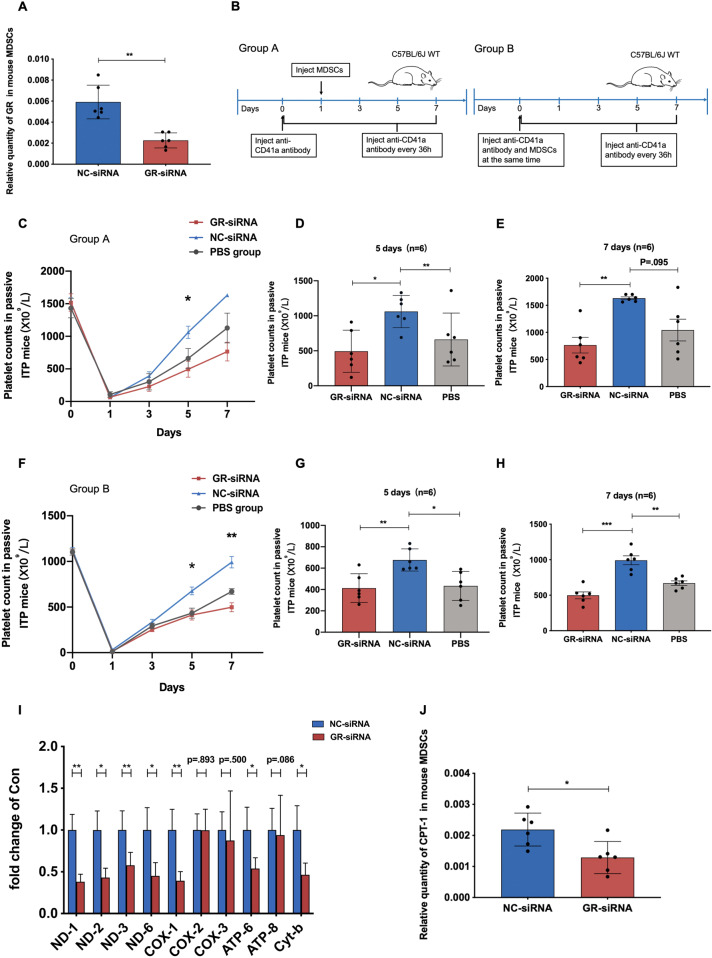
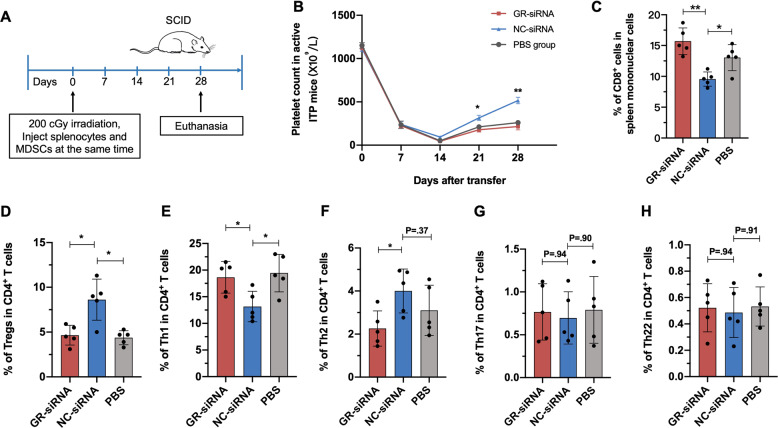
Myeloid-derived suppressor cells (MDSCs) are a heterogeneous population of immature cells and natural inhibitors of adaptive immunity. Intracellular metabolic changes in MDSCs exert a direct immunological influence on their suppressive activity. Our previous study demonstrated that high-dose dexamethasone (HD-DXM) corrected the functional impairment of MDSCs in immune thrombocytopenia (ITP); however, the MDSC population was not restored in nonresponders, and the mechanism remained unclear. In this study, altered mitochondrial physiology and reduced mitochondrial gene transcription were detected in MDSCs from HD-DXM nonresponders, accompanied by decreased levels of carnitine palmitoyltransferase-1 (CPT-1), a rate-limiting enzyme in fatty acid oxidation (FAO). Blockade of FAO with a CPT-1 inhibitor abolished the immunosuppressive function of MDSCs in HD-DXM responders. We also report that MDSCs from ITP patients had lower expression of the glucocorticoid receptor (GR), which can translocate into mitochondria to regulate the transcription of mitochondrial DNA (mtDNA) as well as the level of oxidative phosphorylation. It was confirmed that the expression of CPT-1 and mtDNA-encoded genes was downregulated in GR-siRNA-treated murine MDSCs. Finally, by establishing murine models of active and passive ITP via adoptive transfer of DXM-modulated MDSCs, we confirmed that GR-silenced MDSCs failed to alleviate thrombocytopenia in mice with ITP. In conclusion, our study indicated that impaired aerobic metabolism in MDSCs participates in the pathogenesis of glucocorticoid resistance in ITP and that intact control of MDSC metabolism by GR contributes to the homeostatic regulation of immunosuppressive cell function.
Keywords: HD-DXM; glucocorticoid receptor; immune thrombocytopenia; myeloid-derived suppressor cell.
© 2022. The Author(s), under exclusive licence to CSI and USTC.
Conflict of interest statement
The authors declare no competing interests.
Figures
Comment in
-
Impaired glucocorticoid receptor expression and mitochondrial metabolism in MDSCs contribute to glucocorticoid resistance in immune thrombocytopenia.Cell Mol Immunol. 2022 Jul;19(7):858-860. doi: 10.1038/s41423-022-00880-3. Epub 2022 Jun 15. Cell Mol Immunol. 2022. PMID: 35705696 Free PMC article. No abstract available.
Similar articles
-
High-dose dexamethasone corrects impaired myeloid-derived suppressor cell function via Ets1 in immune thrombocytopenia.Blood. 2016 Mar 24;127(12):1587-97. doi: 10.1182/blood-2015-10-674531. Epub 2016 Jan 7. Blood. 2016. PMID: 26744458
-
Low-dose decitabine modulates myeloid-derived suppressor cell fitness via LKB1 in immune thrombocytopenia.Blood. 2022 Dec 29;140(26):2818-2834. doi: 10.1182/blood.2022016029. Blood. 2022. PMID: 36037415
-
High-dose dexamethasone or all-trans-retinoic acid restores the balance of macrophages towards M2 in immune thrombocytopenia.J Thromb Haemost. 2017 Sep;15(9):1845-1858. doi: 10.1111/jth.13767. Epub 2017 Aug 5. J Thromb Haemost. 2017. PMID: 28682499
-
The role of T cells and myeloid-derived suppressor cells in refractory immune thrombocytopenia.Br J Haematol. 2023 Oct;203(1):54-61. doi: 10.1111/bjh.19079. Br J Haematol. 2023. PMID: 37735552 Free PMC article. Review.
-
Myeloid-derived suppressor cells: The green light for myeloma immune escape.Blood Rev. 2016 Sep;30(5):341-8. doi: 10.1016/j.blre.2016.04.002. Epub 2016 Apr 12. Blood Rev. 2016. PMID: 27132116 Free PMC article. Review.
Cited by
-
Melatonin, BAG-1 and cortisol circadian interactions in tumor pathogenesis and patterned immune responses.Explor Target Antitumor Ther. 2023;4(5):962-993. doi: 10.37349/etat.2023.00176. Epub 2023 Oct 25. Explor Target Antitumor Ther. 2023. PMID: 37970210 Free PMC article. Review.
-
T Cell Energy Metabolism Is a Target of Glucocorticoids in Mice, Healthy Humans, and MS Patients.Cells. 2023 Jan 30;12(3):450. doi: 10.3390/cells12030450. Cells. 2023. PMID: 36766792 Free PMC article.
-
Hyperlipidemia in immune thrombocytopenia: a retrospective study.Thromb J. 2023 Oct 2;21(1):102. doi: 10.1186/s12959-023-00545-9. Thromb J. 2023. PMID: 37784127 Free PMC article.
-
Immunosuppressive regulatory cells in cancer immunotherapy: restrain or modulate?Hum Cell. 2024 Jul;37(4):931-943. doi: 10.1007/s13577-024-01083-w. Epub 2024 May 30. Hum Cell. 2024. PMID: 38814516 Review.
-
Thrombopoietin receptor agonists regulate myeloid-derived suppressor cell-mediated immunomodulatory effects in ITP.Ann Hematol. 2024 Aug;103(8):2729-2741. doi: 10.1007/s00277-024-05846-1. Epub 2024 Jun 19. Ann Hematol. 2024. PMID: 38890176
References
-
- Zufferey A, Kapur R, Semple JW. Pathogenesis and therapeutic mechanisms in immune thrombocytopenia (ITP). J Clin Med. 2017;6:16. - PubMed
-
- Semple JW, Rebetz J, Maouia A, Kapur R. An update on the pathophysiology of immune thrombocytopenia. Curr Opin Hematol. 2020;27:423–9. - PubMed
-
- Cooper N, Ghanima W. Immune thrombocytopenia. N. Engl J Med 2019;381:945–55. - PubMed
-
- Guo L, Yang L, Speck ER, Aslam R, Kim M, McKenzie CGJ, et al. Allogeneic platelet transfusions prevent murine T-cell-mediated immune thrombocytopenia. Blood. 2014;123:422–7. - PubMed
-
- Guo L, Kapur R, Aslam R, Speck ER, Zufferey A, Zhao Y, et al. CD20+ B-cell depletion therapy suppresses murine CD8+ T-cell-mediated immune thrombocytopenia. Blood. 2016;127:735–8. - PubMed
Publication types
MeSH terms
Substances
LinkOut - more resources
Full Text Sources
