. 2022 Mar 6;18(6):2345-2361.
doi: 10.7150/ijbs.70137. eCollection 2022.

MGP promotes CD8+ T cell exhaustion by activating the NF-κB pathway leading to liver metastasis of colorectal cancer

Affiliations

MGP promotes CD8+ T cell exhaustion by activating the NF-κB pathway leading to liver metastasis of colorectal cancer

Dawei Rong et al. Int J Biol Sci. .

Abstract

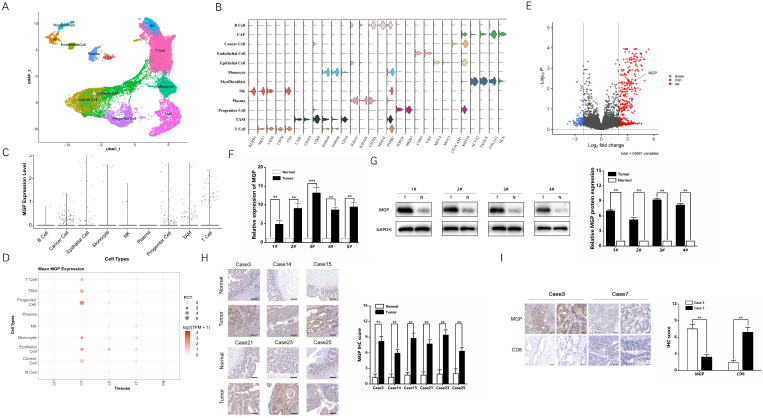
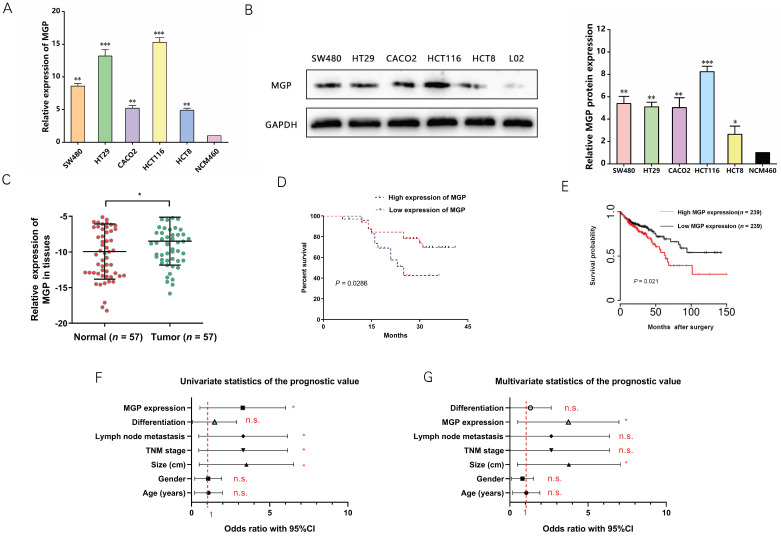
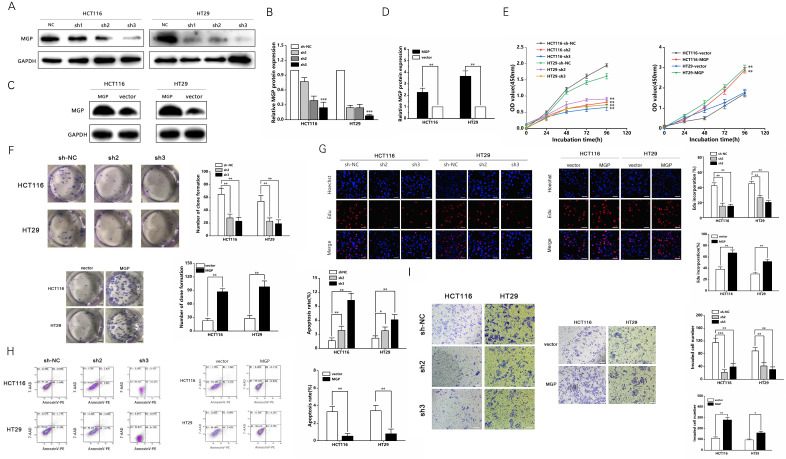
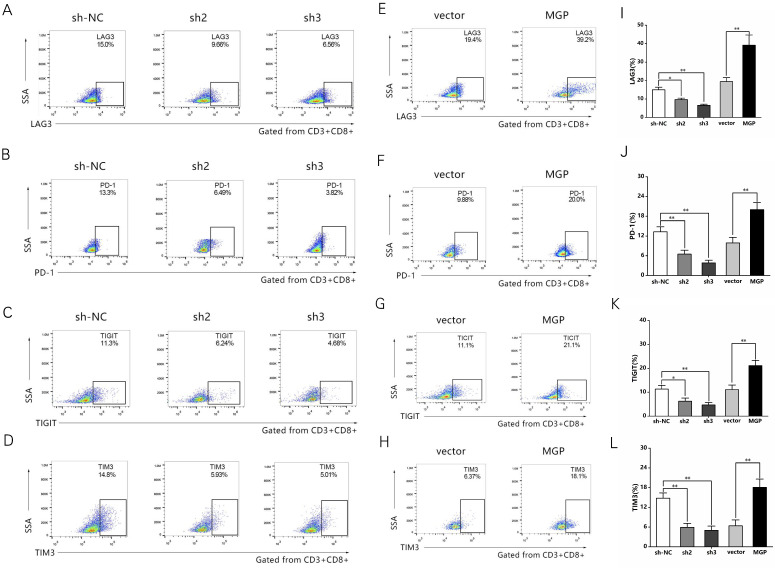
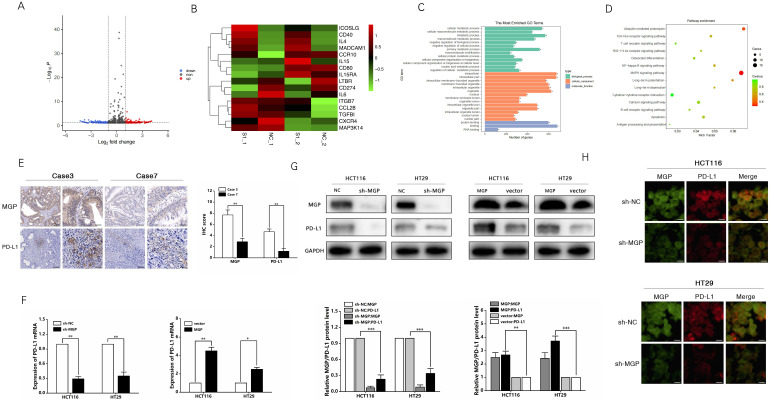
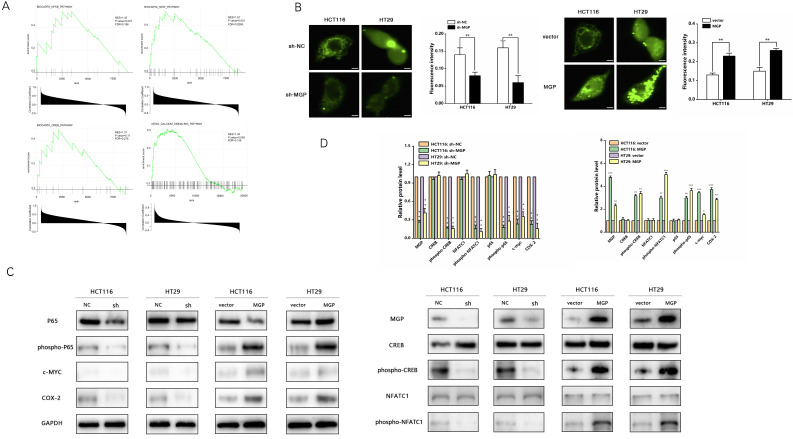
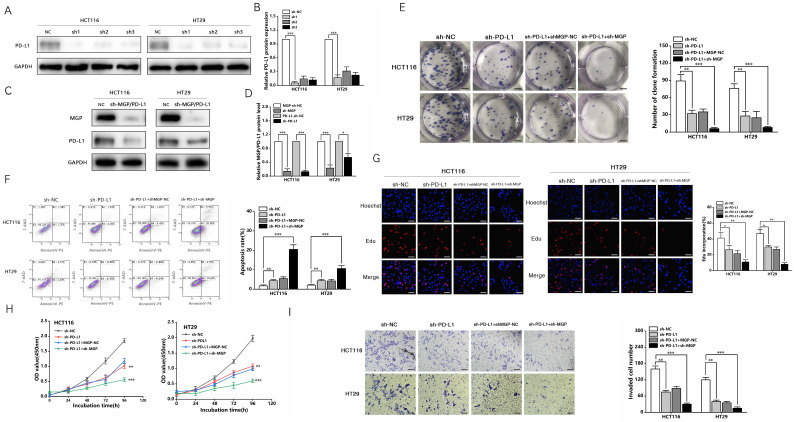
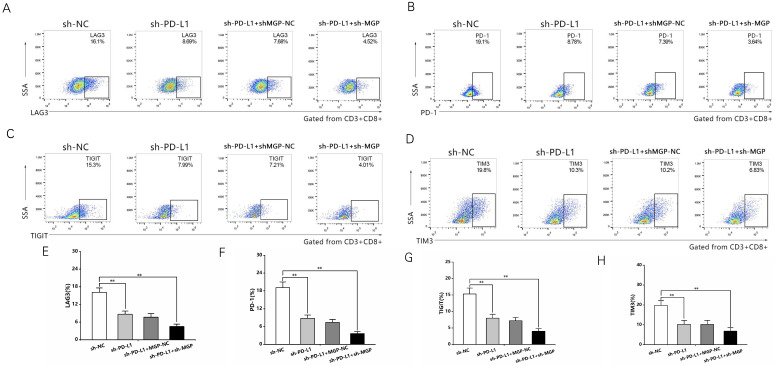
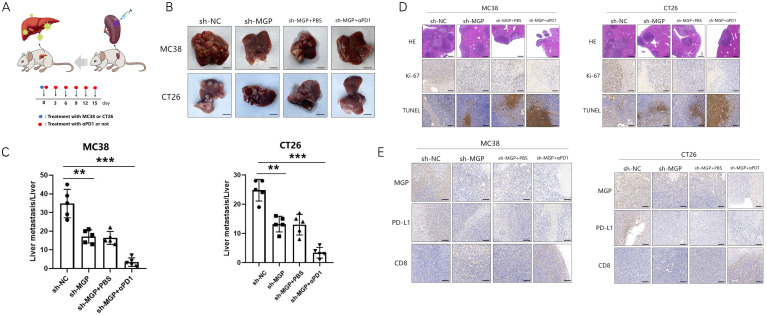
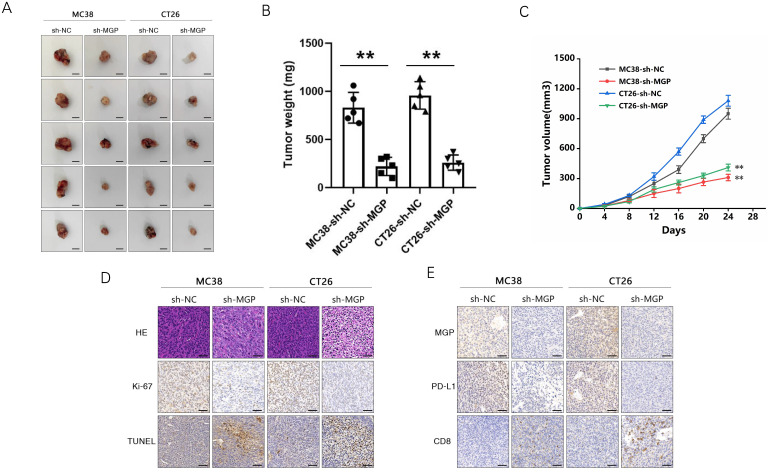
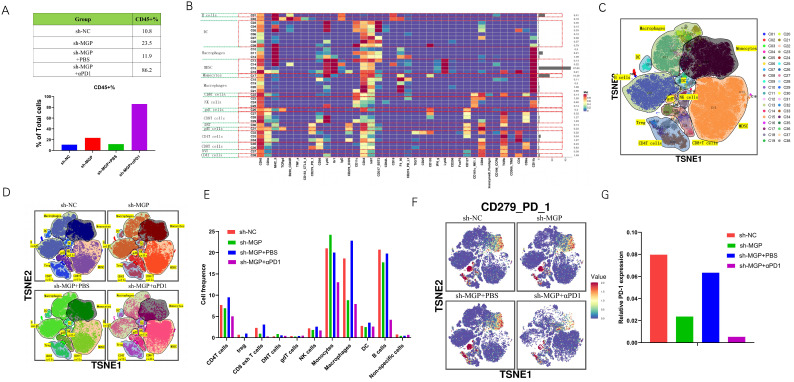
Matrix Gla protein (MGP) was originally reported as a physiological suppressor of ectopia calcification and has also been reported to be associated with cancer. However, the relation between the biological functions of MGP and the immune response in colorectal cancer (CRC) remains unclear. Here, we investigated the regulatory role of MGP in the immune microenvironment of CRC. MGP expression in CRC samples was assessed by single-cell RNA sequencing and the Gene Expression Omnibus (GEO) database, and confirmed by quantitative real-time Polymerase Chain Reaction (qRT-PCR) and immunohistochemistry analysis of human CRC samples. The effect of MGP on proliferation and invasion of CRC cells was evaluated by in vitro assays involving MGP knockdown and overexpression. Luciferase reporter assay and chromatin immunoprecipitation (ChIP)-qPCR assay were performed to identify transcriptional regulatory sites of the nuclear factor kappa-B (NF-κB) and programmed cell death ligand 1 (PD-L1). In vivo experiments were performed in mouse model of CRC liver metastasis established via spleen injection. The results revealed that MGP was significantly upregulated in cancer cell clusters from the primary CRC or liver metastases, compared with that in the corresponding paracancerous tissues via single-cell RNA sequencing. MGP enriched intracellular free Ca2+ levels and promoted NF-κB phosphorylation, thereby activated PD-L1 expression to promote CD8+ T cell exhaustion in CRC. The luciferase reporter assay and ChIP-qPCR assay indicated that the transcriptional regulation of NF-κB upregulated PD-L1 expression. In vivo, MGP inhibition significantly decreased the rate of CRC liver metastasis, which was further reduced after combined therapy with αPD1 (anti-PD1). In conclusions, this study revealed that MGP can facilitate CD8+ T cell exhaustion by activating the NF-κB pathway, leading to liver metastasis of CRC. The combination of MGP knockdown and αPD1 can synergistically resist liver metastasis of CRC.

Keywords: MGP; PD-L1; colorectal cancer; immune escape; liver metastasis.


Conflict of interest statement

Competing Interests: The authors have declared that no competing interest exists.

Figures

Figure 1
Figure 1
MGP was overexpressed in CRC tissues compared with that in the adjacent colorectal tissues. (A) UMAP plot showing clusters of all cells from CRC case. There were 12 groups defined (B cell, CAF, cancer cell, endothelial cell, epithelial cell, monocytes, myofibroblast, NK cell, plasma, progenitor cell, TAM, and T cell).(B) The violin plot showing marker gene expression in different cell clusters. (C) The bar chart showing MGP expression in different cell clusters. More number of points indicates greater number of cells. (D) The dot plot showing MGP expression in different cell clusters from different samples. CP, paracancerous tissue of the primary CRC; CT, primary CRC tissue; LP, paracancerous tissue of liver metastasis; LT, liver metastatic tissue; and PB, preoperative blood. (E) Volcanic map of differential genes of the primary and secondary foci in mouse model of CRC liver metastasis. Red color indicates higher expression in metastatic foci than that in the primary foci, whereas blue color indicates lower expression. MGP is indicated by arrows. (F) The mRNA expression of MGP in CRC tissues and normal tissues based on qRT-PCR. In general, five pairs (1#-5#) of tissues were tested.(G) The protein expression of MGP in CRC tissues and normal tissues based on western blotting. Four pairs of tissues were tested in total (1#-4#). The upper image represents the result of protein banding and the lower image illustrates the result of protein gray value analysis. (H) Immunohistochemistry was used to verify the protein expression of MGP in CRC tissues and paracancerous tissues collected from six cases. The left panel displays the image. The right panel represents the analysis result.(I) Immunohistochemistry was used to verify the protein expressions of MGP and CD8 in CRC tissues of two cases (case 3 with high MGP expression and case 7 with low MGP expression). The left panel displays the image. The right panel represents the analysis result.**, P < 0.01; ***, P < 0.001.
Figure 2
Figure 2
High expression of MGP indicated a worse clinical prognosis in CRC. (A) qRT-PCR for the abundance of MGP mRNA in CRC cells (SW480, HT29, CACO2, HCT116, and HCT8) and normal cells (NCM460). (B) Western blotting for the abundance of MGP protein in CRC cells and normal cells. The left panel illustrates the results of protein banding, and the right panel represents the results of protein gray value analysis. (C) MGP expression was measured by qRT-PCR in 57 pairs of CRC tumor tissues (Tumor) and matched noncancerous tissues (Normal). (D) Kaplan Meier survival curve revealed the correlation between MGP expression and overall survival. (E) Survival time analysis of the TCGA dataset. (F-G) Univariate (F) and Multivariate (G) regression analysis showing predictors of CRC prognosis.*, P < 0.05; **, P < 0.01; ***, P < 0.001; n.s., no significance.
Figure 3
Figure 3
MGP promoted the proliferation and invasion of CRC cells. (A) Three shRNAs (sh1, sh2, and sh3) were designed to silence MGP in CRC cells (HCT116 and HT29), and validated by western blotting. (B) The gray value analysis results of A. (C) MGP overexpression was validated by western blotting in CRC cells (HCT116 and HT29). (D) The gray value analysis results of C. (E) The growth curves of cells were plotted after transfection with sh2/3-MGP/MGP based on CCK-8 assay. Left panel represents the cell proliferation result after MGP knockdown, and the right panel illustrates the cell proliferation result after MGP overexpression. (F) Colony formation assay was performed to assess cell proliferation. Left panel represents the cell proliferation after MGP knockdown and overexpression. Right panel displays the result of cell count analysis. (G) EdU assay was performed to assess cell proliferation of CRC cells transfected with sh2/3-MGP/MGP. The left panel represents the cell proliferation after MGP knockdown and overexpression. The right panel displays the result of cell count analysis. (H) Flow cytometry was used to assess cell apoptosis in CRC cells transfected with sh2/3-MGP/MGP. The left panel displays the cell apoptosis result after MGP knockdown and overexpression. The right panel represents the result of apoptotic cell count analysis. (I) Transwell invasion assay was performed to assess invasion of CRC cells transfected with sh2/3-MGP/MGP. The left panel shows the cell invasion result after MGP knockdown and overexpression. The right panel displays the result of migrated cell count analysis. *, P < 0.05; **, P < 0.01; ***, P < 0.001.
Figure 4
Figure 4
MGP induced CD8+ T cell exhaustion when co-cultured with antigen-specific CD8+ T cells isolated from PBMC samples. (A-D) CRC cells treated with sh2/3-MGP/MGP were co-cultured with antigen-specific CD8+ T cells, and the expression of common markers of CD8+ T cell exhaustion (LAG3, PD1, TIGIT, and TIM3) was measured by flow cytometry. (E-H) CRC cells with MGP overexpression were co-cultured with antigen-specific CD8+ T cells, and the expression of common markers of CD8+ T cell exhaustion (LAG3, PD1, TIGIT, and TIM3) was measured by flow cytometry. (I-L) Statistical analysis of flow cytometry data presented in A-H. *, P < 0.05; **, P < 0.01.
Figure 5
Figure 5
MGP upregulated PD-L1 expression in CRC. (A) RNA sequencing was used to assess differentially expressed mRNAs in the sh-MGP and sh-NC groups. In Volcano map, red color indicates higher expression of genes in the sh-MGP group than that in the sh-NC group, and blue represents lower expression. (B) Heatmap of differentially expressed mRNAs in the sh-MGP and sh-NC groups. The more intense the red color, the higher the expression. (C) GO analysis of mRNAs in CRC cells treated with sh-MGP and sh-NC. (D) KEGG pathway analysis of mRNAs in CRC cells treated with sh-MGP and sh-NC. The bigger the bubble, the more is the number of genes. (E) Immunohistochemistry was employed to verify the protein expressions of MGP and PD-L1 in CRC tissues of two cases (case 3 with a high MGP expression and case 7 with a low MGP expression). (F) The mRNA expression of PD-L1 in CRC cells with MGP knockdown or overexpression was assessed by qRT-PCR. (G) The protein expression of MGP and PD-L1 in CRC cells with MGP knockdown or overexpression. The upper panel represents the variation of protein bands, and the lower panel illustrates the protein gray value analysis. (H) Immunofluorescence was employed to verify MGP and PD-L1 expression in CRC cells with MGP knockdown. *, P < 0.05; **, P < 0.01; ***, P < 0.001.
Figure 6
Figure 6
MGP promoted calcium influx and activated the NF-κB pathway. (A) GSEA analysis was used to predict the pathways of MGP enrichment; overall, four pathways were selected. Although the P value of MGP and CREB pathway enrichment was 0.11, its enrichment was obvious. (B) Immunofluorescence assay was performed to detect the calcium influx in CRC cells with MGP knockdown or overexpression. The respective images are accompanied by quantitative calcium ion fluorescence analysis. (C) Western blotting revealed the expression of p65, phospho-p65, CREB, phospho-CREB, NFATC1, phospho-NFATC1, c-MYC, and COX-2 in CRC cells with MGP knockdown or overexpression. (D) Protein gray value analysis result of C.*, P < 0.05; **, P < 0.01; ***, P < 0.001.
Figure 7
Figure 7
NF-κB transcription induced the expression of PD-L1 in CRC cells. (A) The mRNA expression of PD-L1 in CRC cells with p65 knockdown. We used sh2-p65 to downregulate p65. (B) The protein expression phosphorpho-p65 and PD-L1 in CRC cells with p65 knockdown. Left panel represents the result of protein banding. Right panel illustrates the result of protein gray value analysis. (C) According to the JASPAR database analysis, the promoters of the PD-L1 gene can comprise five p65 binding sites (P1, P2, P3, P4, and P5). (D) ChIP assay confirmed that p65 can be directly correlated with the PD-L1 promoters within P5, while it has no obvious significance in other sites (P1, P2, P3, and P4). (E) PD-L1 promoter-driven reporter activity was measured under MGP overexpression or MGP plus silencing p65 using si-p65. (F) The detection of the five sites tended to narrow down and respectively showed the promoter-driven reporter activity of PD-L1. (G) The luciferase reporter gene experiment revealed the result of the mutated (M5) and WT (wild type) sequence affecting the promoter-driven reporter activity of PD-L1 under MGP overexpression.*, P < 0.05; **, P < 0.01.
Figure 8
Figure 8
sh-MGP and sh-PD-L1 inhibited the proliferation and invasion of CRC cells. (A) Three shRNA against PD-L1 (sh-PD-L1) were designed to silence PD-L1 in CRC cells, and validated by western blotting. (B) The gray value analysis result of A. (C) sh3-MGP and sh3-PD-L1 was validated by western blotting in CRC cells. (D) The gray value analysis result of C. (E) Colony formation assay was performed to assess cell proliferation in four groups. (F) Flow cytometry was used to assess cell apoptosis in four groups. (G) EdU assay of CRC cells transfected with sh-PD-L1/sh-PD-L1+sh-MGP was performed to assess cell proliferation. (H) The growth curves of cells after transfection with sh-PD-L1/sh-PD-L1+sh-MGP using CCK-8 assay. (I) Transwell invasion assay was used to assess cell invasion in four groups. *, P < 0.05; **, P < 0.01; ***, P < 0.001.
Figure 9
Figure 9
sh-MGP and sh-PD-L1 reduced CD8+ T cell exhaustion when co-cultured with antigen-specific CD8+ T cells isolated from PBMC samples. (A-D) CRC cells with sh-PD-L1/sh-MGP+sh-PD-L1 were co-cultured with antigen-specific CD8+ T cells, and the expression of common markers of CD8+ T cell exhaustion (TIGIT, LAG3, PD1, and TIM3) was measured by flow cytometry. (E-H) Statistical analysis of flow cytometry data presented in A-D. **, P < 0.01.
Figure 10
Figure 10
Inhibition of MGP reduced liver metastasis and increased the efficacy of αPD1 treatment against CRC. (A) Procedure for establishing liver metastasis of CRC. PD1 antibody was injected intraperitoneally on the day of spleen injection and every three days thereafter. (B) Representative images of liver metastases in the respective groups (sh-NC, sh-MGP, sh-MGP+PBS, and sh-MGP+αPD1). (C) Analysis of liver metastases in the respective groups. (D) Liver metastases in four groups were confirmed by HE staining. Immunohistochemistry result of Ki-67 and TUNEL expression in the respective groups. (E) Immunohistochemistry results of MGP, PD-L1, and CD8 expression in the respective groups. **, P < 0.01; ***, P < 0.001.
Figure 11
Figure 11
Inhibition of MGP inhibited subcutaneous tumor of CRC cells. (A) Representative images of subcutaneous tumors in the respective groups (sh-NC and sh-MGP). (B-C) The volume (B) and weight (C) statistics of subcutaneous tumors in the respective groups (sh-NC and sh-MGP). (D) The tumors were confirmed by HE staining. Immunohistochemistry result of Ki-67 and TUNEL expression in the respective groups. (E) Immunohistochemistry result of MGP, PD-L1, and CD8 expression in the respective groups.**, P < 0.01.
Figure 12
Figure 12
Mass cytometry reflected the immune microenvironment of CRC liver metastasis after sh-MGP/sh-MGP+αPD1 treatment. (A) We cycled the selected single, live, and intact CD45+ immune cells from the liver cancer tissues of the respective groups of and calculated the number of CD45+ cells in each group. (B) There were 38 cell clusters in total, which were defined in the respective groups. (C) TSNE plot showing distribution of 38 cell clusters. (D) TSNE diagram showing distribution of cell clusters in the respective samples. (E) The histogram showing the number of the respective cell clusters in different groups by mass cytometry. (F) TSNE plot showing distribution of PD1 in four groups. (G) The histogram showing the number of PD1+ cell clusters in different groups.

References

    1. Danese E, Montagnana M. Epigenetics of colorectal cancer: emerging circulating diagnostic and prognostic biomarkers. Ann Transl Med. 2017;5(13):279. - PMC - PubMed
    1. Qiu H, Cao S, Xu R. Cancer incidence, mortality, and burden in China: a time-trend analysis and comparison with the United States and United Kingdom based on the global epidemiological data released in 2020. Cancer Commun (Lond) 2021;41(10):1037–1048. - PMC - PubMed
    1. Ullah MF, Fleming CA, Mealy K. Changing trends in age and stage of colorectal cancer presentation in Ireland - From the nineties to noughties and beyond. Surgeon. 2018;16(6):350–4. - PubMed
    1. Stagnitti A, Barchetti F, Barchetti G, Pasqualitto E, Sartori A, Glorioso M. et al. Preoperative staging of colorectal cancer using virtual colonoscopy: correlation with surgical results. Eur Rev Med Pharmacol Sci. 2015;19(9):1645–51. - PubMed
    1. Chinese Journal of C. The 150 most important questions in cancer research and clinical oncology series: questions 6-14: Edited by Chinese Journal of Cancer. Chin J Cancer. 2017;36(1):33. - PMC - PubMed

Publication types