

Complete head cerebral sensitivity mapping for diffuse correlation spectroscopy using subject-specific magnetic resonance imaging models
- PMID: 35414976
- PMCID: PMC8973189
- DOI: 10.1364/BOE.449046
Complete head cerebral sensitivity mapping for diffuse correlation spectroscopy using subject-specific magnetic resonance imaging models
Erratum in
-
Erratum: Complete head cerebral sensitivity mapping for diffuse correlation spectroscopy using subject-specific magnetic resonance imaging models: errata.Biomed Opt Express. 2023 Jun 13;14(7):3343. doi: 10.1364/BOE.497495. eCollection 2023 Jul 1. Biomed Opt Express. 2023. PMID: 37497488 Free PMC article.
Abstract
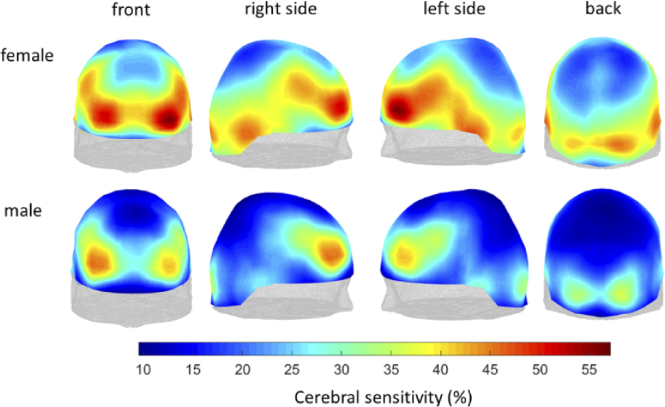
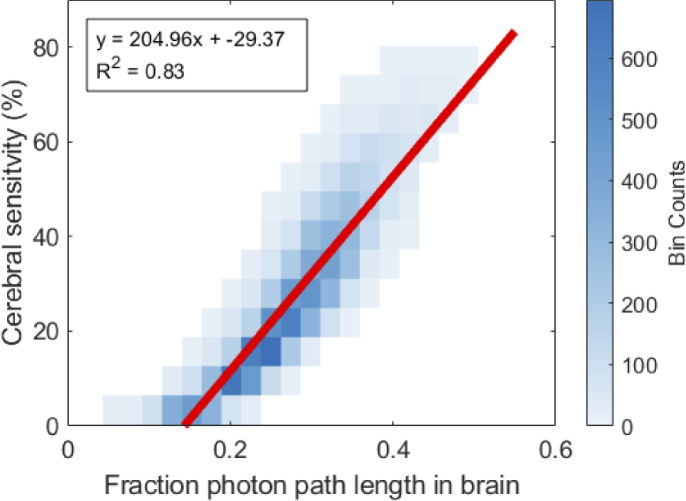
We characterize cerebral sensitivity across the entire adult human head for diffuse correlation spectroscopy, an optical technique increasingly used for bedside cerebral perfusion monitoring. Sixteen subject-specific magnetic resonance imaging-derived head models were used to identify high sensitivity regions by running Monte Carlo light propagation simulations at over eight hundred uniformly distributed locations on the head. Significant spatial variations in cerebral sensitivity, consistent across subjects, were found. We also identified correlates of such differences suitable for real-time assessment. These variations can be largely attributed to changes in extracerebral thickness and should be taken into account to optimize probe placement in experimental settings.
© 2022 Optica Publishing Group under the terms of the Optica Open Access Publishing Agreement.
Conflict of interest statement
MAF has a financial interest in 149 Medical, Inc., a company developing DCS technology for assessing and monitoring cerebral blood flow in newborn infants. MAF’s interests were reviewed and are managed by Massachusetts General Hospital and Mass General Brigham in accordance with their conflict of interest policies (I).
Figures


References
-
- Mesquita R. C., Durduran T., Yu G., Buckley E. M., Kim M. N., Zhou C., Choe R., Sunar U., Yodh A. G., “Direct measurement of tissue blood flow and metabolism with diffuse optics,” Philosophical Transactions of the Royal Society A: Mathematical, Physical and Engineering Sciences 369(1955), 4390–4406 (2011).10.1098/rsta.2011.0232 - DOI - PMC - PubMed
-
- Zavriyev A. I., Kaya K., Farzam P., Farzam P. Y., Sunwoo J., Jassar A. S., Sundt T. M., Carp S. A., Franceschini M. A., Qu J. Z., “The role of diffuse correlation spectroscopy and frequency-domain near-infrared spectroscopy in monitoring cerebral hemodynamics during hypothermic circulatory arrests,” JTCVS Tech 7, 161–177 (2021).10.1016/j.xjtc.2021.01.023 - DOI - PMC - PubMed
-
- Baker W. B., Balu R., He L., Kavuri V. C., Busch D. R., Amendolia O., Quattrone F., Frangos S., Maloney-Wilensky E., Abramson K., Mahanna Gabrielli E., Yodh A. G., Andrew Kofke W., “Continuous non-invasive optical monitoring of cerebral blood flow and oxidative metabolism after acute brain injury,” J Cereb Blood Flow Metab 39(8), 1469–1485 (2019).10.1177/0271678X19846657 - DOI - PMC - PubMed
Grants and funding
LinkOut - more resources
Full Text Sources