. 2022 Feb 22;13(3):1609-1619.
doi: 10.1364/BOE.450212. eCollection 2022 Mar 1.

Small form factor flow virometer for SARS-CoV-2

Affiliations

Small form factor flow virometer for SARS-CoV-2

Rubaiya Hussain et al. Biomed Opt Express. .

Abstract

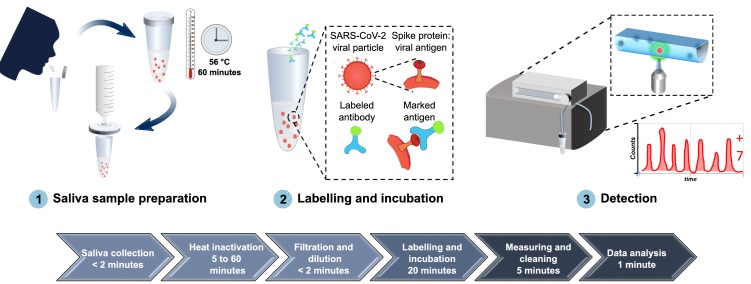
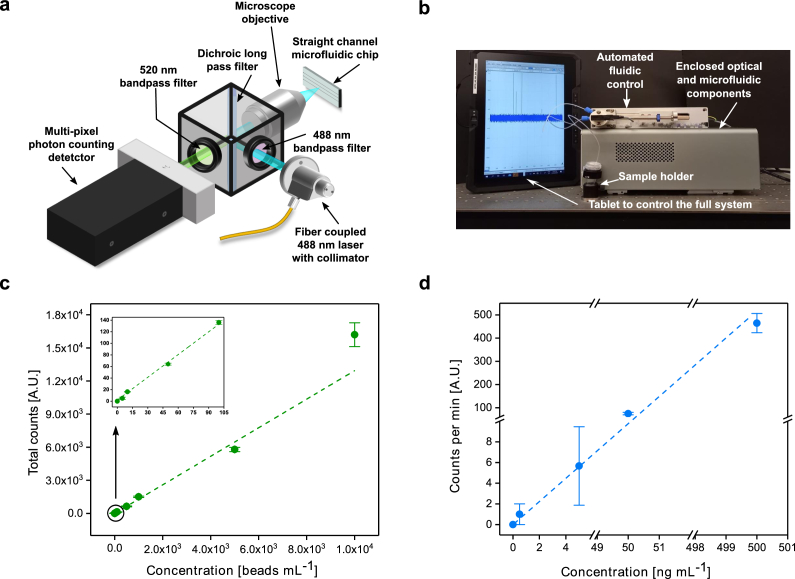
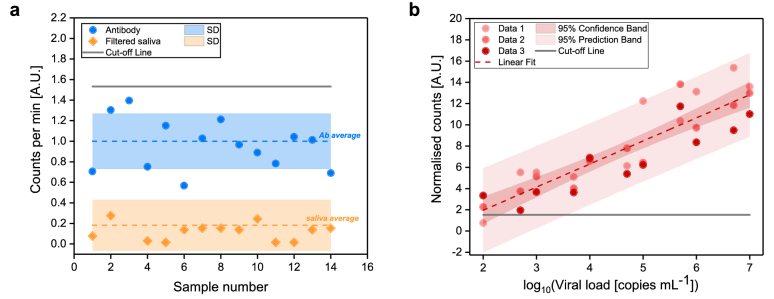
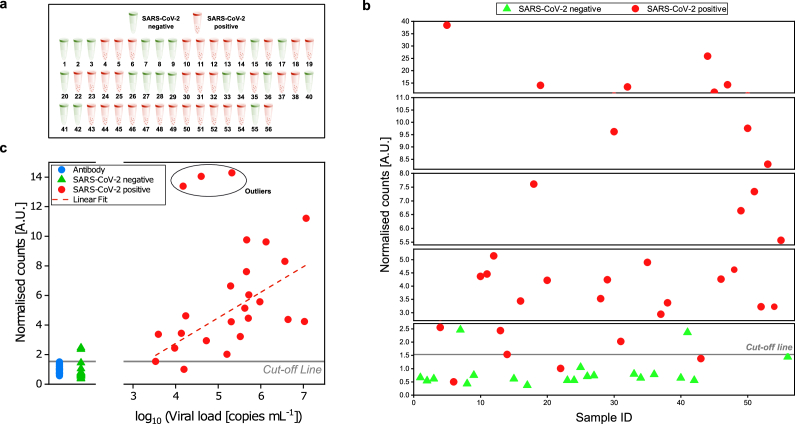
Current diagnostics of severe acute respiratory syndrome coronavirus 2 (SARS-CoV-2) infection heavily rely on reverse transcription-polymerase chain reaction (RT-PCR) or on rapid antigen detection tests. The former suffers from long time-to-result and high cost while the latter from poor sensitivity. Therefore, it is crucial to develop rapid, sensitive, robust, and inexpensive methods for SARS-CoV-2 testing. Herein, we report a novel optofluidic technology, a flow-virometry reader (FVR), for fast and reliable SARS-CoV-2 detection in saliva samples. A small microfluidic chip together with a laser-pumped optical head detects the presence of viruses tagged with fluorescent antibodies directly from saliva samples. The technology has been validated using clinical samples with high sensitivity (91.2%) and specificity (90%). Thanks also to its short time-to-result (<30 min) and small size (25 × 30 × 13 cm), which can be further reduced in the future, it is a strong alternative to existing tests, especially for point-of-care (POC) and low resource settings.


Conflict of interest statement

V.P. is one of the inventors of patent application WO2020212628A1, related to the FVR technology.

Figures

Fig. 1.
Fig. 1.
A comprehensive overview of the developed diagnostic method for detection of SARS-CoV-2 antigen, from sample collection to SARS-CoV-2 antigen measurement. 1) Saliva is collected by spit, heat inactivated at 56°C for 1 hour, diluted in PBS and filtered with a 0.2 µm syringe filter. 2) The sample is then labelled with Alexa 488-anti-SARS-CoV spike antibodies and incubated for 20 minutes at room temperature. 3) The labelled sample is circulated inside the FVR and a fluorescence signal is detected every time antibody-virus complexes pass through the interrogation point.
Fig. 2.
Fig. 2.
FVR characterization. (a) A schematic diagram of the FVR detection system. (b) A lab built FVR prototype with the tablet. (c) Standard curve of the polystyrene beads concentration vs. total counts, R2 = 0.99. (d) Standard curve of the fluorescent (Alexa 488) anti-SARS-CoV spike antibody concentration vs. counts per minute, R2 = 0.94. For visual representation purposes the y-axis is broken into two regions [0:10], [60:100] and the x-axis into three [0:6], [49:52] and [498:501]. The error bar represents the standard deviation.
Fig. 3.
Fig. 3.
Determination of FVR cut-off value and standard curve for SARS-CoV-2 detection (a) Counted events per minute of the Alexa 488-anti-SARS-CoV spike antibody (blue) and of filtered saliva samples (orange). Mean values (dotted lines) and standard deviations (shaded area) are indicated. Cut-off, according to the antibody signal (blue), was calculated as mean plus two times its standard deviation and indicated as solid line. (b) Standard curve of the SARS-CoV-2 viral particles concentration vs. normalised counts; R2 = 0.94.
Fig. 4.
Fig. 4.
Detection of SARS-CoV-2 in saliva samples from SARS-CoV-2 infected and uninfected individuals. SARS-CoV-2 was determined in saliva samples from both SARS-CoV-2 infected (n = 34) and uninfected (n = 20) individuals in a blind test. (a) Sample identification by color code (red: SARS-CoV-2 positive samples; green: SARS-CoV-2 uninfected samples) according to RT-qPCR. (b) Distribution of saliva samples showing the normalized count obtained with the FVR. (c) Correlation between normalized counts and RT-qPCR viral load [copies mL-1] of blind test samples. The dashed line indicates a linear fit (R2 = 0.43) to the data from positive samples that fall within our analytical range excluding the outliers marked with a circle. Here outliers are defined as data points whose residual values are greater than two times the standard deviation of all the data points.

References

    1. Mercer T. R., Salit M., “Testing at scale during the COVID-19 pandemic,” Nat. Rev. Genet. 22(7), 415–426 (2021).10.1038/s41576-021-00360-w - DOI - PMC - PubMed
    1. Cohen K., Leshem A., “Suppressing the impact of the COVID-19 pandemic using controlled testing and isolation,” Sci. Rep. 11(1), 6279 (2021).10.1038/s41598-021-85458-1 - DOI - PMC - PubMed
    1. Kevadiya B.D., Machhi J., Herskovitz J., Oleynikov M.D., Blomberg W.R., Bajwa N., Soni D., Das S., Hasan M., Patel M., Senan A.M., Gorantla S., McMillan J., Edagwa B., Eisenberg R., Gurumurthy C.B., Reid S.P.M., Punyadeera C., Chang L., Gendelman H.E., “Diagnostics for SARS-CoV-2 infections,” Nat. Mater. 20(5), 593–605 (2021).10.1038/s41563-020-00906-z - DOI - PMC - PubMed
    1. Ji T., Liu Z., Wang G., Guo X., Akbar S., “Detection of COVID-19: a review of the current literature and future perspectives,” Biosens. Bioelectron. 166, 112455 (2020).10.1016/j.bios.2020.112455 - DOI - PMC - PubMed
    1. Park M., Won J., Choi B. Y., Lee C. J., “Optimization of primer sets and detection protocols for SARS-CoV-2 of coronavirus disease 2019 (COVID-19) using PCR and real-time PCR,” Exp. Mol. Med. 52(6), 963–977 (2020).10.1038/s12276-020-0452-7 - DOI - PMC - PubMed

LinkOut - more resources