. 2022 Apr 5;14(1):e12307.
doi: 10.1002/dad2.12307. eCollection 2022.

Plasma p217+tau versus NAV4694 amyloid and MK6240 tau PET across the Alzheimer's continuum

Affiliations

Plasma p217+tau versus NAV4694 amyloid and MK6240 tau PET across the Alzheimer's continuum

Vincent Doré et al. Alzheimers Dement (Amst). .

Abstract

Introduction: We evaluated a new Simoa plasma assay for phosphorylated tau (P-tau) at aa217 enhanced by additional p-tau sites (p217+tau).

Methods: Plasma p217+tau levels were compared to 18F-NAV4694 amyloid beta (Aβ) positron emission tomography (PET) and 18F-MK6240 tau PET in 174 cognitively impaired (CI) and 223 cognitively unimpaired (CU) participants.

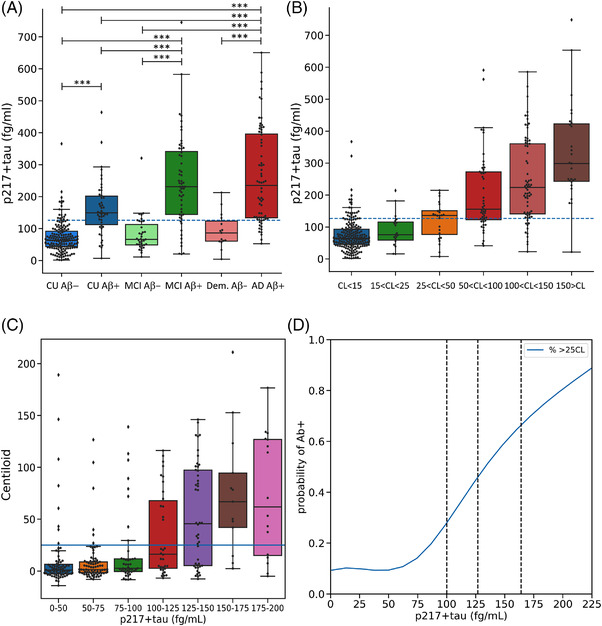
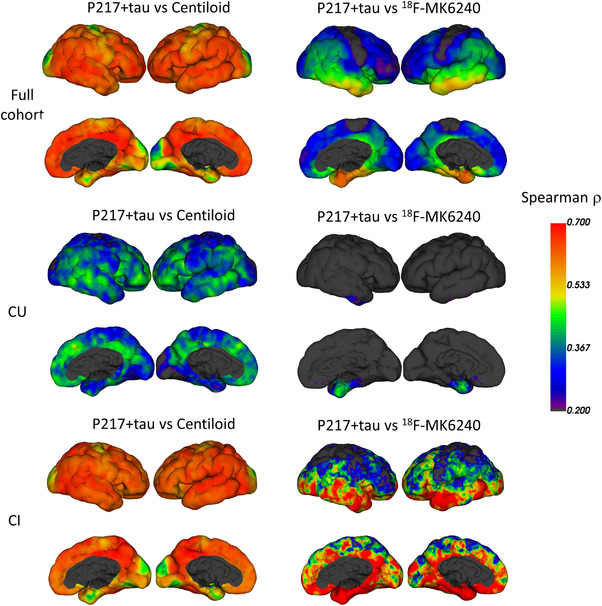
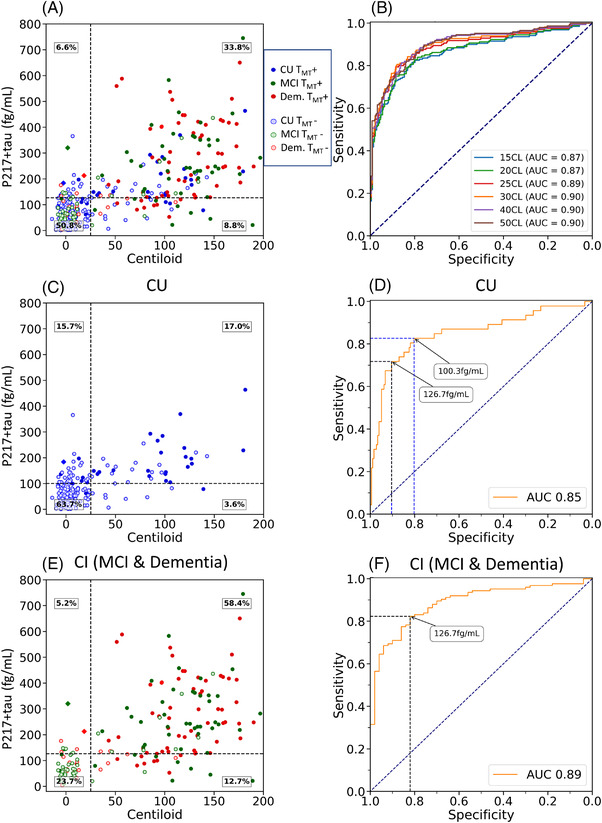
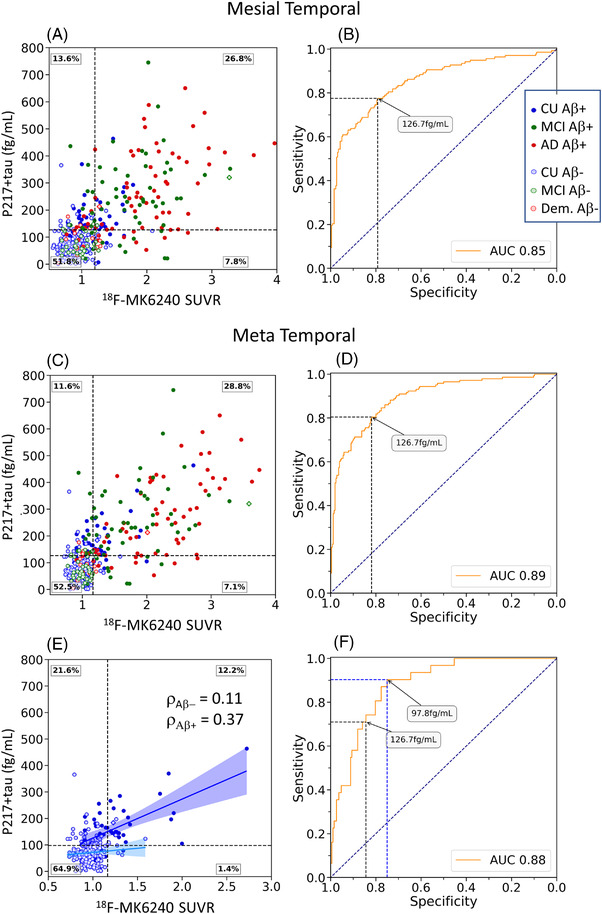
Results: Compared to Aβ- CU, the plasma levels of p217+tau increased 2-fold in Aβ+ CU and 3.5-fold in Aβ+ CI. In Aβ- the p217+tau levels did not differ significantly between CU and CI. P217+tau correlated with Aβ centiloids P = .67 (CI, P = .64; CU, P = .45) and tau SUVRMT P = .63 (CI, P = .69; CU, P = .34). Area under curve (AUC) for Alzheimer's disease (AD) dementia versus Aβ- CU was 0.94, for AD dementia versus other dementia was 0.93, for Aβ+ versus Aβ- PET was 0.89, and for tau+ versus tau- PET was 0.89.

Discussion: Plasma p217+tau levels elevate early in the AD continuum and correlate well with Aβ and tau PET.

Keywords: Alzheimer's disease; Aβ imaging; amyloid imaging; amyloid plaque; blood biomarkers; blood diagnostic for Alzheimer's disease; paired helical filaments; phosphorylated tau; plasma P‐tau217; positron emission tomography; tau imaging.


Conflict of interest statement

Christopher C. Rowe has received research grants from NHMRC, Enigma Australia, Biogen, Eisai, and Abbvie. He is on the scientific advisory board for Cerveau Technologies and consulted for Prothena, Eisai, Roche, and Biogen Australia. Victor Villemagne is and has been a consultant or paid speaker at sponsored conference sessions for Eli Lilly, Life Molecular Imaging, GE Healthcare, Abbvie, Lundbeck, Shanghai Green Valley Pharmaceutical Co Ltd, and Hoffmann La Roche. Ashley Bush is a shareholder in Alterity Ltd, Cogstate Ltd, and Mesoblast Ltd. He is a paid consultant for, and has a profit share interest in, Collaborative Medicinal Development Pty Ltd. He has received lecture fees from Biogen and Merck Sharp & Dohme P/L. Ziad Saad, Gallen Triana‐Baltzer, Randy Slemmon, and Hartmuth Kolb are employees of Janssen R&D. The other authors did not report any conflict of interest.

Figures

FIGURE 1
FIGURE 1
Plasma p217+tau concentrations between (A) clinical classification and amyloid beta (Aβ) PET status and (B) Centiloid (CL) levels of Aβ. The dashed line corresponds to the threshold derived by the Youden index. (C) CL results versus p217+tau level in 25 fg/mL intervals, (D) probability of being Aβ PET positive versus p217+tau level. Vertical lines in (D) are Youden index derived from cognitively unimpaired (CU) (100.3 fg/mL), Youden index derived from total cohort (126.7 fg/mL) and +2.0 SD of the Aβ‐ CU (164 fg/mL). *** P value < 0.0005
FIGURE 2
FIGURE 2
Vertex‐based analysis of regional Spearman correlation between plasma p217+tau and Centiloid (left column) and 18F‐MK6240 SUVR (right column). CU is cognitively unimpaired, CI is cognitively impaired
FIGURE 3
FIGURE 3
Plasma p217+tau versus Centiloid measures of amyloid beta (Aβ). Scatter plot and receiver‐operating characteristic (ROC) curve (A & B), with ROC curves using different CL thresholds to define Aβ+ PET; full cohort (A & B), cognitively unimpaired sub‐cohort (C & D) and cognitively impaired sub‐cohort (E & F). Clinical groups are color‐coded with red for dementia, green for mild cognitive impairment (MCI), and blue for cognitively unimpaired (CU). Solid circles are tau PET positive (TMT+). The black dashed horizontal line corresponds to the p217+tau threshold derived from the Youden index. In (C) and (D) the CU specific threshold is shown. The cognitively impaired (CI) group threshold was the same as the whole cohort threshold. The diamond shapes are the three Aβ−/TMT+ subjects
FIGURE 4
FIGURE 4
Plasma p217+tau versus PET SUVR measures of tau. Scatter plot and ROC curve for mesial temporal regions of interest (ROI) (A & B) and meta temporal ROI (C & D) and in cognitively unimpaired (CU) alone (E & F). Clinical groups are color‐coded with red for dementia, green for mild cognitive impairment (MCI), and blue for CU. Solid circles are Aβ PET positive. The black dashed horizontal line corresponds to the p217+tau threshold derived from the Youden index. Linear correlation and Spearman co‐efficient are shown for the Aβ+ (dark blue) and Aβ− CU (light blue) in part E
FIGURE 5
FIGURE 5
Modeling of 18F‐MK6240 quantification and p217+tau as a function of CL using polynomial curves; (A) normalized by linear transform of p217+tau levels and each tau PET, regions of interest (ROIs), SUVR to a scale of zero to 100 where zero is the mean of the results for each marker in Aβ− CU (<15 CL) and 100 is the mean of the results for each marker from the 30 individuals with the highest values for each marker. (B) Normalized by Z‐score using the results from Aβ to cognitively unimpaired (CU) to define the normal range for p217+tau level and each tau PET, ROI, SUVR. The horizontal line is +2 standard deviations (SD) (A) suggests that plasma p217+tau increases early, similar to amygdala tau at low levels of Aβ, whereas (B) shows that the wide normal range for p217+tau delays reaching a two SD threshold for significance

References

    1. Sevigny J, Suhy J, Chiao P, et al. Amyloid PET screening for enrichment of early‐stage Alzheimer disease clinical trials: experience in a phase 1b clinical trial. Alzheimer Dis Assoc Disord. 2016;30:1–7. - PubMed
    1. Nakamura A, Kaneko N, Villemagne VL, et al. High performance plasma amyloid‐beta biomarkers for Alzheimer's disease. Nature. 2018;554:249–254. - PubMed
    1. Karikari TK, Pascoal TA, Ashton NJ, et al. Blood phosphorylated tau 181 as a biomarker for Alzheimer's disease: a diagnostic performance and prediction modelling study using data from four prospective cohorts. Lancet Neurol. 2020;19:422–433. - PubMed
    1. Thijssen EH, La Joie R, Wolf A, et al. Diagnostic value of plasma phosphorylated tau181 in Alzheimer's disease and frontotemporal lobar degeneration. Nat Med. 2020;26:387–397. - PMC - PubMed
    1. Lantero Rodriguez J, Karikari TK, Suárez‐Calvet M, et al. Plasma p‐tau181 accurately predicts Alzheimer's disease pathology at least 8 years prior to post‐mortem and improves the clinical characterisation of cognitive decline. Acta Neuropathol. 2020;140:267–278. - PMC - PubMed