. 2022 Mar 25;7(13):11023-11032.
doi: 10.1021/acsomega.1c06970. eCollection 2022 Apr 5.

TMT-Based Multiplexed Quantitation of N-Glycopeptides Reveals Glycoproteome Remodeling Induced by Oncogenic Mutations

Affiliations

TMT-Based Multiplexed Quantitation of N-Glycopeptides Reveals Glycoproteome Remodeling Induced by Oncogenic Mutations

Mayank Saraswat et al. ACS Omega. .

Abstract

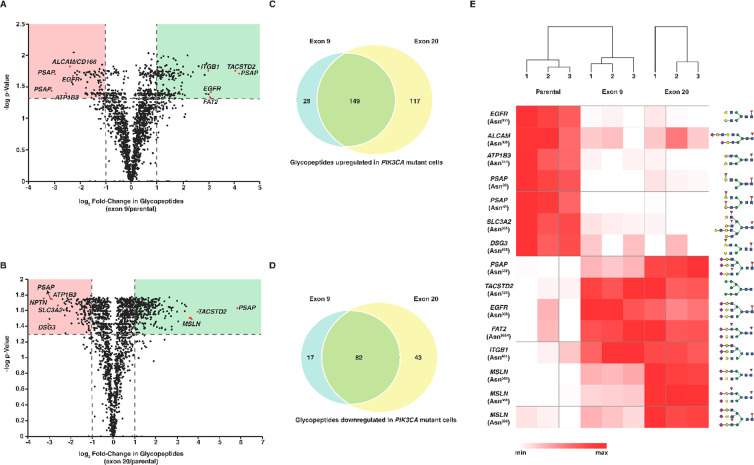
Glycoproteomics, or the simultaneous characterization of glycans and their attached peptides, is increasingly being employed to generate catalogs of glycopeptides on a large scale. Nevertheless, quantitative glycoproteomics remains challenging even though isobaric tagging reagents such as tandem mass tags (TMT) are routinely used for quantitative proteomics. Here, we present a workflow that combines the enrichment or fractionation of TMT-labeled glycopeptides with size-exclusion chromatography (SEC) for an in-depth and quantitative analysis of the glycoproteome. We applied this workflow to study the cellular glycoproteome of an isogenic mammary epithelial cell system that recapitulated oncogenic mutations in the PIK3CA gene, which codes for the phosphatidylinositol-3-kinase catalytic subunit. As compared to the parental cells, cells with mutations in exon 9 (E545K) or exon 20 (H1047R) of the PIK3CA gene exhibited site-specific glycosylation alterations in 464 of the 1999 glycopeptides quantified. Our strategy led to the discovery of site-specific glycosylation changes in PIK3CA mutant cells in several important receptors, including cell adhesion proteins such as integrin β-6 and CD166. This study demonstrates that the SEC-based enrichment of glycopeptides is a simple and robust method with minimal sample processing that can easily be coupled with TMT-labeling for the global quantitation of glycopeptides.


Conflict of interest statement

The authors declare no competing financial interest.

Figures

Figure 1
Figure 1
Experimental workflow. The schematic depicts the strategy for the quantitative analysis of N-glycopeptides using TMT labeling. The individual cell lysates are harvested and subjected to in-solution trypsin digestion, followed by TMT labeling as indicated. The labeled peptides were pooled, and all the peptides from the harvested cell lysates were separated by size-exclusion chromatography (SEC). The data were subject to database searches for identification and quantification using pGlyco 2.0 and MaxQuant software, respectively.
Figure 2
Figure 2
TMT-based quantitation of glycopeptides of transferrin spiked into MCF10A cells in defined ratios. (A) The number of all identified glycopeptides of transferrin at four glycosylation sites are indicated in the bar chart. Four glycosylation sites (Asn432, Asn523, Asn630, and Asn637) are plotted on the x-axis, with the corresponding consensus motif indicated in parentheses. Asn432 and Asn630 had consensus motifs of NXS and NXT, respectively, where X is any amino acid but proline. Asn523 and Asn637 contained the NXC motif, which is relatively rare in mammalian N-glycopeptides. The y-axis shows the number of identified glycopeptides. (B) A scatter plot with the average reporter ion intensity of all glycopeptides from three replicates of spiked-in transferrin from the 1× group (x-axis) and the 2× group (y-axis). A trendline was drawn, and R2 was shown on the plot (0.99). One glycopeptide with discordant values is represented by a red circle. (C) Filtered list of identified glycopeptides of transferrin at the four sites that have unique glycan compositions, where H = hexose, N = N-acetyl hexosamine, F = fucose, and S = N-acetylneuraminic acid.
Figure 3
Figure 3
Cellular glycoproteomics of MCF10A cells and isogenic cells with defined mutations in the PIK3CA gene. (A) All identified and quantified glycopeptides were classified according to glycan classes, with the left bar showing the distribution of complex, hybrid, high mannose, and truncated glycans. Glycans were manually drawn for each glycopeptide from their glycan compositions, and broad categories of complex type, hybrid, and high mannose were assigned. Glycan compositions containing either only the N-glycan core or fewer monosaccharides than a core were marked as truncated. To draw the right side of the bar chart, the total number of glycan compositions was considered as a 100% distribution of each composition within each categories. (B) The presence or absence of fucose or N-acetyl neuraminic acid was manually evaluated for each glycopeptide, and their distribution within each glycan category is shown. (C) Fold changes of the identified individual glycopeptides (exon 9/parental and exon 20/parental) were converted to log2 values and plotted against each other in a scatter plot. The R2 value is shown. (D) Only the significantly different glycopeptides were plotted as in panel C. (E) Principal component analysis of all identified glycopeptides was performed using Metaboanalyst 4.0. The three groups of cells are indicated in blue (MCF10A), green (exon 9), or red (exon 20). (F and G) The top 20 glycopeptides that were significantly different between the groups were used to make mirror plots. The left side of the central line shows the exon 9/parental log2 fold change, and the right side of the central line shows the exon 20/parental log2 fold change. The gene symbol, glycosylation site, and manually drawn order of attachment of the glycans are indicated in the plots. Panel F contains the 20 most upregulated glycopeptides in both exon 9/parental and exon 20/parental comparisons, while panel G contains the 20 most downregulated glycopeptides.
Figure 4
Figure 4
Glycoproteome remodeling in PIK3CA mutants. Volcano plot showing the fold change (log2 values) in the abundance of glycopeptides in (A) exon 9/parental or (B) exon 20/parental against p-values (−log) as indicated. The horizontal dashed line indicates p-values <0.05, and vertical lines indicate a fold-change cutoff of 2 either upregulated (green quadrant) or downregulated (red quadrant) in either comparison. Every red circle indicates a unique glycopeptide that was significantly different between exon 9 and parental cells or exon 20 and parental cells. All red circles are marked with the gene symbol of the glycoprotein from which the glycopeptide was derived. The glycopeptides that were (C) upregulated and (D) downregulated in the exon 9/parental comparison and the exon 20/parental comparison were compared with Venn diagrams. Glycopeptides common to both panel C and panel D were used to extract their abundance for the 15 most-changing glycopeptides, and a heatmap for the triplicate experiment was generated (E) The hierarchical clustering dendrogram is shown at the top. Gene symbols, glycosylation sites, and manually drawn order of attachment of glycans at the sites are depicted. The color gradient from high expression (max, red) to low expression (min, white) is indicated at the bottom of the heatmap.
Figure 5
Figure 5
Ultraviolet absorbance chromatogram of size-exclusion chromatography and representative MS/MS spectra of glycopeptides. (A) Chromatogram showing UV absorbance at the 214 nm wavelength. The y-axis represents the absorbance in milli-absorbance units, and the x-axis represents the time in minutes. Dashed lines depict the individual fractions that were collected and separately analyzed by LC-MS/MS. (B) Asn162 of sortilin contains a fucosylated sialylated complex-type glycan, and the fragmentation pattern of this glycopeptide in stepped HCD is shown. Asn158 of NPC intracellular cholesterol transporter 1 contains a sialylated complex-type glycan that was identified as both (C) fucosylated and (D) fucosylated species. The low mass region shows abundant glycan oxonium ions, which are marked according to the glycan units or monosaccharides that produce them; Hex = hexose, HexNAc = N-acetyl hexosamine, Neu5Ac = N-acetylneuraminic acid, and Fuc = fucose. b- and y-ions are fragmented peptide backbone ions, and Y represents ions that contain an intact peptide backbone attached to glycan fragments.

References

    1. Helenius A.; Aebi M. Intracellular functions of N-linked glycans. Science 2001, 291 (5512), 2364–9. 10.1126/science.291.5512.2364. - DOI - PubMed
    1. Peixoto A.; Relvas-Santos M.; Azevedo R.; Santos L. L.; Ferreira J. A. Protein Glycosylation and Tumor Microenvironment Alterations Driving Cancer Hallmarks. Front Oncol 2019, 9, 380.10.3389/fonc.2019.00380. - DOI - PMC - PubMed
    1. Carvalho S.; Catarino T. A.; Dias A. M.; Kato M.; Almeida A.; Hessling B.; Figueiredo J.; Gartner F.; Sanches J. M.; Ruppert T.; Miyoshi E.; Pierce M.; Carneiro F.; Kolarich D.; Seruca R.; Yamaguchi Y.; Taniguchi N.; Reis C. A.; Pinho S. S. Preventing E-cadherin aberrant N-glycosylation at Asn-554 improves its critical function in gastric cancer. Oncogene 2016, 35 (13), 1619–31. 10.1038/onc.2015.225. - DOI - PMC - PubMed
    1. Ng B. G.; Freeze H. H. Perspectives on Glycosylation and Its Congenital Disorders. Trends Genet 2018, 34 (6), 466–476. 10.1016/j.tig.2018.03.002. - DOI - PMC - PubMed
    1. Chui D.; Sellakumar G.; Green R.; Sutton-Smith M.; McQuistan T.; Marek K.; Morris H.; Dell A.; Marth J. Genetic remodeling of protein glycosylation in vivo induces autoimmune disease. Proc. Natl. Acad. Sci. U. S. A. 2001, 98 (3), 1142–7. 10.1073/pnas.98.3.1142. - DOI - PMC - PubMed