. 2022 Feb 7;4(2):fcac013.
doi: 10.1093/braincomms/fcac013. eCollection 2022.

Longitudinal atrophy in prodromal dementia with Lewy bodies points to cholinergic degeneration

Affiliations

Longitudinal atrophy in prodromal dementia with Lewy bodies points to cholinergic degeneration

Kejal Kantarci et al. Brain Commun. .

Abstract

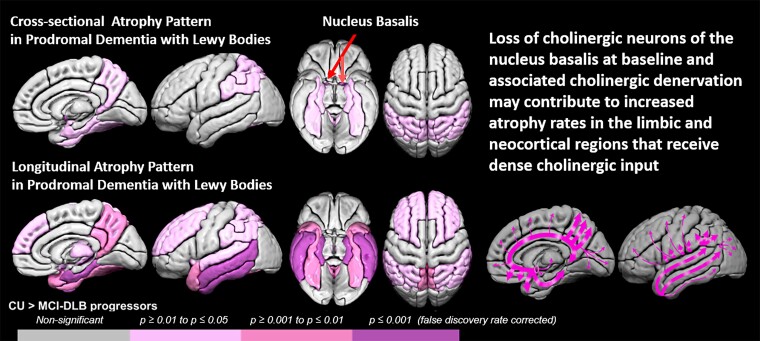
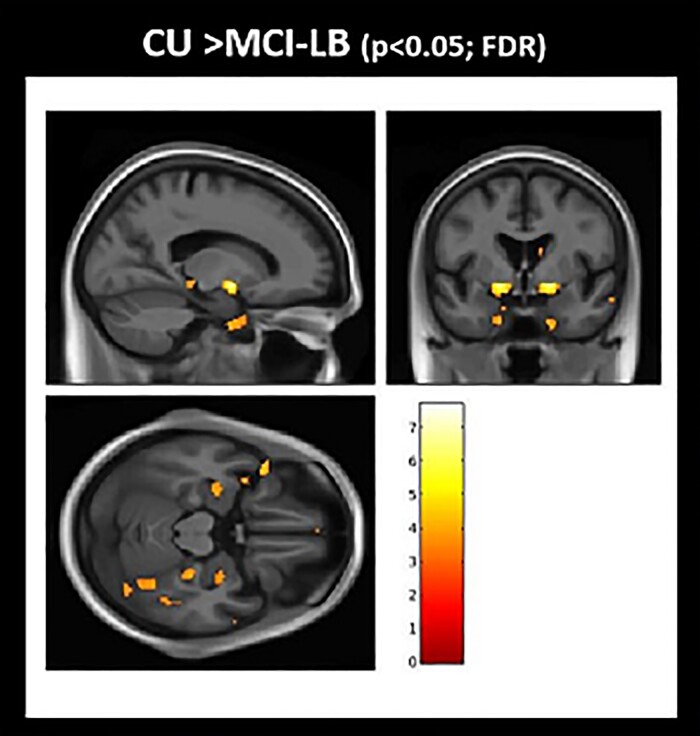
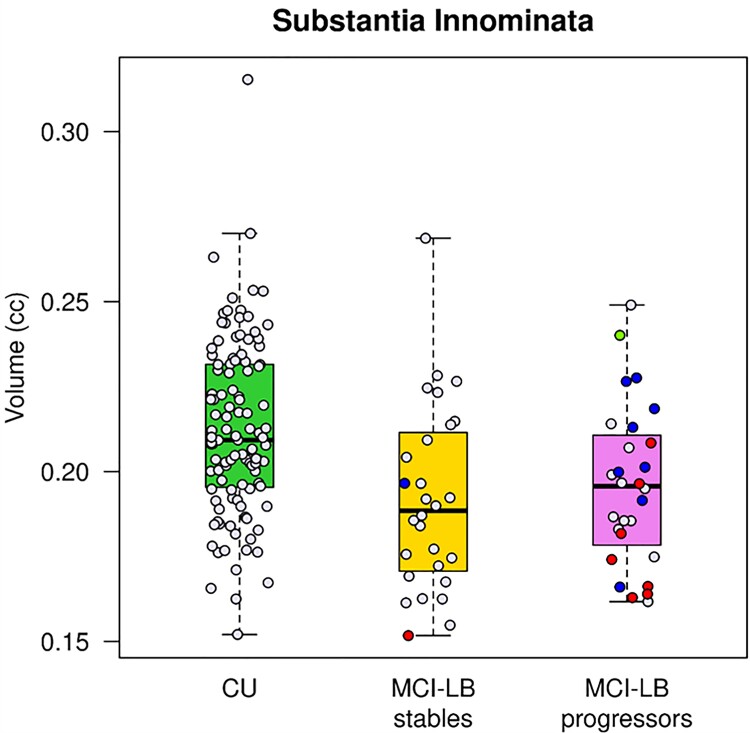
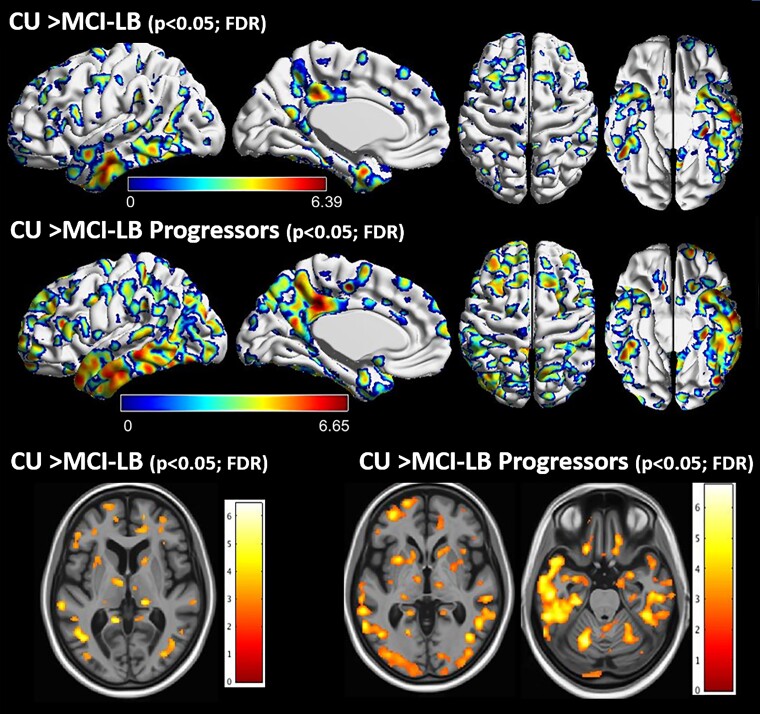
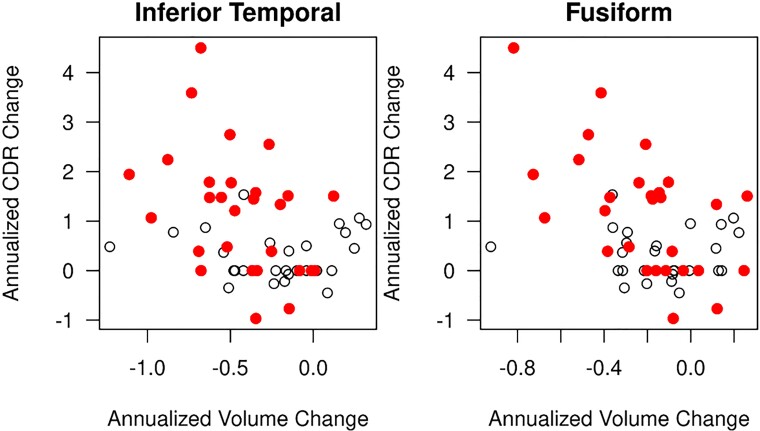
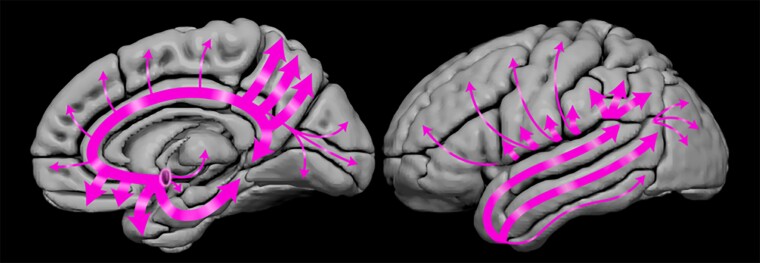
Mild cognitive impairment with the core clinical features of dementia with Lewy bodies is recognized as a prodromal stage of dementia with Lewy bodies. Although grey matter atrophy has been demonstrated in prodromal dementia with Lewy bodies, longitudinal rates of atrophy during progression to probable dementia with Lewy bodies are unknown. We investigated the regional patterns of cross-sectional and longitudinal rates of grey matter atrophy in prodromal dementia with Lewy bodies, including those who progressed to probable dementia with Lewy bodies. Patients with mild cognitive impairment with at least one core clinical feature of dementia with Lewy bodies (mean age = 70.5; 95% male), who were enrolled in the Mayo Clinic Alzheimer's Disease Research Center and followed for at least two clinical evaluations and MRI examinations, were included (n = 56). A cognitively unimpaired control group (n = 112) was matched 2:1 to the patients with mild cognitive impairment by age and sex. Patients either remained stable (n = 28) or progressed to probable dementia with Lewy bodies (n = 28) during a similar follow-up period and pathologic confirmation was available in a subset of cases (n = 18). Cross-sectional and longitudinal rates of grey matter atrophy were assessed using voxel-based and atlas-based region of interest analyses. At baseline, prodromal dementia with Lewy bodies was characterized by atrophy in the nucleus basalis of Meynert both in those who remained stable and those who progressed to probable dementia with Lewy bodies (P < 0.05 false discovery rate corrected). Increase in longitudinal grey matter atrophy rates were widespread, with greatest rates of atrophy observed in the enthorhinal and parahippocampal cortices, temporoparietal association cortices, thalamus and the basal ganglia, in mild cognitive impairment patients who progressed to probable dementia with Lewy bodies at follow-up (P < 0.05 false discovery rate corrected). Rates of inferior temporal atrophy were associated with greater rates of worsening on the clinical dementia rating-sum of boxes. Seventeen of the 18 (94%) autopsied cases had Lewy body disease. Results show that atrophy in the nucleus basalis of Meynert is a feature of prodromal dementia with Lewy bodies regardless of proximity to progression to probable dementia with Lewy bodies. Longitudinally, grey matter atrophy progresses in regions with significant cholinergic innervation, in alignment with clinical disease progression, with widespread and accelerated rates of atrophy in patients who progress to probable dementia with Lewy bodies. Given the prominent neurodegeneration in the cholinergic system, patients with prodromal dementia with Lewy bodies may be candidates for cholinesterase inhibitor treatment.

Keywords: MRI; atrophy; dementia with Lewy bodies; mild cognitive impairment; prodromal DLB.


Figures

Graphical abstract
Graphical abstract
Figure 1
Figure 1
Grey matter atrophy in MCI-LB at baseline: voxel-based analysis. Voxel-based analysis show differences in grey matter atrophy in MCI-LB compared to CU projected to the 3D brain surface. Greater atrophy in the basal forebrain, inferior temporal and amygdala regions are seen in MCI-LB compared with the CU group (FDR; P < 0.05). T-score bar indicate magnitude of the differences.
Figure 2
Figure 2
Substantia innominata volumes. Box plots show that MCI-LB stables (FDR corrected P =  0.007) and MCI-LB progressors (FDR corrected P =  0.028) had smaller substantia innominata volumes compared to CU. The pathologically confirmed cases were colour coded based on the pathologic diagnosis after a median (range) of 5.3 (2.4–10.6) years. Blue labels represent cases with intermediate or high likelihood DLB (according to the fourth report of the DLB Consortium Criteria) who had low Alzheimer’s disease pathology (according to the NIA-AA criteria) classified as Lewy body disease. Red labels represent cases with intermediate or high likelihood DLB and intermediate or high Alzheimer’s disease, classified as having mixed Lewy body disease–Alzheimer’s disease pathology. The single green label represents a case with high Alzheimer’s disease and no Lewy body disease pathology classified as Alzheimer’s disease.
Figure 3
Figure 3
Regional pattern of group differences in longitudinal rates of cortical atrophy: voxel-based analysis. Voxel-based analyses show differences in the annualized rates of grey matter atrophy in MCI-LB compared to CU projected to the 3D brain surface. Greater rates of atrophy in the lateral and inferior temporal cortices and temporal pole, as well as medial and lateral parietal cortices is observed in MCI-LB compared with CU in the upper row, and in MCI-LB progressors compared with CU in the middle row (FDR; P < 0.05). Individual sections demonstrating differences in longitudinal rates of atrophy in the thalamus, amygdala and insula is shown in the bottom row. The blue colours around the FDR corrected P < 0.05 clusters are due to interpolation of edge voxels. T-score bars indicate magnitude of the differences.
Figure 4
Figure 4
Longitudinal decline in inferior temporal and fusiform gyrus grey matter correlates with clinical disease progression in MCI-LB. In MCI-LB, longitudinal increase in CDR–SOB correlated with longitudinal rates of volume loss in the inferior temporal (r = −0.35; P =  0.011) and fusiform (r = −0.44; P < 0.001) cortices after adjusting for age at baseline. The open circles represent MCI-LB stables and the red circles represent MCI-LB progressors.
Figure 5
Figure 5
Cholinergic projections from the nucleus basalis of Meynert. Schematic showing the projections from nucleus basalis of Meynert to the cortex, amygdala, thalamus and caudate. Thicker arrows suggest more dense projections from this cholinergic nucleus to limbic and temporoparietal association cortices and the amygdala where the greatest rates of atrophy were observed in MCI-LB compared with CU.

References

    1. McKeith IG, Ferman TJ, Thomas AJ, et al. . Research criteria for the diagnosis of prodromal dementia with Lewy bodies. Neurology. 2020;94:743–755. - PMC - PubMed
    1. Ferman TJ, Smith GE, Kantarci K, et al. . Nonamnestic mild cognitive impairment progresses to dementia with Lewy bodies. Neurology. 2013;81:2032–2038. - PMC - PubMed
    1. Kantarci K, Lesnick T, Ferman TJ, et al. . Hippocampal volumes predict risk of dementia with Lewy bodies in mild cognitive impairment. Neurology. 2016;87:2317–2323. - PMC - PubMed
    1. Durcan R, Donaghy P, Osborne C, Taylor JP, Thomas AJ. Imaging in prodromal dementia with Lewy bodies: Where do we stand? Int J Geriatr Psychiatry. 2019;34:635–646. - PubMed
    1. Blanc F, Colloby SJ, Philippi N, et al. . Cortical thickness in dementia with Lewy bodies and Alzheimer’s disease: A comparison of prodromal and dementia stages. PLoS One. 2015;10:e0127396. - PMC - PubMed

LinkOut - more resources