. 2022 Sep 1;24(9):1494-1508.
doi: 10.1093/neuonc/noac085.

Glioblastoma scRNA-seq shows treatment-induced, immune-dependent increase in mesenchymal cancer cells and structural variants in distal neural stem cells

Affiliations

Glioblastoma scRNA-seq shows treatment-induced, immune-dependent increase in mesenchymal cancer cells and structural variants in distal neural stem cells

Charles P Couturier et al. Neuro Oncol. .

Abstract

Background: Glioblastoma is a treatment-resistant brain cancer. Its hierarchical cellular nature and its tumor microenvironment (TME) before, during, and after treatments remain unresolved.

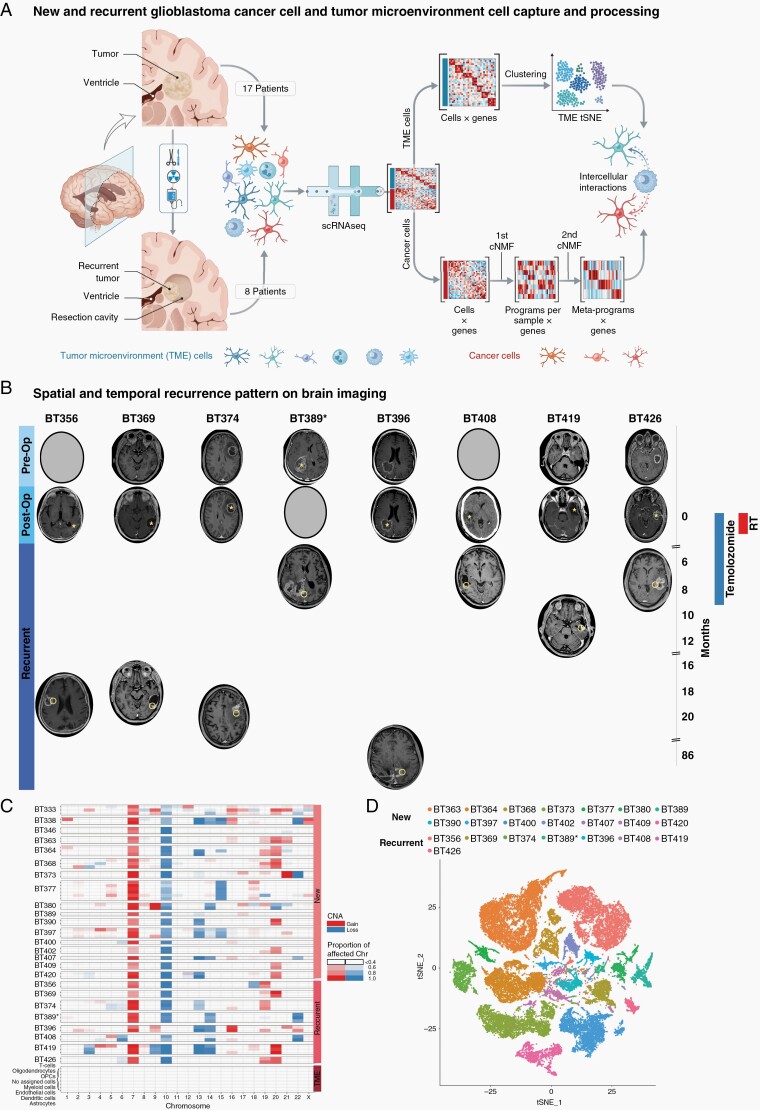
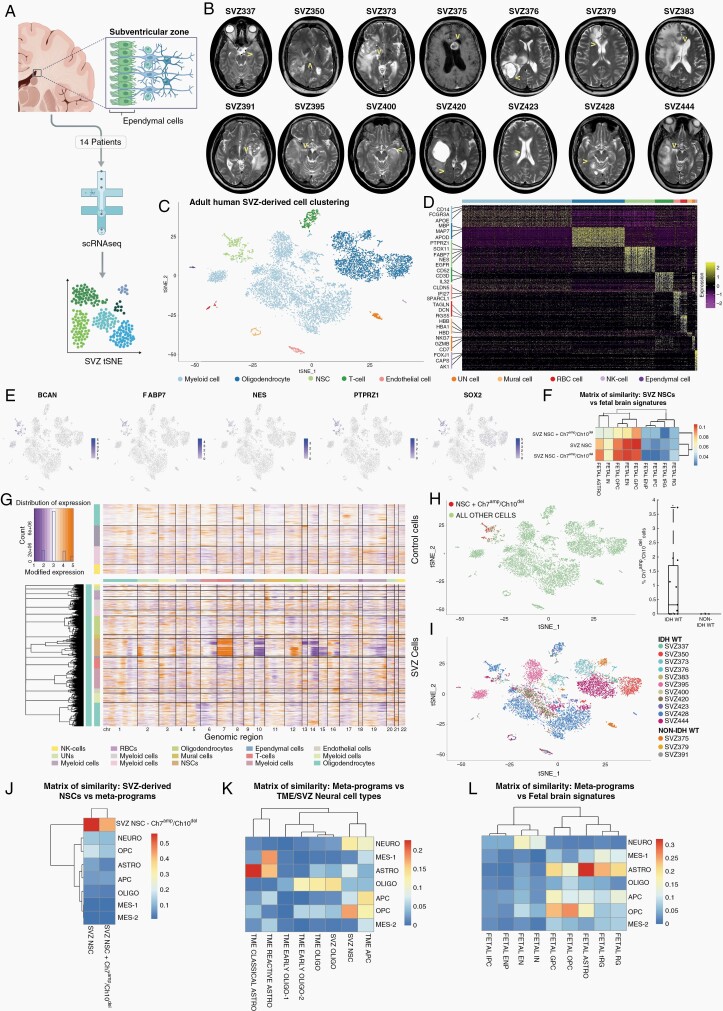
Methods: Here, we used single-cell RNA sequencing to analyze new and recurrent glioblastoma and the nearby subventricular zone (SVZ).

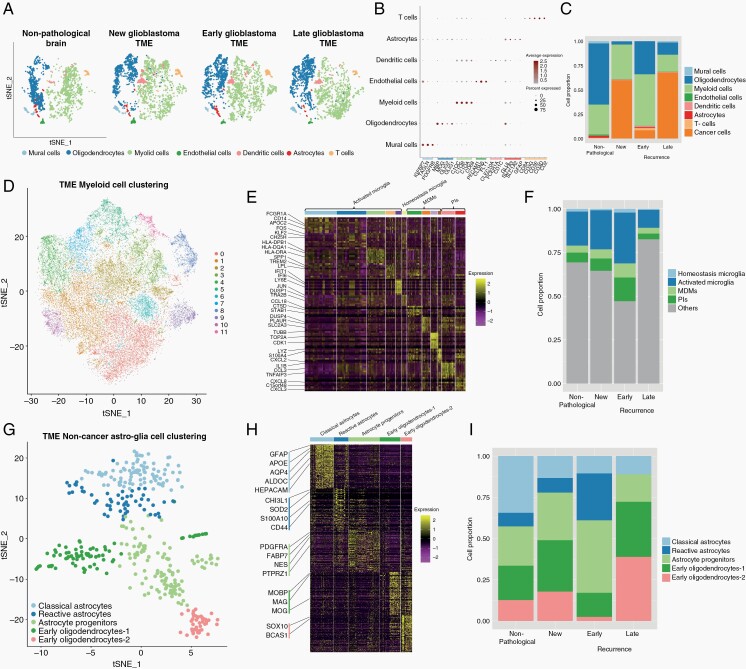
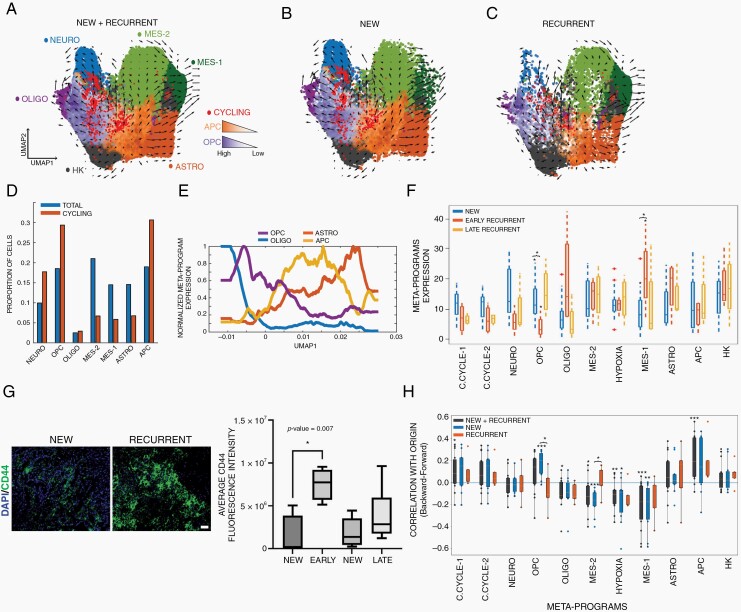
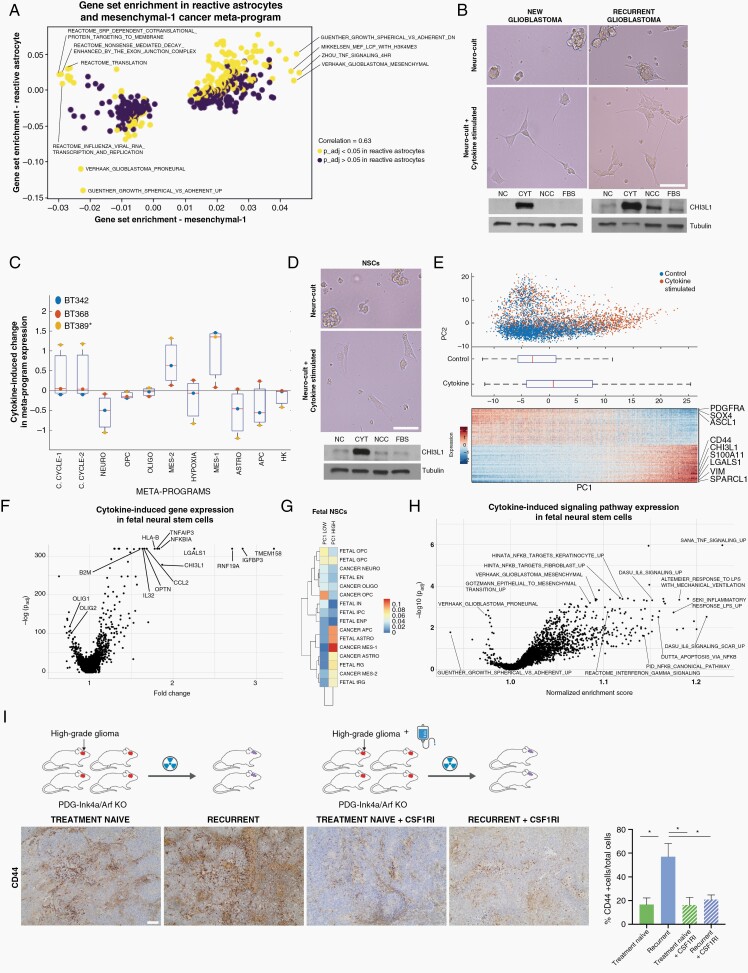
Results: We found 4 glioblastoma neural lineages are present in new and recurrent glioblastoma with an enrichment of the cancer mesenchymal lineage, immune cells, and reactive astrocytes in early recurrences. Cancer lineages were hierarchically organized around cycling oligodendrocytic and astrocytic progenitors that are transcriptomically similar but distinct to SVZ neural stem cells (NSCs). Furthermore, NSCs from the SVZ of patients with glioblastoma harbored glioblastoma chromosomal anomalies. Lastly, mesenchymal cancer cells and TME reactive astrocytes shared similar gene signatures which were induced by radiotherapy in a myeloid-dependent fashion in vivo.

Conclusion: These data reveal the dynamic, immune-dependent nature of glioblastoma's response to treatments and identify distant NSCs as likely cells of origin.

Keywords: glioblastoma; neural stem cells; recurrent; scRNAseq; subventricular zone.


Figures

Fig. 1
Fig. 1
Glioblastoma cell atlas before, during, and after treatments. (A) Workflow for new and recurrent glioblastoma processing and analysis. (B) First presentation, postoperative, and at recurrence brain imaging, treatment timeline, and progression-free survival for patients with recurrent glioblastoma. Asterisks mark the original tumor site. Circles mark the recurrent tumor site. Patients either recurred during or shortly after adjuvant treatment (less than 12 months from surgery) or later (more than 18 months from surgery). (C) Copy-number anomalies for all patients separate glioblastoma cancer cells and non-cancer cells. Cancer cells contain characteristic anomalies in chromosome 7 and/or 10 in all patients. Non-cancer cells do not contain chromosome-wide anomalies. (D) tSNE visualization of all cancer cells from glioblastoma samples. Cells are colored according to the sample. Abbreviations: cNMF, clustered non-negative matrix factorization; post-op, postoperative; pre-op, preoperative; TME, tumor microenvironment; tSNE, t-distributed stochastic neighbor embedding.
Fig. 2
Fig. 2
The proportions of non-cancer cell types in new and recurrent glioblastoma shift with treatments and time. (A) tSNE of non-cancer cells from all samples. Cells are colored according to cell types and grouped by sample type: non-pathological, new glioblastoma, early recurrent glioblastoma, and late recurrent glioblastoma. (B) Marker gene expression for non-cancer cell types. (C) Bar graph showing the proportion of all cell types in samples from non-pathological brain, new glioblastoma, and early and late recurrent glioblastoma. (D) tSNE of myeloid cells from all samples. Cells are colored according to the clustering analysis results. (E) Heatmap of gene expression for myeloid cell clusters. Clusters are arranged in 4 main groups: activated microglia, homeostatic microglia, MDMs, and pro-inflammatory macrophages (see also Supplementary Figure 1C). (F) Bar graph showing the proportion of myeloid cells types in samples from non-pathological brain, new glioblastoma, and early and late recurrent glioblastoma. (G) tSNE of non-cancer astroglia from all samples. Cells are colored according to their cluster or cell type. (H) Gene expression heatmap for all non-cancer astroglia from all samples arranged by cluster/cell type. (I) Bar graph showing the proportion of non-cancer astroglia cells per subcluster in samples from non-pathological brain, new glioblastoma, and early and late recurrent glioblastoma. Abbreviations: MDM, monocyte-derived macrophage; PIs, pro-inflammatory macrophages; TME, tumor microenvironment; tSNE, t-distributed stochastic neighbor embedding.
Fig. 3
Fig. 3
Hierarchical organization of meta-programs uncovers meta-program dynamics in new and recurrent glioblastoma and a bi-progenitor origin. Meta-program UMAP embedding of cancer cells from all (A), new (B), and recurrent (C) patients. Arrows indicate the sample-wise mean RNA velocity of cells within the voxel. Cells are colored according to their highest meta-program score. Cells with a high combined cell cycle meta-program score (>100) are labeled bright red. (D) Bar graph showing the proportion of total and cycling cells expressing a meta-program as the dominant meta-program. The OPC, APC, and the neuronal meta-program are enriched in cycling cells, while others are stable or decreased. (E) Gaussian-filtered expression of the astrocytic, APC, OPC, and oligodendrocytic meta-programs in cells according to their position along UMAP1. (F) Average expression of meta-programs by sample, stratified according to new, early recurrent, and late recurrent glioblastoma. *<0.05. (G) Representative CD44 expression in a paired patient with new and recurrent glioblastoma (scale bar = 50 µm). The boxplots represent the absolute change in the percentage of CD44-positive cells (%CD44+) from new to recurrent tumors in 21 paired new and recurrent patients stratified by recurrence time (early: <12 months; late: >12 months). These boxplots show the first quartile, median, and third quartile with whiskers corresponding to 1.5 times the interquartile range. Most patients with an early recurrence showed an increase in average CD44 fluorescence intensity (P = .007). Two-sample Student’s t test was used. (H) Patient-wise correlation of the velocity origin score to the meta-programs, stratified by new and recurrent samples. The origin score corresponds to the frequency at which a cell is the endpoint of a backward Markov process minus the frequency of being the endpoint of a forward Markov process. A positive correlation indicates cells expressing a meta-program tend toward the origin of the velocity field, while a negative correlation indicates these cells tend toward the terminus. P-values: *<.01; **<.001; ***<.0005. Abbreviations: APC, astrocyte progenitor cell; c.cycle, cell cycle; GSC, glioma stem cell; HK, housekeeping; mes, mesenchymal; neuro, neuronal; oligo, oligodendrocyte; OPC, oligodendrocyte progenitor cell.
Fig. 4
Fig. 4
Single-cell analysis of the adult human subventricular zone. (A) Schematic showing the workflow and analysis of the SVZ cells. (B) Magnetic resonance imaging of each SVZ of the patient demonstrating the regions of signal abnormality and the distant site (arrowheads) where the sample was derived. (C) tSNE of SVZ cells from all patients colored by cell type. (D) Heatmap of gene expression by cell type. (E) tSNE with cells colored according to the expression of selected progenitor genes. (F) Matrix of similarity between NSC signatures and the fetal signature. (G) CNA heatmap of SVZ cells. (H) tSNE and box plot of SVZ cells from all patients with cells harboring chromosome 7 amplification and chromosome 10 deletions identified. tSNE: CNA-harboring cells are red. Boxplot shows the percentage of CNA-harboring cells per sample, stratified by sample type. Only samples from patients with IDHwt glioblastoma contain CNA-harboring cells. P-value: *<.05, one-sample Student’s t test. (I) tSNE of SVZ with cells labeled according to patient. (J) Matrix of similarity between NSC signatures and cancer meta-programs. (K) Matrix of similarity between cancer meta-programs and TME/SVZ neural cell type signatures. (L) Matrix of similarity between cancer meta-programs and fetal signatures in (F). Abbreviations: APC, astrocytic progenitor cell; Astro, astrocytic; CAN, copy number alteration; EN, excitatory neuron; ENP, excitatory neuronal progenitor; GPC, glial progenitor cell; IN, interneuron; IPC, inhibitory neuronal progenitor cell; Mes, mesenchymal; Neuro, neuronal; NSC, neural stem cell; Oligo, oligodendrocytic; OPC, oligodendrocyte progenitor cell; RG, radial glia; SVZ, subventricular zone; TME, tumor microenvironment; tRG, truncated radial glia; tSNE, t-distributed stochastic neighbor embedding.
Fig. 5
Fig. 5
Immune signals and radiotherapy upregulate a mesenchymal-like program in fetal and cancer stem cells. (A) Volcano plot of the GSEA of reactive astrocytes and the mesenchymal cancer meta-program. (B) Representative images of GSC neurospheres following 5 days of culture in control and cytokine-stimulated conditions. Bottom panels show CHI3L1 protein expression in GSCs following 5 days of culture in neuro-cult (NC), cytokine-stimulated (CYT), neuro-cult complete (NCC), and fetal bovine serum media (FBS). (C) Single-cell RNA-seq of the cells in (A) was scored by meta-program and averaged by the patient. The y-axis indicates enrichment of a signature from new to recurrence (ie, a positive enrichment corresponds to a higher average expression of the meta-program in the cytokine-stimulated condition). (D) Representative images of human fetal NSC neurospheres following 1 day of culture control and cytokine-stimulated conditions. Bottom panels show CHI3L1 protein expression in fetal NSCs following 1 day of culture in NC, CYT, NCC, and FBS media. (E) Single-cell RNA-seq of the cells in (D) was analyzed by PCA. Top panel: cells are colored according to their culture condition. Middle panel: boxplot of the position of the cells along PC1. Bottom panel: gene expression heatmap of the genes with high and low PC1 loadings; the x-axis corresponds to all cells sorted from low to high PC1 position. (F) Volcano plot of the differential expression analysis of the cells in (E), cytokine-stimulated vs control. (G) Comparison of the high and low PC1 genes in (E) to the cancer meta-programs and fetal signatures in Couturier et al. The signature formed by PC1 high genes has a high similarity to the mesenchymal-1 meta-program. (H) Volcano plot of the GSEA performed from the differential expression analysis performed in (F). (I) Representative CD44 expression in treatment-naïve and recurrent PDG-Ink4a/Arf−/− mouse glioma model. Images are shown for a vehicle-treated new tumor, a recurrent tumor emerging post-10 Gy radiation therapy (RT) fractionated in 5 doses, a tumor from a mouse treated with the CSF1R inhibitor BLZ945 as a monotherapy (12d), and a recurrent tumor from a mouse treated with RT in combination with BLZ945 (RT + BLZ945 12d). Boxplot plot shows the percentage of CD44-positive cells in each condition: treatment-naïve 3 mice; recurrent tumor following RT = 3 mice; treatment-naïve plus BLZ945 = 2 mice; recurrent tumor following RT plus BLZ945 = 3 mice. Scale bar = 50 µm. Abbreviations: GSC, glioma stem cell; GSEA, gene set enrichment analysis; NSC, neural stem cell; PCA, principal component analysis.

References

    1. Louis DN, Perry A, Reifenberger G, et al. . The 2016 World Health Organization Classification of Tumors of the Central Nervous System: a summary. Acta Neuropathol (Berl). 2016;131(6):803–820. - PubMed
    1. Stupp R, Mason WP, van den Bent MJ, et al. . Radiotherapy plus concomitant and adjuvant temozolomide for glioblastoma. N Engl J Med. 2005;352(10):987–996. - PubMed
    1. Couturier CP, Ayyadhury S, Le PU, et al. . Single-cell RNA-seq reveals that glioblastoma recapitulates a normal neurodevelopmental hierarchy. Nat Commun. 2020;11(1):1–19. - PMC - PubMed
    1. Klemm F, Maas RR, Bowman RL, et al. . Interrogation of the microenvironmental landscape in brain tumors reveals disease-specific alterations of immune cells. Cell. 2020;181(7):1643–1660.e17. - PMC - PubMed
    1. Patel AP, Tirosh I, Trombetta JJ, et al. . Single-cell RNA-seq highlights intratumoral heterogeneity in primary glioblastoma. Science. 2014;344(6190):1396–1401. - PMC - PubMed

Publication types