

A brain atlas of axonal and synaptic delays based on modelling of cortico-cortical evoked potentials
- PMID: 35416942
- PMCID: PMC9166555
- DOI: 10.1093/brain/awab362
A brain atlas of axonal and synaptic delays based on modelling of cortico-cortical evoked potentials
Abstract
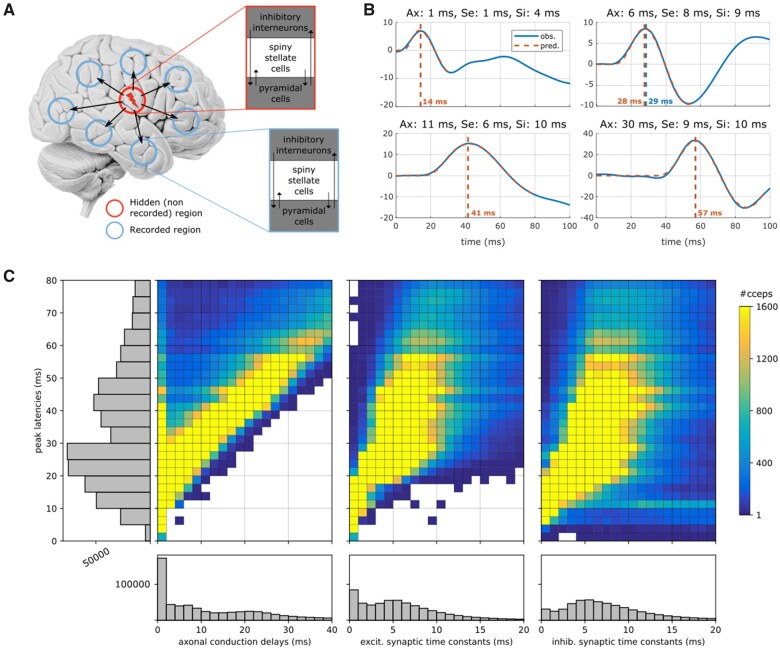
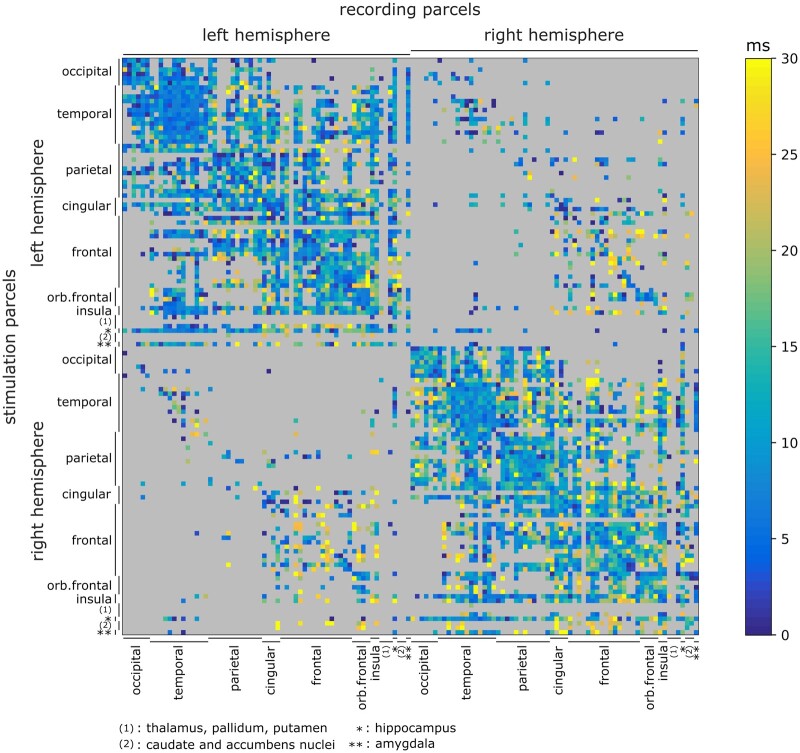
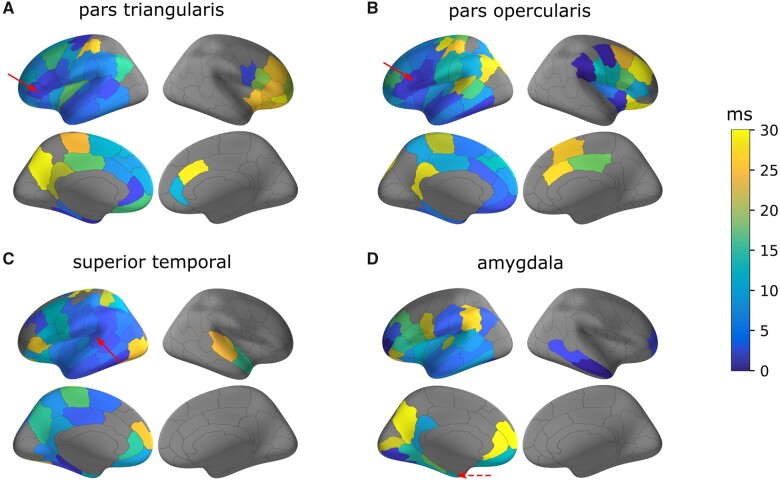
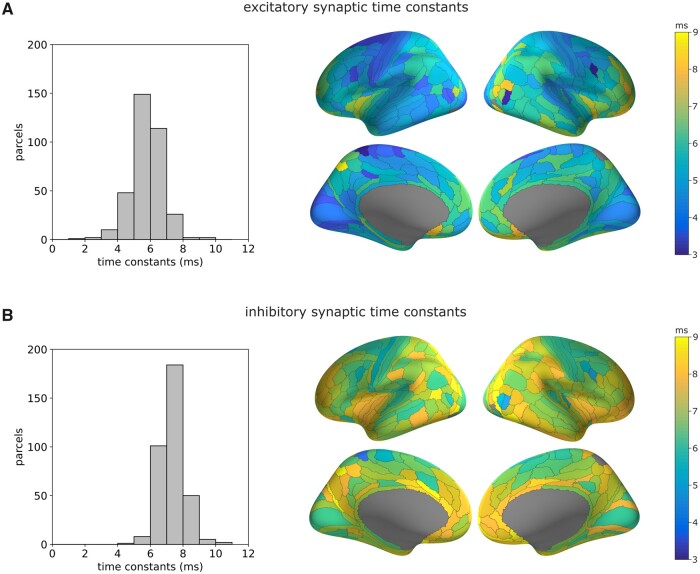
Epilepsy presurgical investigation may include focal intracortical single-pulse electrical stimulations with depth electrodes, which induce cortico-cortical evoked potentials at distant sites because of white matter connectivity. Cortico-cortical evoked potentials provide a unique window on functional brain networks because they contain sufficient information to infer dynamical properties of large-scale brain connectivity, such as preferred directionality and propagation latencies. Here, we developed a biologically informed modelling approach to estimate the neural physiological parameters of brain functional networks from the cortico-cortical evoked potentials recorded in a large multicentric database. Specifically, we considered each cortico-cortical evoked potential as the output of a transient stimulus entering the stimulated region, which directly propagated to the recording region. Both regions were modelled as coupled neural mass models, the parameters of which were estimated from the first cortico-cortical evoked potential component, occurring before 80 ms, using dynamic causal modelling and Bayesian model inversion. This methodology was applied to the data of 780 patients with epilepsy from the F-TRACT database, providing a total of 34 354 bipolar stimulations and 774 445 cortico-cortical evoked potentials. The cortical mapping of the local excitatory and inhibitory synaptic time constants and of the axonal conduction delays between cortical regions was obtained at the population level using anatomy-based averaging procedures, based on the Lausanne2008 and the HCP-MMP1 parcellation schemes, containing 130 and 360 parcels, respectively. To rule out brain maturation effects, a separate analysis was performed for older (>15 years) and younger patients (<15 years). In the group of older subjects, we found that the cortico-cortical axonal conduction delays between parcels were globally short (median = 10.2 ms) and only 16% were larger than 20 ms. This was associated to a median velocity of 3.9 m/s. Although a general lengthening of these delays with the distance between the stimulating and recording contacts was observed across the cortex, some regions were less affected by this rule, such as the insula for which almost all efferent and afferent connections were faster than 10 ms. Synaptic time constants were found to be shorter in the sensorimotor, medial occipital and latero-temporal regions, than in other cortical areas. Finally, we found that axonal conduction delays were significantly larger in the group of subjects younger than 15 years, which corroborates that brain maturation increases the speed of brain dynamics. To our knowledge, this study is the first to provide a local estimation of axonal conduction delays and synaptic time constants across the whole human cortex in vivo, based on intracerebral electrophysiological recordings.
Keywords: axonal conduction delay; cortico-cortical evoked potential; dynamic causal modelling; neural mass models; synaptic time constant.
© The Author(s) (2021). Published by Oxford University Press on behalf of the Guarantors of Brain.
Figures


References
-
- Koch C, Rapp M, Segev I.. A brief history of time (constants). Cereb Cortex. 1996;6(2):93–101. - PubMed
-
- Swadlow HA, Waxman SG.. Axonal conduction delays. Scholarpedia. 2012;7(6):1451.
-
- Brunel N. Dynamics of sparsely connected networks of excitatory and inhibitory spiking neurons. J Comput Neurosci 2000;8:183–208. - PubMed
-
- Jirsa VK. Neural field dynamics with local and global connectivity and time delay. Philos Trans R Soc Math Phys Eng Sci. 2009;367(1891):1131–1143. - PubMed
Publication types
MeSH terms
LinkOut - more resources
Full Text Sources
Medical
Miscellaneous
