. 2022 May 2;154(5):e202112865.
doi: 10.1085/jgp.202112865. Epub 2022 Apr 13.

X-ray irradiation triggers immune response in human T-lymphocytes via store-operated Ca2+ entry and NFAT activation

Affiliations

X-ray irradiation triggers immune response in human T-lymphocytes via store-operated Ca2+ entry and NFAT activation

Dominique Tandl et al. J Gen Physiol. .

Abstract

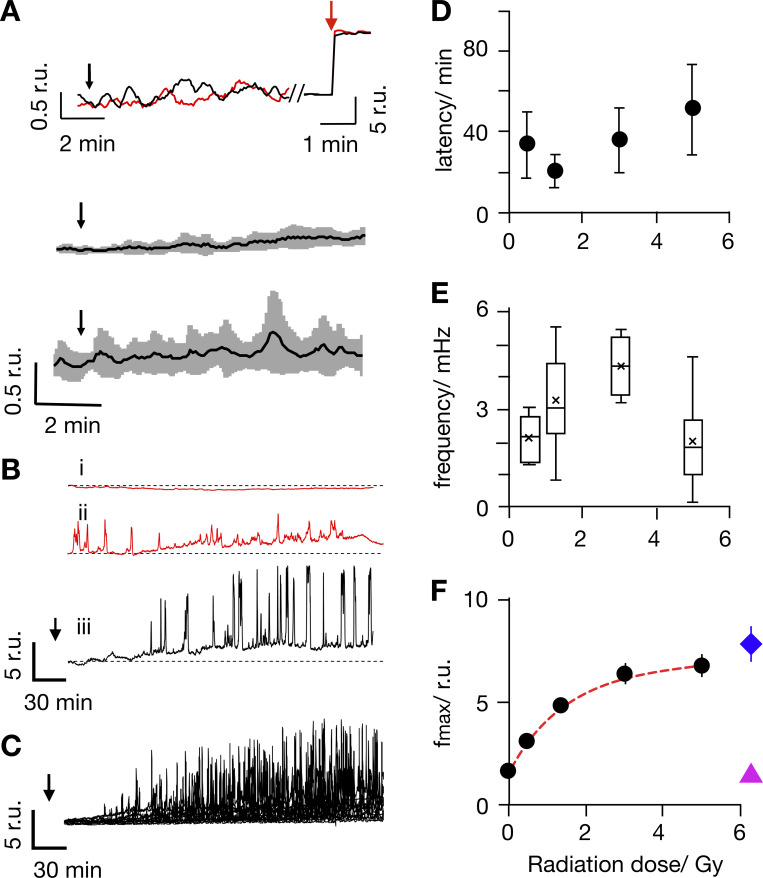
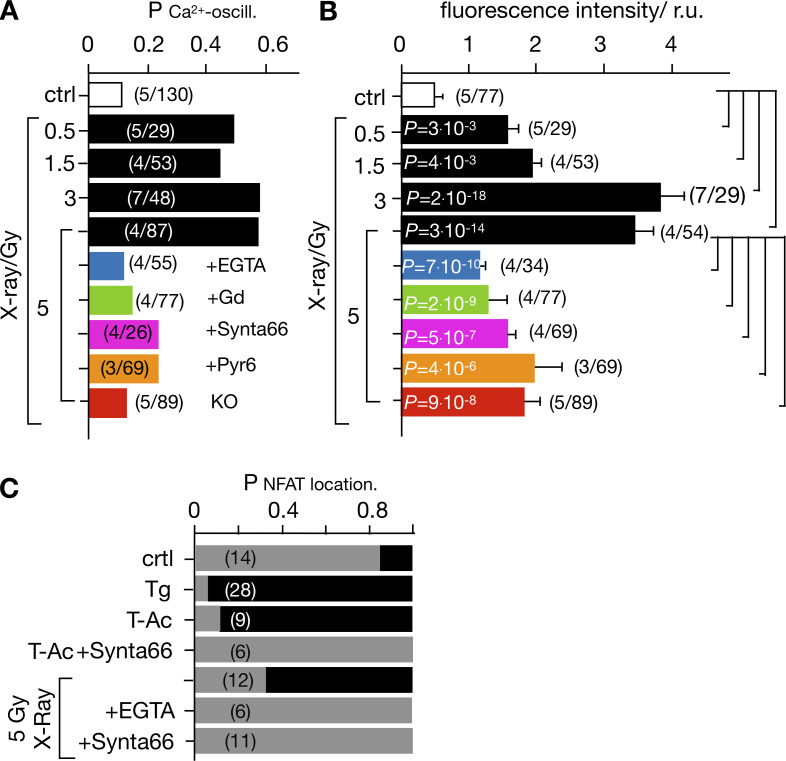
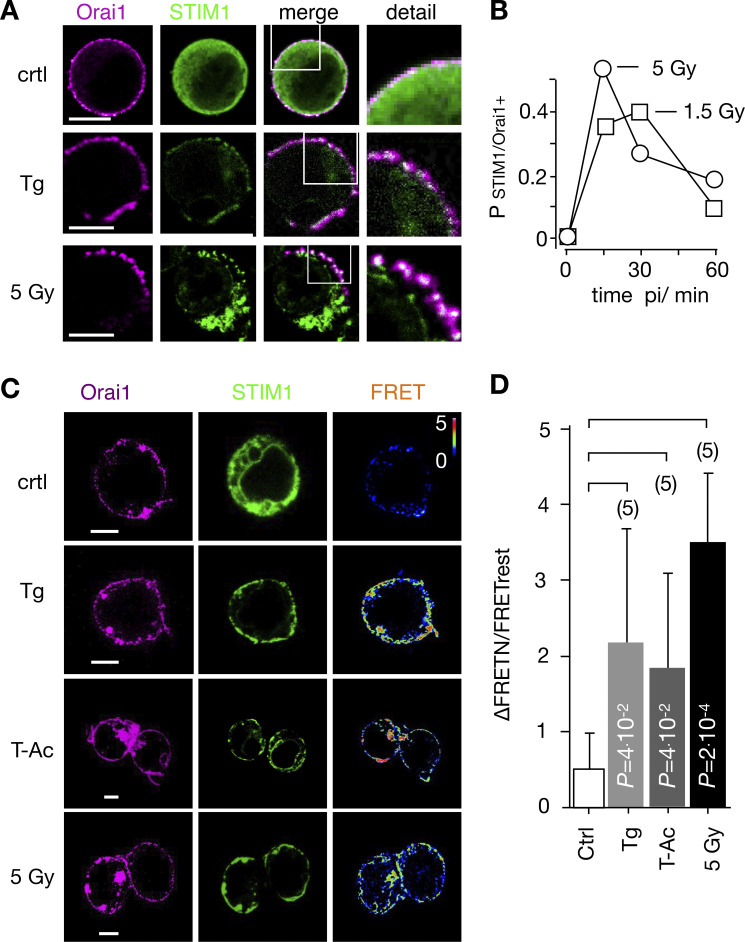
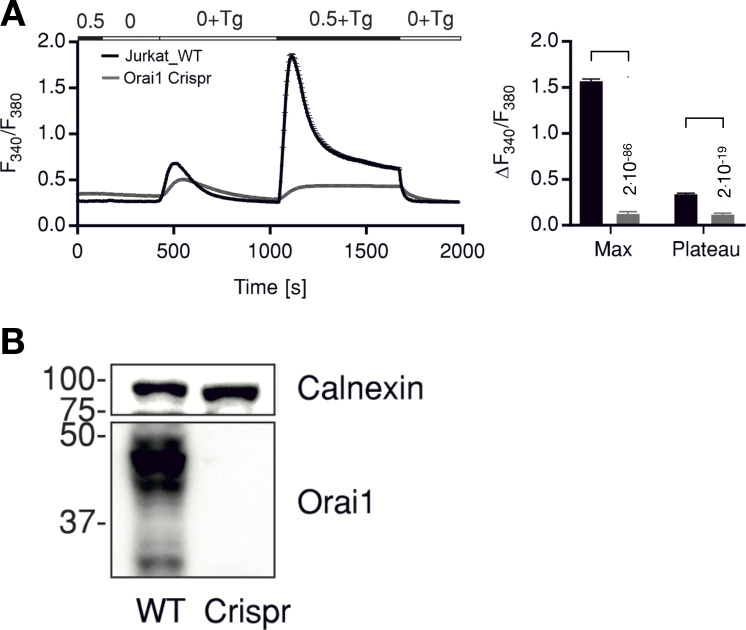
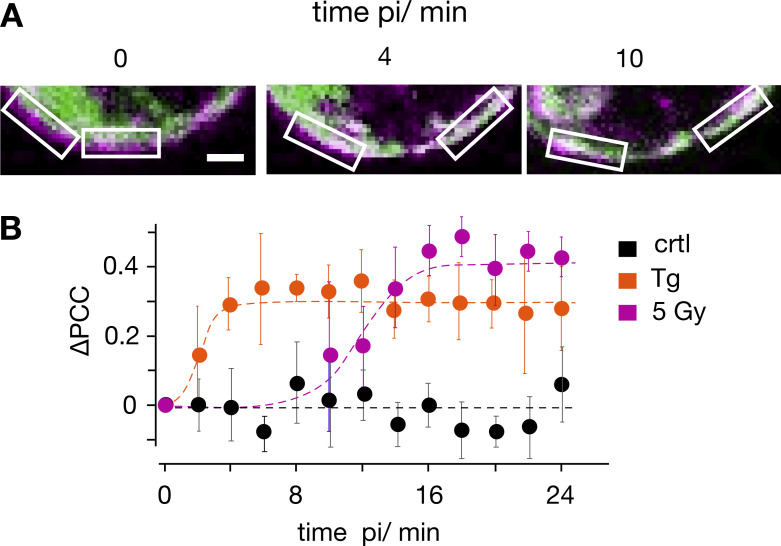
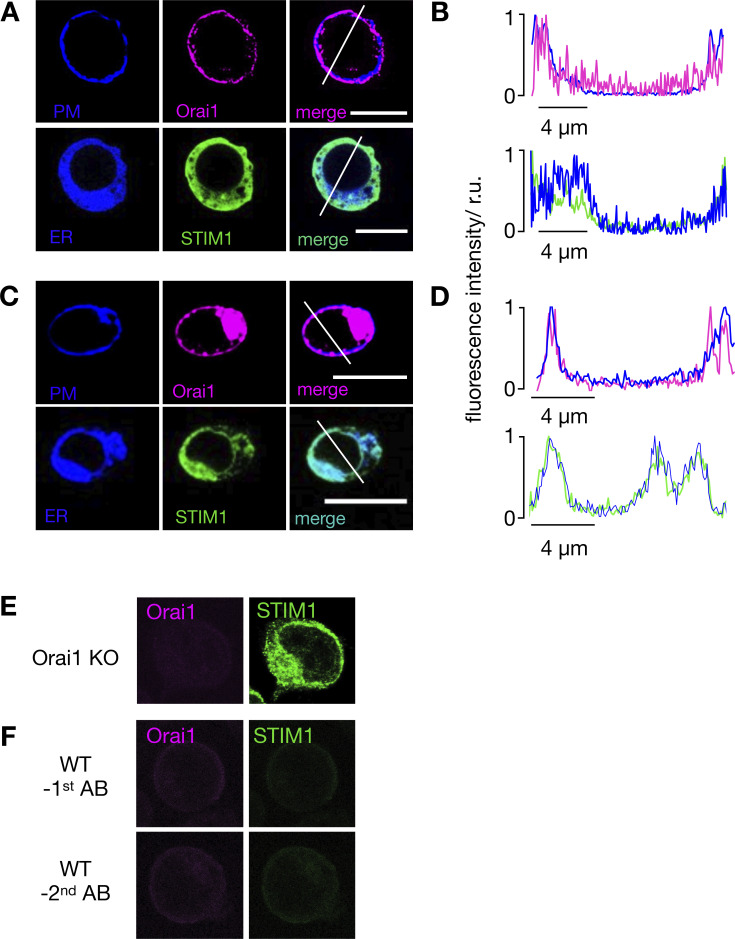
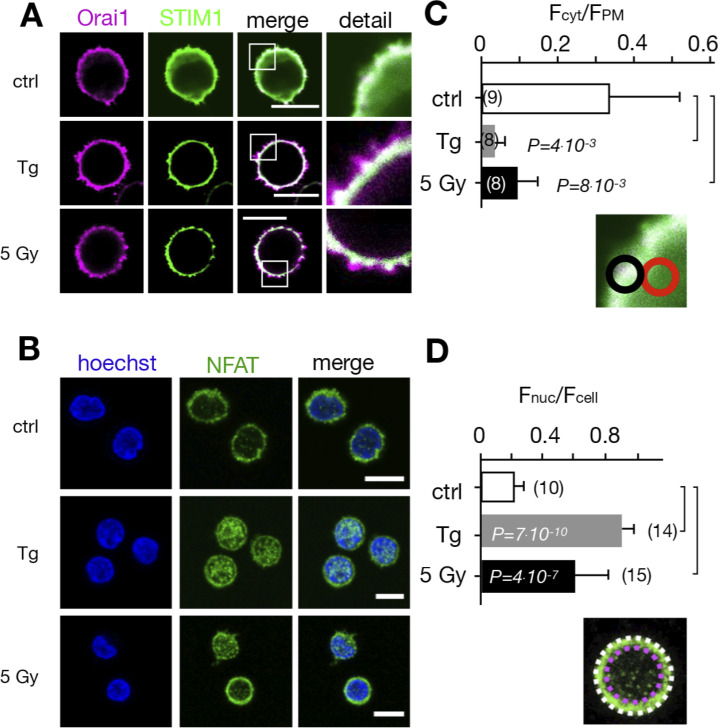
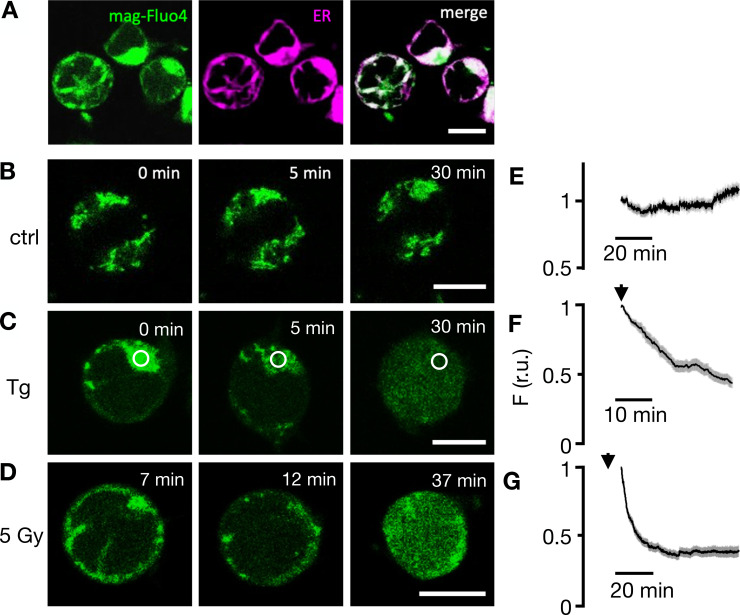
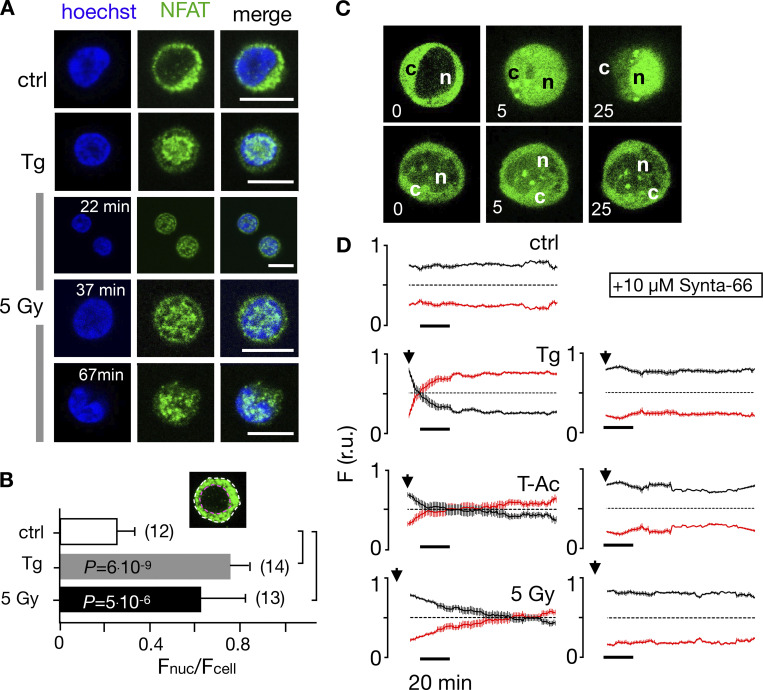
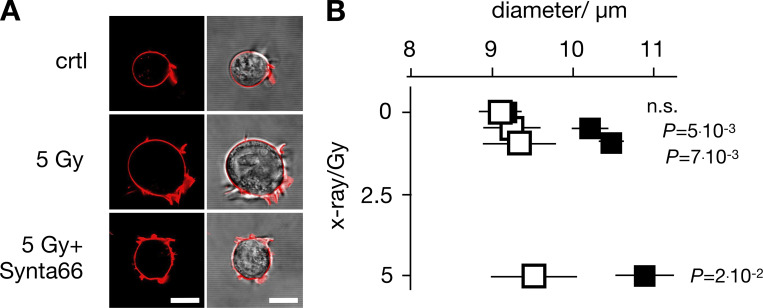
Radiation therapy efficiently eliminates cancer cells and reduces tumor growth. To understand collateral agonistic and antagonistic effects of this treatment on the immune system, we examined the impact of x-ray irradiation on human T cells. We find that, in a major population of leukemic Jurkat T cells and peripheral blood mononuclear cells, clinically relevant radiation doses trigger delayed oscillations of the cytosolic Ca2+ concentration. They are generated by store-operated Ca2+ entry (SOCE) following x-ray-induced clustering of Orai1 and STIM1 and formation of a Ca2+ release-activated Ca2+ (CRAC) channel. A consequence of the x-ray-triggered Ca2+ signaling cascade is translocation of the transcription factor nuclear factor of activated T cells (NFAT) from the cytosol into the nucleus, where it elicits the expression of genes required for immune activation. The data imply activation of blood immune cells by ionizing irradiation, with consequences for toxicity and therapeutic effects of radiation therapy.


Figures

Figure 1.
Figure 1.
Ionizing irradiation elicits delayed Ca2+cyt oscillations with distinct frequencies and amplitudes. (A) Representative Fluo-4 signals report constant Ca2+cyt in individual Jurkat cells (top). Fluorescence was recorded in real time before, during, and after irradiation with 1 Gy (red) and 10 Gy (black) x rays at times indicated by black arrows. The same cells responded with a maximal fluorescence increase after addition of 1 µM ionomycin (red arrow). Mean Fluo-4 intensity from cells irradiated at arrow with 1 Gy (middle) or 10 Gy (bottom) x rays. Data are means (black) ± SD (gray) from experiments as in A, with 15 cells for each dose. (B) Representative long-term measurements of Fluo-4 intensity in Jurkat cells, of which two were not irradiated (i, ii, ctrl., red) and the other was exposed to 5 Gy x ray (iii, black). Time of x-ray exposure is indicated by black arrows. While unirradiated control cells maintain a stable Fluo-4 signal (i) or reveal irregular oscillations (ii), the irradiated cell starts to oscillate after a lag time (iii). (C) Overlay of Fluo-4 signal from 15 individual cells after irradiation with 5 Gy; time of x-ray exposure is indicated by black arrow. (D–F) Latency time between onset of Ca2+cyt oscillations after irradiation, oscillation frequency (E), and maximal amplitude of oscillation (F) as a function of irradiation dose. The colored symbols show different levels of Fluo-4 fluorescence intensity: Fluo-4 intensity elicited by 5 Gy in Ca2+ free external buffer including 5 mM EGTA (magenta triangle) and maximal Fluo-4 intensity after adding 1 µM ionomycin (blue diamond). Data are mean values ± SD from ≥25 cells per dose; box plot indicates 25th and 75th percentiles of data; and whiskers indicate 5% and 95% limits. All Ca2+cyt measurements in response to x-ray irradiation were performed in buffer containing 2 mM Ca2+.
Figure 2.
Figure 2.
Radiation-induced Ca2+cyt oscillations and nuclear NFAT translocation are triggered by x rays and abolished after inhibition of Ca2+ influx. The probability for detecting Ca2+cyt oscillations (PCa2+-oscill.) in Jurkat cells as in Fig. 1 Biii. A population of cells was imaged under the aspect of finding ≥10 min after start of imaging Ca2+cyt oscillations defined as ≥5 repetitive Ca2+cyt spikes. Cells were either not irradiated (ctrl, open bar) or exposed to x-ray doses of 0.5–5 Gy in the absence (black bars) or presence of 5 mM EGTA (blue bar), 5 μM Gd3+ (green bar), 10/5 µM CRAC channel inhibitor Synta66 (magenta), or Pyr6 (orange). The same experiments were also performed with cells in which Orai1 was knocked out (KO; red bar). (B) Mean fluorescence (± SD) collected over a time window of 60–120 min after start of imaging from cells treated as in A. (C) Probability of detecting NFAT in cytosol (gray bar) or in nucleus (black bar) as in Fig. 6 A in untreated/nonirradiated control cells (crtl) and cells treated with 2 µM Tg or with 25 μl/ml ImmunoCult Human CD3/CD28/CD2 T-Ac without and with 10 µM Synta66. Other cells were exposed to 5 Gy x rays without or with 5 mM EGTA or 10 µM Synta66. Numbers in brackets in A–C give number of experiments (N)/total number of cells analyzed (n). Statistical differences between treatments in B analyzed by unpaired Student’s t test, with respective P values given in the figure.
Figure 3.
Figure 3.
IR triggers Ca2+ regulated STIM1/Orai1 CRAC channel formation. (A) Distribution of endogenous Orai1 (magenta, first column) and STIM1 (green, second column) in Jurkat cells immune-stained with Alx647 and Alx488, respectively. Overlays of green and magenta images with magnification of indicated areas are shown in third and fourth columns. Fixed cells were obtained from untreated/nonirradiated control cells (top row), cells treated for 15 min with 2 µM Tg (central row), or cells 15 min after 5-Gy x-ray exposure (bottom row). (B) Probability of finding, in a population of Jurkat cells, positive clustering of STIM1/Orai1 (PSTIM1/Orai1+) after irradiation with 1.5 Gy (squares) or 5 Gy (circles). Criteria for cluster detection are specified in Materials and methods. For each condition, ≥282 cells were analyzed. (C) Representative confocal images of same cells with fluorescent donor molecule Orai1::eCFP (magenta, first column), acceptor molecule STIM1::eYFP (green, second column), and heatmaps of the resulting FRET signals (third column) 15 min after treatment. Images are from untreated cells (control), cells incubated with 2 µM Tg, 25 μl/ml ImmunoCult Human CD3/CD28/CD2 T-Ac, or irradiated with 5 Gy. All three treatments generate a visible FRET-signal in the PM. Scale bars, 10 μm. (D) Mean FRET signal (±SD, n ≥ 5) from PM of cells as in C: untreated/nonirradiated control cells (crtl), cells 5 min in 2 μM Tg, 15 min in 25 μl/ml T-Ac, or 20 min after irradiation with 5 Gy. Statistical differences between treatments were analyzed by unpaired Student’s t test, and respective P values are given in the figure.
Figure S1.
Figure S1.
Knockout of Orai1 in Jurkat cells abolishes Tg induced Ca2+ release. (A) Average traces showing changes in Ca2+cyt as indicated by fluorescence ratio (F340/F380) of ratiometric calcium dye Fura-2 over time in response to Tg-induced ER calcium store depletion and Ca2+ readdition by changing extracellular solutions as shown in the bar above. Measurements were done in control Jurkat cells (WT, black) or in cells where Orai1 was deleted (Orai1-Crispr, gray). The right panel shows quantification of maximum (Max) and steady-state (Plateau) changes in fluorescence ratio + SD from 135 to 176 cells measured in N = 3 independent experiments. Statistical differences between WT and Crispr cells were analyzed by unpaired Student’s t test, and respective P values are given in the figure. (B) Western blot analysis of cells measured in A showing deletion of Orai1 in Crispr-Cas9–treated cells. Source data are available for this figure: SourceData FS1.
Figure 4.
Figure 4.
Time course of stimulus-induced STIM1/Orai1 colocalization. (A) Fluorescent images of a representative Jurkat cell cotransfected with STIM1::eYFP (green) and Orai1::eCFP (magenta) with focus on PM/cytosol interface. Images were taken before (0 min) and 4 and 10 min after treating cells with 10 μM Tg. White boxes show ROIs in membrane/cytosol interface for calculating PCC value of the two fluorescent markers. (B) Change in PCC (∆PCC) for colocalization of STIM1::eYFP and Orai1::eCFP. Data obtained from confocal live-cell real-time acquisition of Jurkat cells as in A, heterologously expressing the two proteins. In five independent experiments a mean PCC of 3.8 ± 0.08 was estimated from 18 untreated control cells (triangle). Changes in PCC values over time from untreated and treated cells (circles) are shown as deviation from this control value (∆PCC). The PCC values of untreated cells remain at the same level (ctrl, black) but increase with different kinetics in cells stimulated with 2 µM Tg (orange) or 5 Gy x rays (5 Gy, magenta). The data were fitted with logistic equation (Eq. 2, solid lines) yielding the following times for half-maximal increase in STIM1/Orai1 colocalization: 2 min for Tg and 12 min for x ray. Data for the three conditions are mean values ± SD from N ≥ 4 independent experiments with n ≥ 4 cells each. Scale bars, 2.5 μm.
Figure S2.
Figure S2.
In resting Jurkat cells, STIM1 and Orai1 are located in the ER and PM, respectively. (A and C) Confocal images of cellular distribution of endogenous STIM1 and Orai1 in Jurkat cells (A) and PBMCs (C). PM and ER of cells (first row) were stained with CellMaskOrange and ER-tracker red, respectively. Images shown as false color in blue. The second row shows immunostaining of STIM1 (green) and Orai1 (magenta) and secondary antibody tagged with Alx488 and Alx647, respectively. An overlay of both channels is shown in right column. (B and D) Line plots for each marker were taken in positions report in merged images. Fluorescence intensity of either Orai1/PM (B) or STIM1/ER (D) were normalized to the highest value of each signal; the colors of line plots correspond to those in images. All scale bars, 10 μm. The antibodies for detecting STIM1 and Orai1 are specific. (E) Jurkat cells in which Orai1 was knocked out (Fig. S2) generate no more signal in immunostaining with Orai1 antibody, while still producing signal with STIM1 antibody. (F) Staining of WT Jurkat cells in which either the primary STIM1 or Orai1 antibodies (top row) or the respective secondary antibodies (bottom row) were left out generated no appreciable fluorescent signals.
Figure 5.
Figure 5.
Calcium-dependent SOCE/NFAT pathway is activated by IR in naive T-lymphocytes. (A) Distribution of endogenous Orai1 (magenta, first column) and STIM1 (green, second column) in fixed PBMCs immunostained with secondary antibodies Alx488 and Alx647, respectively. A merge of the two channels is shown in the third column, with higher magnification of marked areas in the fourth column. The merge of untreated control cells additionally shows the nucleus stained with Hoechst DNA dye (blue). Images show cells that were fixed as untreated/nonirradiated control cells (ctrl, top row) and cells fixed 15 min after treatment with 2 µM Tg (second row) or after exposing cells to 5 Gy (third row). (B) Mean ratio (± SD, number of cells in brackets) of green fluorescence in ROI (inset image, red circle) in cytosol divided by fluorescence in ROI in direct vicinity over PM (black circle). Data from untreated control cells (ctrl) as well as cells exposed to 2 μM Tg or 5 Gy x rays 60 min after treatment. (C) Confocal images of PBMCs showing nucleus stained with Hoechst DNA dye (blue, first column) and endogenous NFATc2 (green, second column) stained with Alx488. Overlay of both columns is shown in third column. Cells were fixed immediately (untreated/nonirradiated control, top row), 15 min after 2 µM Tg Ca2+ store depletion (second row) or 60 min after x-ray exposure with 5 Gy (third/fourth row). All scale bars, 10 μm. (D) Mean ratio (± SD, number of cells in brackets) of GFP fluorescence in nucleus (inset image, magenta circle) divided by fluorescence of total cell (white circle). Statistical differences between treatments in B and D were analyzed by unpaired Student’s t test, and respective P values are given in the figure. Source data are available for this figure: SourceData F5.
Figure 6.
Figure 6.
Fluorescent sensor Mag-Fluo-4 reports depletion of ER Ca2+ in Jurkat cells as a response to irradiation. (A) Fluorescent images of representative Jurkat cells loaded with Mag-Fluo-4 (green, first column) and stained with ER tracker red (magenta, second column) exhibit colocalization of both fluorescent signals in merged image (third column). (B) In untreated control cells, the Mag-Fluo-4 fluorescence in the ER remains constant. (C) Challenging cells with 2 µM Tg (D) or irradiating cells with 5 Gy x rays elicits progressive decrease in Mag-Fluo-4 fluorescence in ER with concomitant increase in cytosol. Times in images denote time point of imaging after respective treatment. Corresponding mean values of relative Mag-Fluo-4 fluorescence (± SD) in ROI (white circle in C) over ER in untreated control cells (E), cells exposed to 2 μM Tg (F), and cells irradiated with 5 Gy x rays (G). Start of imaging after treatments are indicated by an arrow. Data in E–G were normalized to fluorescence values at start of analysis from ≥35 cells per treatment in ≥7 experiments. Scale bars, 10 µm.
Figure 7.
Figure 7.
Nuclear translocation of Ca2+-dependent NFAT in Jurkat cells. (A) Confocal images of Jurkat cells in which nucleus was stained with Hoechst DNA dye (blue, first column) and endogenous NFATc2 immunostained with secondary antibody Alx488 (green, second column). The third column shows a merge of blue and green channels. Cells were fixed immediately in untreated/nonirradiated control cells (ctrl, first row), 15 min after 2 µM Tg Ca2+ store depletion (Tg, second row), or 15, 30, and 60 min after x-ray exposure with 5 Gy (three bottom rows). (B) Mean ratio (± SD, number of cells in brackets) of GFP fluorescence in nucleus (inset, magenta circle) divided by fluorescence of total cell (white circle). Statistical differences between treatments were analyzed by unpaired Student’s t test, and respective P values are given in the figure. (C) Live-cell imaging of nuclear import of transiently expressed NFATc2-GFP from cytosol (c) to nucleus (n) in Jurkat cells after stimulation with 2 μM Tg in absence (top) or presence (bottom) of 10 µM CRAC channel inhibitor Synta66. Numbers indicate time in minutes after treatment. (D) Kinetic analysis of NFATc2-GFP nuclear translocation from cytosol (black) to nucleus (red). Data are from confocal imaging of Jurkat cells in untreated control condition (crtl), with 2 µM Tg in 25 μl/ml activator (T-Ac), or after 5 Gy x-ray exposure (5 Gy). Data were obtained without (left) and with (right) 10 µM Synta66. Each time course diagram is the mean ± SE of ≥12 individually measured cells. Addition of Tg and T-Ac as well as time of x-ray irradiation are indicated by arrows in D. Relative fluorescence values for NFAT in cytosol (black) and nucleus are (red) were normalized to 1. Source data are available for this figure: SourceData F7.
Figure 8.
Figure 8.
CRAC channel blocker Synta66 inhibits x-ray–stimulated increase in Jurkat cell diameter. (A) Jurkat cells exhibit a dose-dependent increase in diameter 24 h after irradiation, which can be abolished by 10 µM CRAC channel inhibitor Synta66. Representative images (left, confocal image of fluorescent stained PM [red]; right, overlay of fluorescent and bright field image) of individual Jurkat cells. Images were taken 24 h after start of experiment with an untreated control cell (ctrl), a cell exposed to 5 Gy x rays alone (5 Gy) or with 10 µM Synta66 (5 Gy + Synta66). (B) Mean diameters ± SD of >300 cells per treatment (N ≥ 5 independent experiments) 24 h after exposure to 0–5 Gy x rays in the absence (black square) or presence (open square) of 10 µM Synta66. Statistical differences between treatments ± Synta66 were analyzed by unpaired Student’s t test, and respective P values are given in the figure. All scale bars, 10 μm.

References

    1. Abraham, R.T., and Weiss A.. 2004. Jurkat T cells and development of the T-cell receptor signalling paradigm. Nat. Rev. Immunol. 4:301–308. 10.1038/nri1330 - DOI - PubMed
    1. Adding, L.C., Bannenberg G.L., and Gustafsson L.E.. 2001. Basic experimental studies and clinical aspects of gadolinium salts and chelates. Cardiovasc. Drug Rev. 19:41–56. 10.1111/j.1527-3466.2001.tb00182.x - DOI - PubMed
    1. Bauer, M., Goldstein M., Christmann M., Becker H., Heylmann D., and Kaina B.. 2011. Human monocytes are severely impaired in base and DNA double-strand break repair that renders them vulnerable to oxidative stress. Proc. Natl. Acad. Sci. USA. 108:21105–21110. 10.1073/pnas.1111919109 - DOI - PMC - PubMed
    1. Biagi, B.A., and Enyeart J.J.. 1990. Gadolinium blocks low- and high-threshold calcium currents in pituitary cells. Am. J. Physiol. 259:C515–C520. 10.1152/ajpcell.1990.259.3.C515 - DOI - PubMed
    1. Bootman, M.D., and Berridge M.J.. 1995. The elemental principles of calcium signaling. Cell. 83:675–678. 10.1016/0092-8674(95)90179-5 - DOI - PubMed

Publication types