. 2022 Jun;10(3):e00949.
doi: 10.1002/prp2.949.

Inhibition of epigenetic reader proteins by apabetalone counters inflammation in activated innate immune cells from Fabry disease patients receiving enzyme replacement therapy

Affiliations

Inhibition of epigenetic reader proteins by apabetalone counters inflammation in activated innate immune cells from Fabry disease patients receiving enzyme replacement therapy

Li Fu et al. Pharmacol Res Perspect. 2022 Jun.

Abstract

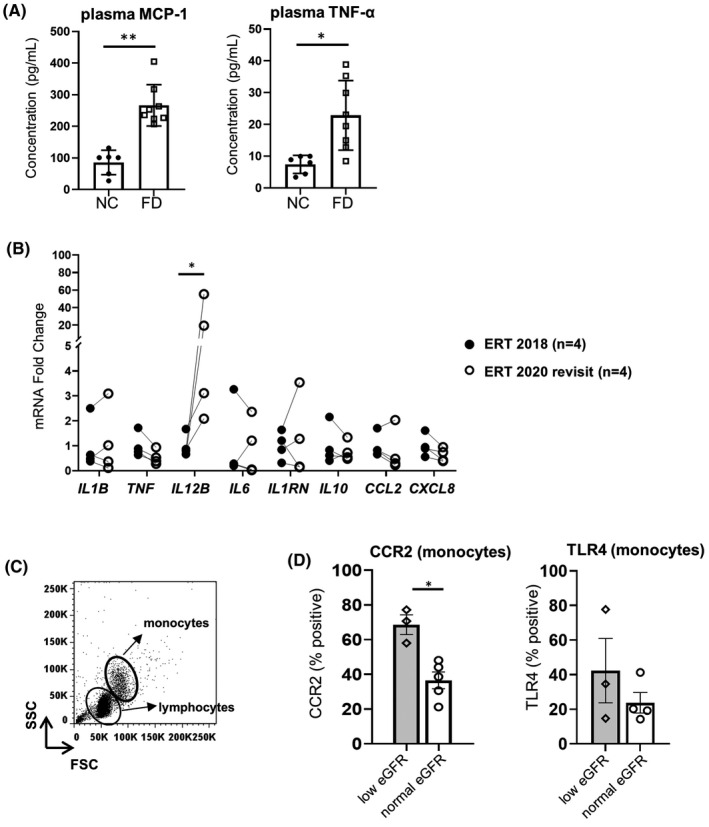
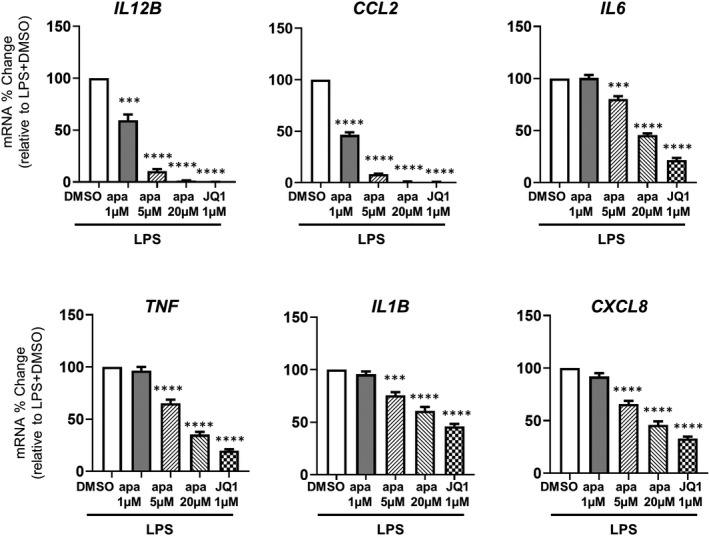
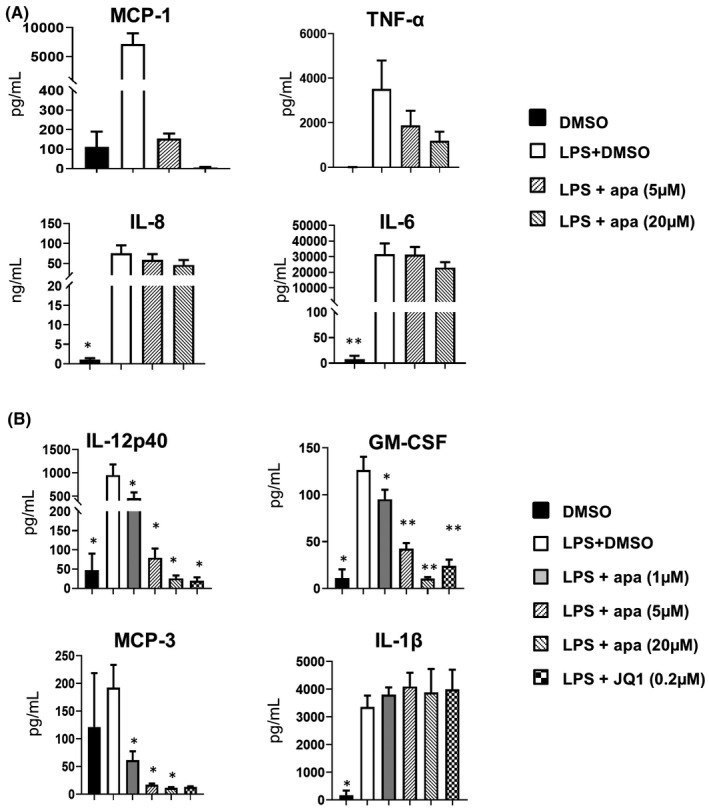
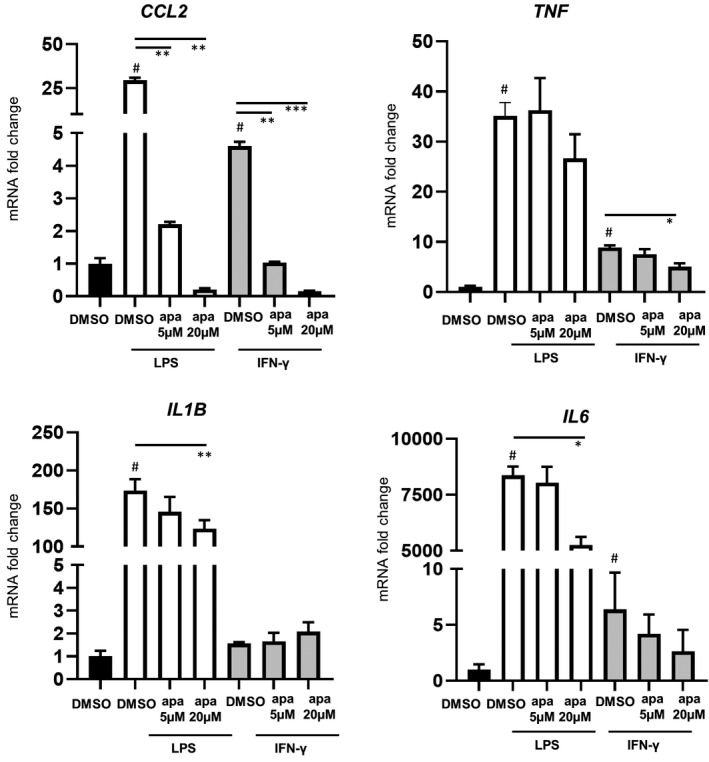
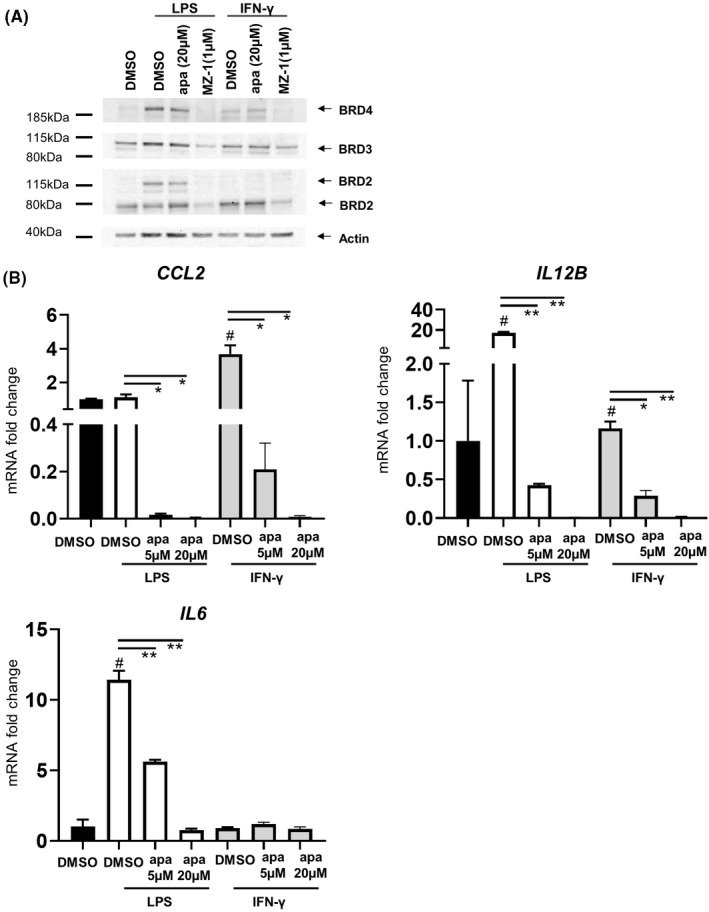
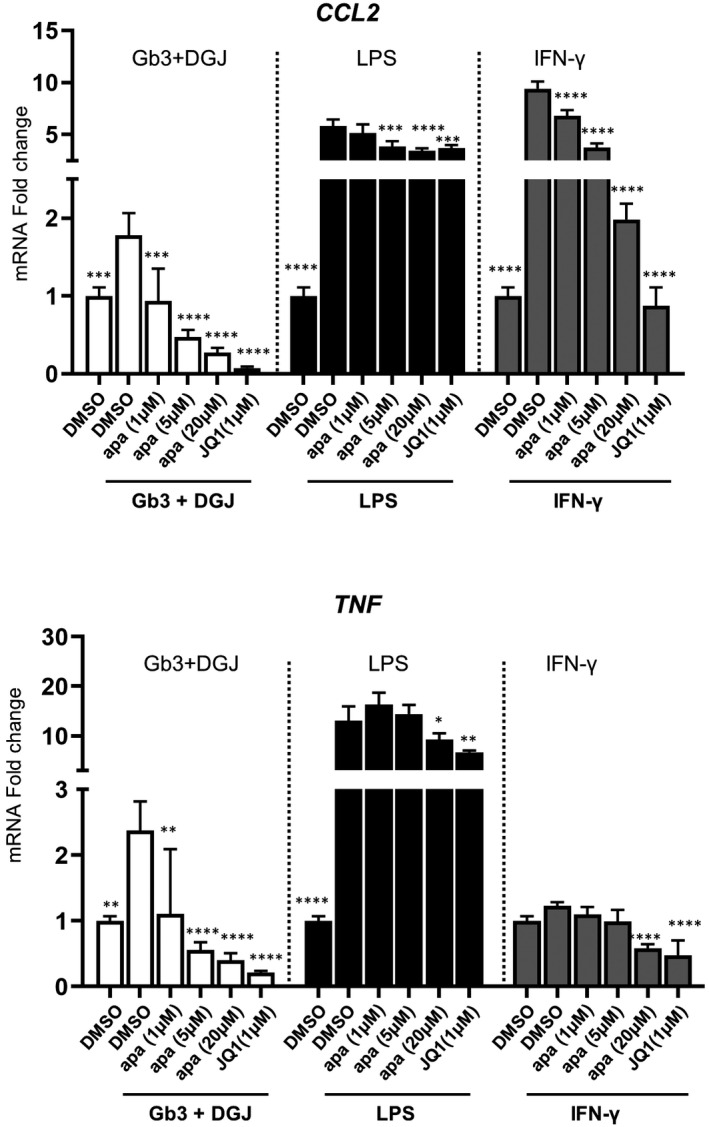
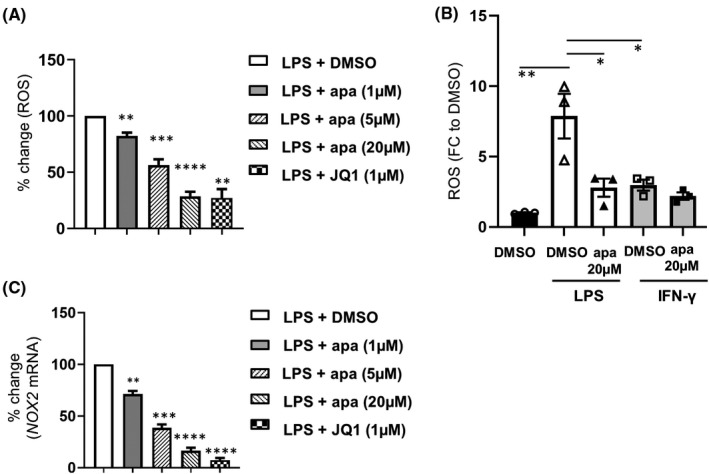
Fabry disease (FD) is a rare X-linked disorder of lipid metabolism, characterized by the accumulation of globotriaosylceramide (Gb3) due to defective the lysosomal enzyme, α-galactosidase. Gb3 deposits activate immune-mediated systemic inflammation, ultimately leading to life-threatening consequences in multiple organs such as the heart and kidneys. Enzyme replacement therapy (ERT), the standard of care, is less effective with advanced tissue injury and inflammation in patients with FD. Here, we showed that MCP-1 and TNF-α cytokine levels were almost doubled in plasma from ERT-treated FD patients. Chemokine receptor CCR2 surface expression was increased by twofold on monocytes from patients with low eGFR. We also observed an increase in IL12B transcripts in unstimulated peripheral blood mononuclear cells (PBMCs) over a 2-year period of continuous ERT. Apabetalone is a clinical-stage oral bromodomain and extra terminal protein inhibitor (BETi), which has beneficial effects on cardiovascular and kidney disease related pathways including inflammation. Here, we demonstrate that apabetalone, a BD2-selective BETi, dose dependently reduced the production of MCP-1 and IL-12 in stimulated PBMCs through transcriptional regulation of their encoding genes. Reactive oxygen species production was diminished by up to 80% in stimulated neutrophils following apabetalone treatment, corresponding with inhibition of NOX2 transcription. This study elucidates that inhibition of BET proteins by BD2-selective apabetalone alleviates inflammatory processes and oxidative stress in innate immune cells in general and in FD. These results suggest potential benefit of BD2-selective apabetalone in controlling inflammation and oxidative stress in FD, which will be further investigated in clinical trials.

Keywords: BETi; Fabry disease; apabetalone; epigenetics; inflammation; oxidative stress.


Figures

FIGURE 1
FIGURE 1
Baseline immune profiles in plasma and peripheral blood mononuclear cells (PBMCs) from enzyme replacement therapy (ERT)‐treated Fabry disease (FD) patients. (A) Plasma MCP‐1 and TNF‐α levels in ERT‐treated FD patients (n = 8) versus normal controls (NCs) (n = 6). (B) Comparison of indicated gene transcript levels in PBMCs from ERT patients with normal eGFR after 2 years of ERT (n = 4). (C) Representative dot plot of gating lymphocyte and monocyte subpopulations in PBMCs isolated from the whole blood of one patient. (D) Monocyte fraction expressing surface CCR2 and TLR4 in ERT‐treated FD patients with indicated eGFR using the same gating strategy as in A. eGFR >60 denotes eGFR levels >60 ml/min/1.73 m2, while eGFR <60 indicates eGFR <60 ml/min/1.73 m2. In (A) and (D), bar graphs show the mean ± SD. Statistical significance was determined by Mann–Whitney or Wilcoxon test. *p < .05, **p < .01
FIGURE 2
FIGURE 2
BETi treatment effects on the inducible expression of inflammatory genes in lipopolysaccharide (LPS)‐stimulated peripheral blood mononuclear cells (PBMCs) from Fabry disease patients. Quantification of the indicated gene expression changes driven by apabetalone in PBMCs (enzyme replacement therapy, n = 7) using quantitative RT‐PCR. Bar graphs show the mean ± SEM. On the x‐axis, apa = apabetalone. Statistical significance was determined by one‐way repeated measures ANOVA followed by Dunnett's multiple comparison test compared with LPS+DMSO. *p < .05, **p < .01, ***p < .001, ****p < .0001
FIGURE 3
FIGURE 3
Cytokine profile in supernatants from cultured peripheral blood mononuclear cells from enzyme replacement therapy patients (n = 7) in response to lipopolysaccharide (LPS) stimulation with 18 h apabetalone or JQ1 co‐treatment. Cytokine levels were determined by (A) BDTM Cytometric Bead Array Human Chemokine Kit (BD Biosciences). Bar graphs show the mean ± SEM or (B) Human Cytokine/Chemokine Array 42 plex (Eve Technologies Corp.). In A‐B, apa = apabetalone. Statistical significance was determined by one‐way repeated measures ANOVA followed by Dunnett's multiple comparison test relative to LPS + DMSO. *p < .05, **p < .01
FIGURE 4
FIGURE 4
Effects of BETi on the inducible expression of inflammatory genes in stimulated peripheral blood mononuclear cells from Fabry disease patients with lipopolysaccharide (LPS) or IFN‐γ in vitro stimulation (= 3). Bar graphs show the mean ± SEM. On the x‐axis, apa = apabetalone. Statistical significance was determined by one‐way ANOVA followed by Dunnett's multiple comparison test compared with LPS + DMSO or IFN‐γ+DMSO. *p < .05, **p < .01, ***p < .001. # denotes p < .05 when comparing with DMSO
FIGURE 5
FIGURE 5
The influence of BET protein knock‐down on the expression of inflammatory genes induced by LPS or IFN‐γ. Representative Western blot analysis of BRD2, BRD3, and BRD4 protein abundance in cell lysates of peripheral blood mononuclear cells (PBMCs) in response to LPS or IFN‐γ stimulation with apabetalone (BET inhibitor) or MZ‐1 (BET degrading PROTAC) co‐treatment. (B) Quantification of pro‐inflammatory gene expression changes in PBMC samples treated with apabetalone or MZ‐1 as indicated in (A). Bar graphs show the mean ± SEM. Apa = apabetalone. Statistical significance was determined by one‐way ANOVA followed by Dunnett's multiple comparison test relative to LPS + DMSO or IFN‐γ + DMSO. *p < .05, **p < .01. # denotes p < .05 when comparing with DMSO
FIGURE 6
FIGURE 6
Assessment of inflammatory gene level changes in THP1 cells stimulated with Gb3+DGj, LPS or IFN‐γ with BETi co‐treatment. THP1 cells were stimulated as indicated with BETi co‐treatments for 4 h. Data were normalized to the baseline condition (naive) (n = 4), apa = apabetalone. Bar graphs show the mean ± SD. Statistical significance was calculated by one‐way ANOVA followed by Dunnett's multiple comparison test relative to their corresponding stimulation conditions (GB3 + DGJ + DMSO, LPS + DMSO or IFN‐γ + DMSO). *p < .05, **p < .01, ***p < .001, ****p < .0001
FIGURE 7
FIGURE 7
BETi effects on reactive oxygen species (ROS) production in stimulated neutrophils from enzyme replacement therapy–treated Fabry disease patients. (A) percent change in ROS driven by apabetalone. Data were normalized to the stimulation condition (LPS + DMSO) in individual patients (n = 7). (B) ROS level fold change to baseline (DMSO) in LPS or IFN‐γ stimulated neutrophils with apabetalone co‐treatment (n = 3). (C) Apabetalone treatment (4 h) downregulates LPS induced NOX2 gene expression in a dose‐dependent manner. Data were normalized to the LPS + DMSO condition in individual patients. In (A) and (C), Data were normalized to the LPS + DMSO condition in individual patients. Bar graphs show the mean ± SEM. Statistical significance was determined by Mann–Whitney test or one‐way ANOVA followed by Dunnett's multiple comparison test relative to stimulated conditions (LPS + DMSO or IFN‐γ + DMSO). *p < .05, **p < .01, ***p < .001, ****p < .0001

References

    1. Germain DP. Fabry disease. Orphanet J Rare Dis. 2010;5:30. doi:10.1186/1750-1172-5-30 - DOI - PMC - PubMed
    1. Rozenfeld P, Feriozzi S. Contribution of inflammatory pathways to Fabry disease pathogenesis. Mol Genet Metab. 2017;122(3):19‐27. doi:10.1016/j.ymgme.2017.09.004 - DOI - PubMed
    1. Simoncini C, Torri S, Montano V, et al. Oxidative stress biomarkers in Fabry disease: is there a room for them? J Neurol. 2020;267(12):3741‐3752. doi:10.1007/s00415-020-10044-w - DOI - PMC - PubMed
    1. Desnick RJ, Ioannou YA, Eng CM. α‐Galactosidase A deficiency: Fabry disease. In: Valle DL, Antonarakis S, Ballabio A, Beaudet AL, Mitchell GA, eds. The Online Metabolic and Molecular Bases of Inherited Disease. McGraw‐Hill Education; 2019.
    1. Kok K, Zwiers KC, Boot RG, Overkleeft HS, Aerts JMFG, Artola M. Fabry disease: molecular basis, pathophysiology, diagnostics and potential therapeutic directions. Biomolecules. 2021;11(2):271. doi:10.3390/biom11020271 - DOI - PMC - PubMed

Publication types