. 2022 Apr 12;55(4):671-685.e10.
doi: 10.1016/j.immuni.2022.03.007.

The interferon-stimulated gene RIPK1 regulates cancer cell intrinsic and extrinsic resistance to immune checkpoint blockade

Affiliations

The interferon-stimulated gene RIPK1 regulates cancer cell intrinsic and extrinsic resistance to immune checkpoint blockade

Lisa Cucolo et al. Immunity. .

Abstract

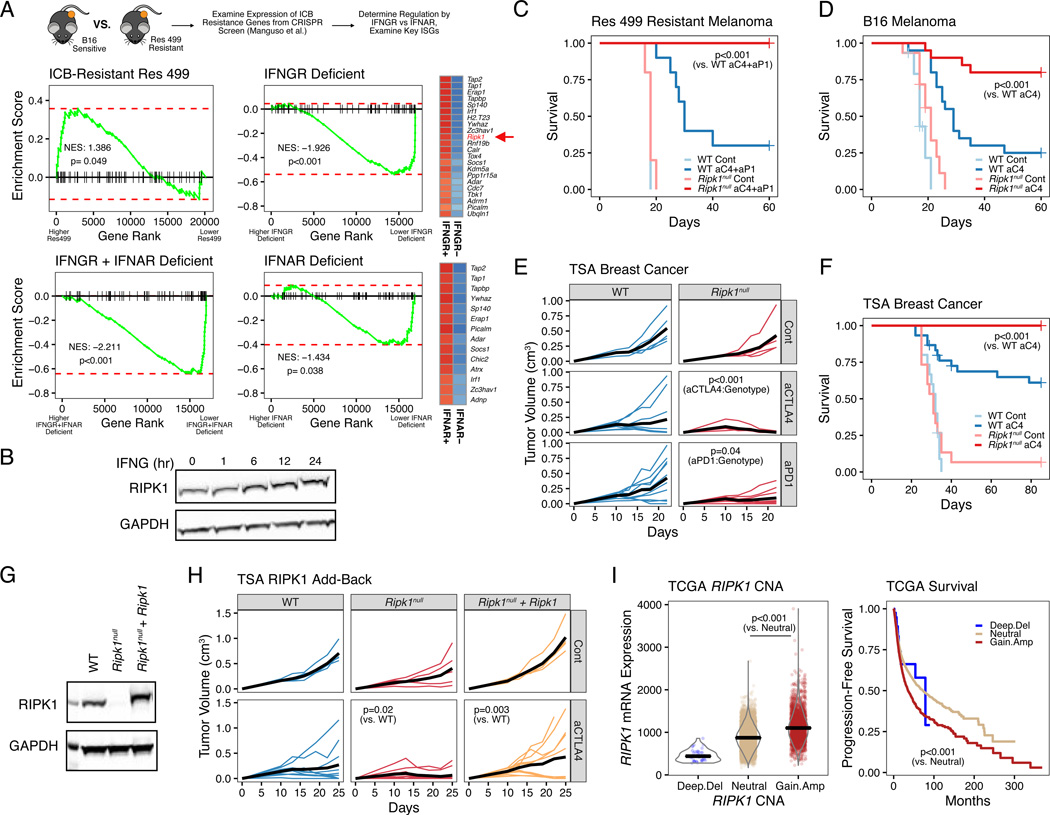
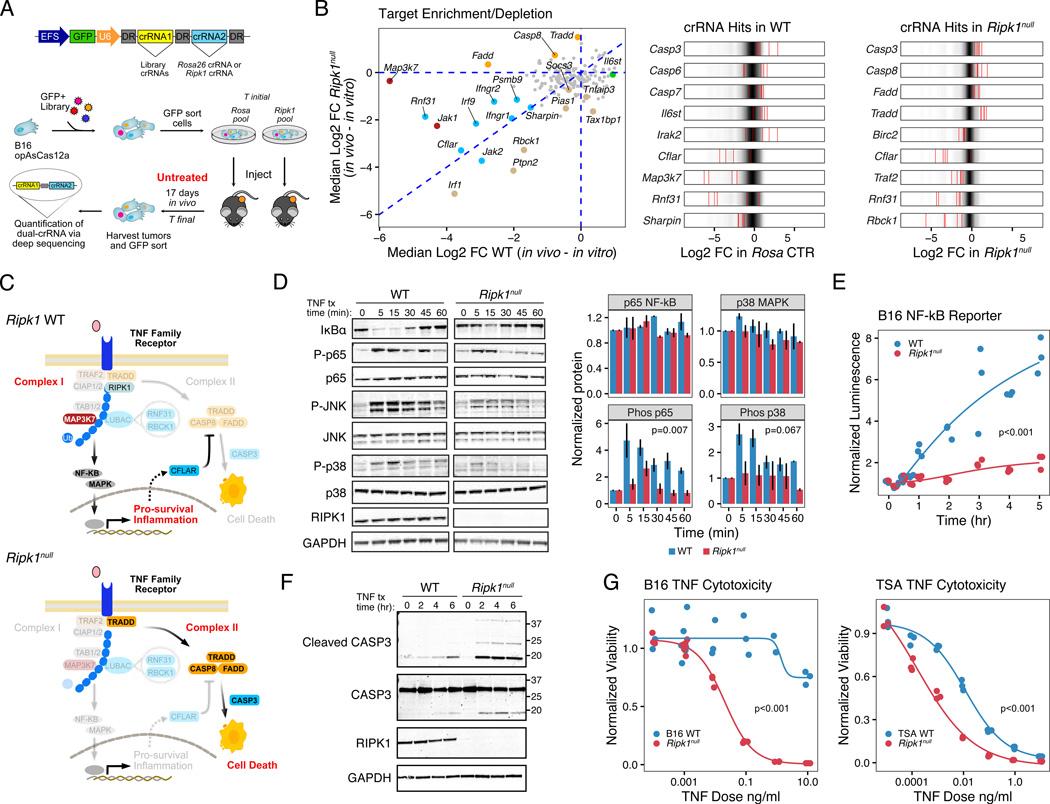
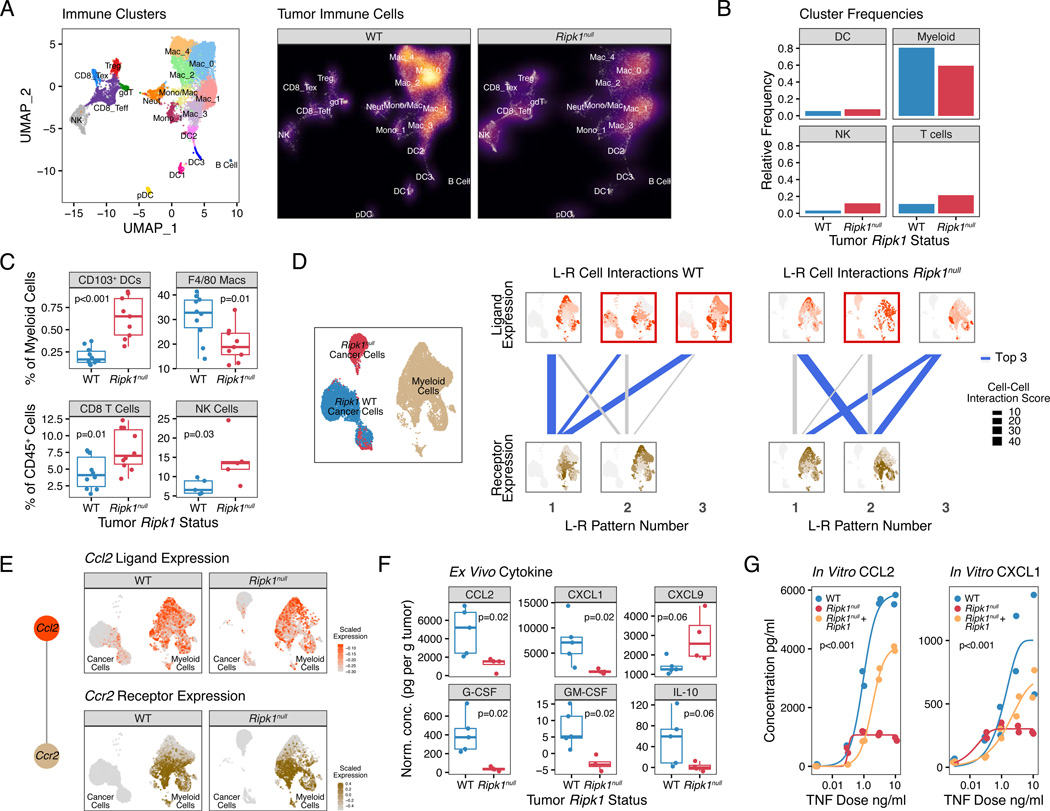
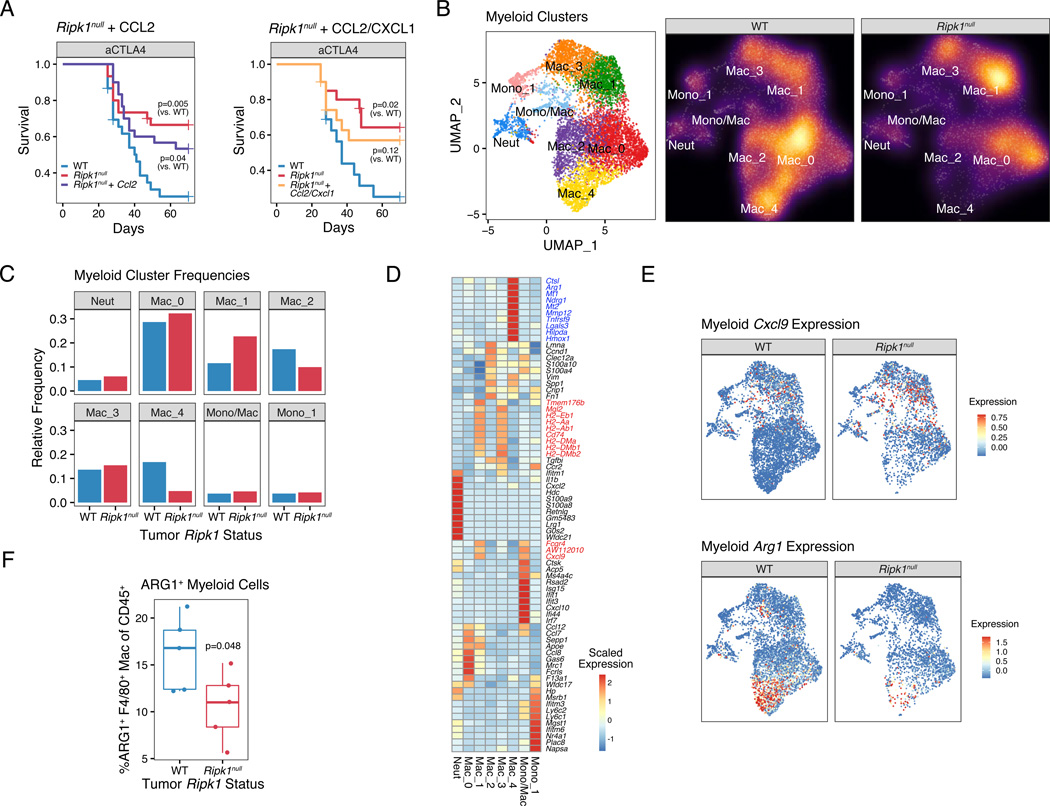
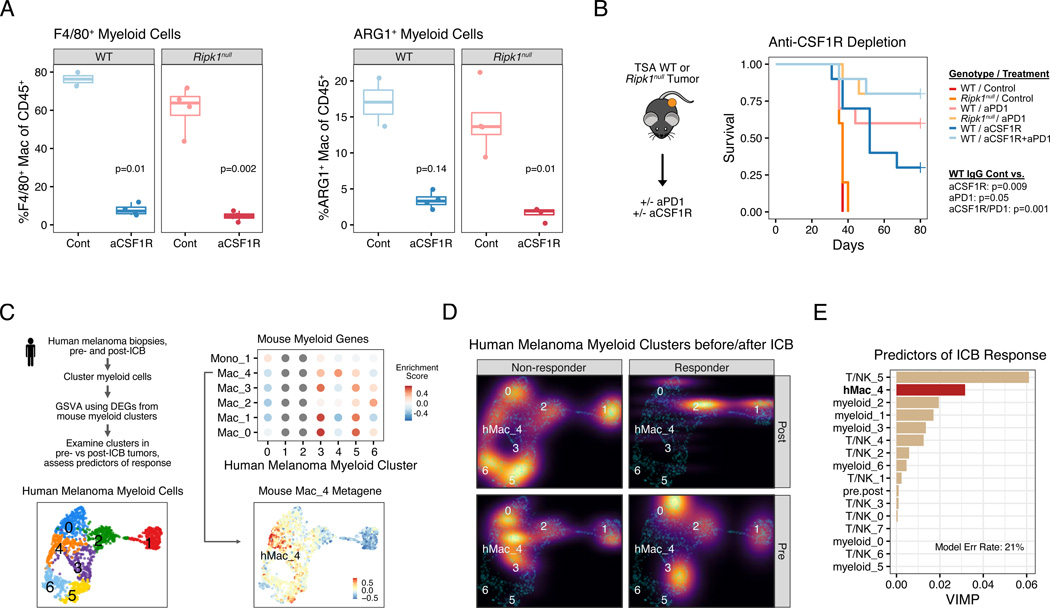
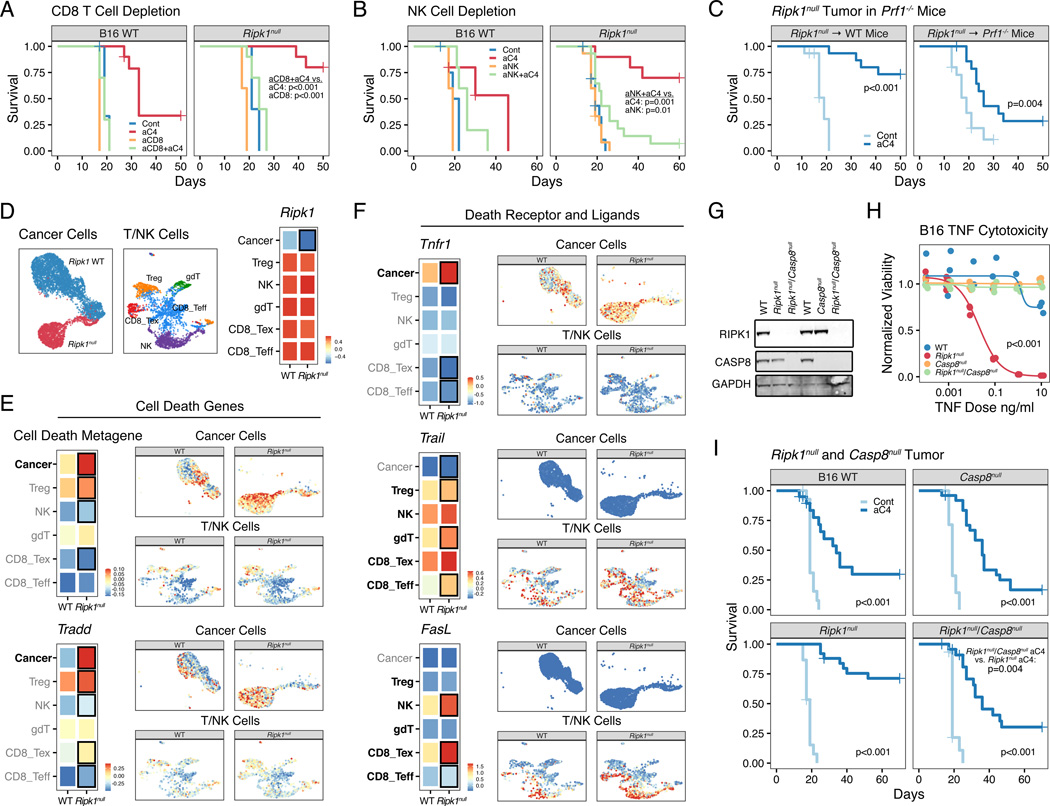
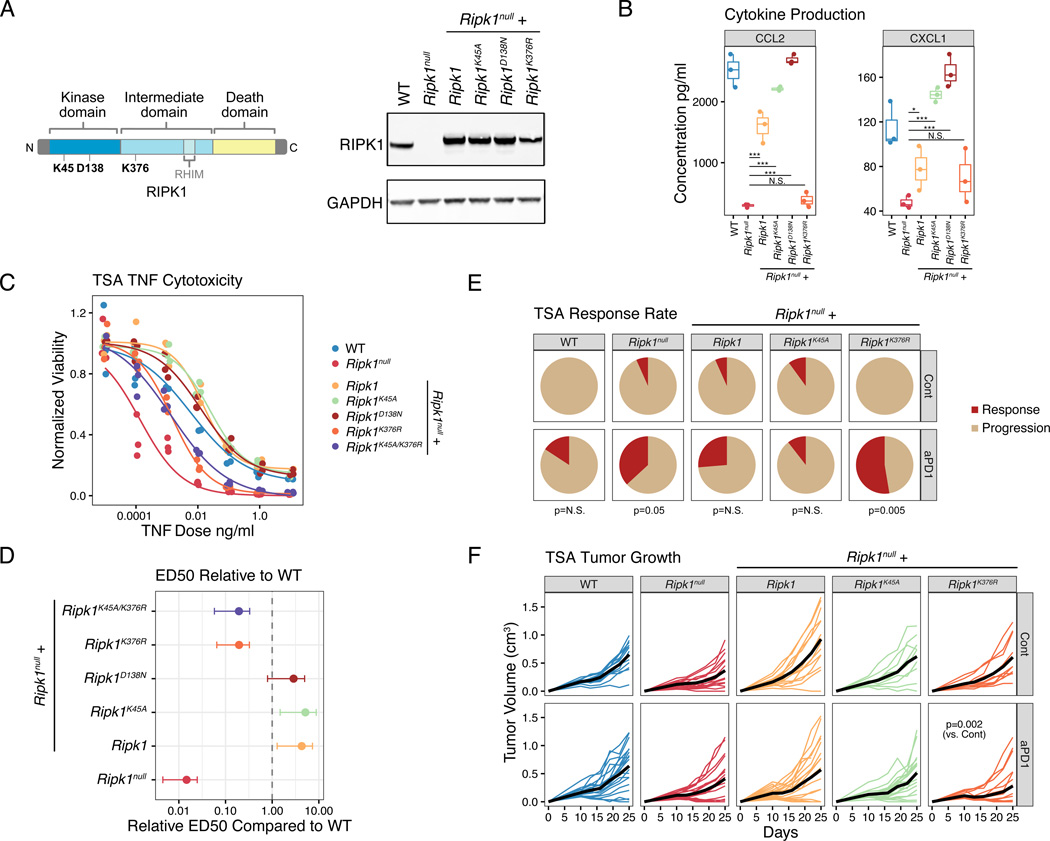
Interferon-gamma (IFN-γ) has pleiotropic effects on cancer immune checkpoint blockade (ICB), including roles in ICB resistance. We analyzed gene expression in ICB-sensitive versus ICB-resistant tumor cells and identified a strong association between interferon-mediated resistance and expression of Ripk1, a regulator of tumor necrosis factor (TNF) superfamily receptors. Genetic interaction screening revealed that in cancer cells, RIPK1 diverted TNF signaling through NF-κB and away from its role in cell death. This promoted an immunosuppressive chemokine program by cancer cells, enhanced cancer cell survival, and decreased infiltration of T and NK cells expressing TNF superfamily ligands. Deletion of RIPK1 in cancer cells compromised chemokine secretion, decreased ARG1+ suppressive myeloid cells linked to ICB failure in mice and humans, and improved ICB response driven by CASP8-killing and dependent on T and NK cells. RIPK1-mediated resistance required its ubiquitin scaffolding but not kinase function. Thus, cancer cells co-opt RIPK1 to promote cell-intrinsic and cell-extrinsic resistance to immunotherapy.


Conflict of interest statement

Declaration of interests A.J.M. has received research funding from Merck. He is a scientific advisor for Takeda, H3Biomedicine, Xilio, and Related Sciences. A.J.M. is an inventor on patents related to the IFN pathway and an inventor on a filed patent related to modified CAR T cells. A.J.M. is a scientific founder for Dispatch Biotherapeutics.

Figures

Figure 1.
Figure 1.. RIPK1 is an interferon stimulated gene that promotes resistance to cancer immune checkpoint blockade.
A. Gene set enrichment analysis (GSEA) of anti-PD1-based therapy resistance genes in untreated Res 499 melanoma cells vs. B16 parental cells (top left), Res 499 vs. Res 499 IFNGR + IFNAR deficient (bottom left), Res 499 IFNGR + IFNAR deficient vs. Res 499 IFNAR deficient (top right), or Res 499 IFNGR + IFNAR deficient vs Res 499 IFNGR deficient (bottom right). Cancer cells were sorted from in vivo tumors. Heatmaps for resistance genes most impacted by IFNGR or IFNAR deficiency are shown (leading edge genes) with blue indicating decreased expression. B. Protein expression of RIPK1 in TSA breast cancer cells treated with 100 ng/ml recombinant murine IFNG at indicated timepoints. C-D. Survival analysis of mice bearing Res 499 tumors (n=5–10, 1 independent experiment) (C) or B16 tumors (n=15–20, 3 independent experiments) (D) with gRNA control (WT) or RIPK1 CRISPR-mediated deletion (Ripk1null) and treated with or without anti-CTLA4 (aC4) +/− anti-PDL1 (aP1). E. Tumor growth curves of mice with control or Ripk1null TSA breast cancer tumors treated with or without anti-CTLA4 (aCTLA4) or anti-PD1 (aPD1) (n=5–10, 1 independent experiment). P-values indicate interaction between treatment and genotype (i.e., effect of treatment is influenced by genotype). F. Survival analysis of mice with WT or Ripk1null TSA tumors treated with or without anti-CTLA4 (n=15–30, 3 independent experiments). G-H. RIPK1 protein expression (G) and tumor growth curves (H) of empty vector expressing WT or Ripk1null TSA cells, or Ripk1null cells with ectopic WT Ripk1. Mice were treated with or without anti-CTLA4 (n=5–10, representative of 3 independent experiments). I. Association between RIPK1 copy number alterations (CNA) and mRNA expression (left) or progression-free survival (right) from pan-cancer TCGA patients (n=10,713). P-values for survival were determined by log-rank test. Mixed effect model was used for tumor growth analysis. For comparison between two groups, a two-sided Wilcoxon test was used for non-parametric data, and for multiple groups a Kruskal-Wallis test is used.
Figure 2.
Figure 2.. RIPK1 genetic deletion in cancer cells alters the balance between TNFRSF complex I and complex II signaling as revealed by in vivo CRISPR-Cas12a screen.
A. Experimental workflow for double-gene deletion AsCas12a CRISPR screening. B. Scatter plot of median Log2 fold-change of crRNAs associated with the indicated target gene after Cas12a-mediated co-deletion of Rosa26 control (WT) or Ripk1 (Ripk1null). Fold-change is calculated between in vitro and in vivo timepoints. Targets preferentially depleted in WT (red), Ripk1null (beige), or both (blue), or targets preferentially enriched in Ripk1null (orange) are highlighted and have a P-value < 0.05 (see Methods). Also shown are Log2 fold-change for individual crRNAs (red bars) for significant hits overlaid on the distribution for all crRNAs. C. Select targets identified in (B) projected onto a schematic of the TNF signaling pathway in Ripk1 WT (top) and Ripk1null (bottom) cancer cells. Highlighted gene targets (non-opaque) are depleted in WT or enriched in Ripk1null tumors and illustrate inferred signaling bias for each genotype. D-E. Expression and quantitation of NF-kB and MAPK pathway proteins (n=2–3) (D) and NF-kB transcriptional reporter activity (representative of 3 independent experiments) (E) in WT or Ripk1null B16 cancer cells after treatment with 100 ng/ml murine TNF. F. CASP3 cleavage after TNF stimulation of TSA WT or Ripk1null cells for the indicated times under serum-free conditions. G. In vitro dose response of TNF-mediated killing with 1 ug/ml cycloheximide for 24 hours for WT or Ripk1null B16 and TSA cells measured by normalized viability (representative of 2–3 independent experiments). P-values for time course was determined by repeated measures ANOVA. For dose response and reporter assay, a non-linear model was fitted and significance determined by comparison to a reduced model using ANOVA.
Figure 3.
Figure 3.. Deletion of RIPK1 in cancer cells results in changes in the tumor immune microenvironment and predicted chemokine-receptor interactions with myeloid cells.
A. UMAP of CD45+ immune cells from scRNA-seq of untreated TSA WT or Ripk1null tumors (n=2 for each). Each cluster is color-coded (left) and the density of cells in each cluster is shown (right). B. Frequency of immune cells from (A) grouped by major immune subtypes. C. Flow cytometric analysis of CD103+ DCs and F4/80+ macrophages (top), and CD8+ T cells and NKp46+ NK cells (bottom) (2 independent experiments). D. Patterns of interactions between ligand-expressing cells and receptor-expressing cells (L-R patterns) using cancer and myeloid populations (left UMAP) from WT and Ripk1null tumors. Top row visualizes ligand expression patterns (red) predicted to interact with receptor expression patterns (beige) that are visualized in the bottom row. Thickness of connecting lines denotes cell-cell interaction (CCI) score for the L-R patterns, and blue lines indicate L-R patterns having the top 3 CCI scores in WT or Ripk1null tumors. L-R patterns whereby the ligand-expressing cells include cancer cells are outlined by a red box (e.g., L-R pattern 2–1 and 3–1 in WT tumors). E. Expression of Ccl2 (top) and Ccr2 (bottom) in WT and Ripk1null tumors. Ccl2 and Ccr2 is the top ligand-receptor interaction pair from L-R pattern 3–1 from WT tumors shown in (D). F. Cytokine protein levels secreted ex vivo from TSA WT or Ripk1null tumor explants (representative of 2 independent experiments). G. TNF dose response for secretion of the indicated cytokines by WT or Ripk1null TSA cells transduced with empty vector, or Ripk1null cells ectopically expressing WT Ripk1 after in vitro stimulation for 48 hours. For comparison between two groups, a two-sided T-test or Wilcoxon test was used for parametric or non-parametric data, respectively. For dose response, a non-linear model was fitted and significance determined by comparison to a reduced model using ANOVA.
Figure 4.
Figure 4.. RIPK1 regulates the intra-tumoral accumulation of ARG1+ suppressive macrophages.
A. Survival of mice bearing TSA WT tumors, Ripk1null tumors, or Ripk1null tumors with ectopic expression of Ccl2 alone (left; n=10–20, 3 independent experiments) or Ccl2 and Cxcl1 (right; n=5–20, 2 independent experiments), treated with anti-CTLA4. B. UMAP of myeloid clusters from scRNA-seq of untreated TSA WT or Ripk1null tumors (n=2 for each). Each cluster is color-coded (left) and the density of cells in each cluster is shown (right). C. Frequency of cells in the myeloid clusters shown in (B). D. Expression of top 10 differentially expressed genes from each myeloid cluster. Select genes including genes from Mac_1 and Mac_4 clusters are highlighted in red and blue, respectively. E-F. Expression of Cxcl9 and Arg1 in myeloid cells (E) and flow cytometric analysis of ARG1+ F4/80+ macrophages (F) from WT or Ripk1null tumors. P-values for survival were determined by log-rank test. For comparison between two groups, a two-sided T-test or Wilcoxon test was used for parametric or non-parametric data, respectively.
Figure 5.
Figure 5.. ARG1+ suppressive macrophages predict clinical response to ICB and their loss through myeloid cell depletion phenocopies RIPK1 deletion.
A. Flow cytometric analysis of anti-CSF1R (aCSF1R) mediated depletion of F4/80+ macrophages (left) and ARG1+F4/80+ macrophages (right). B. Survival of mice bearing WT or Ripk1null TSA tumors treated with anti-CSF1R, anti-PD1 (aPD1), or both (n=5–10, 1 independent experiment). C. Schema for analyzing enrichment of genes from mouse myeloid clusters (see Figure 4B) in myeloid cells from human melanomas. Shown are UMAPs of myeloid clusters from human melanoma (bottom left), enrichment for differentially expressed genes from mouse myeloid clusters in each human myeloid cluster (top right), and the median expression of genes from mouse Mac_4 cluster overlaid on the human myeloid cluster UMAP (bottom right). D. Density plot of myeloid clusters from human melanoma from patients treated with anti-PD1 +/− anti-CTLA4. Plots are stratified by ICB response (columns) and pre- and post-ICB biopsies (rows). For presentation purposes, densities for each condition are overlaid on UMAP from (C) (cyan dots). E. Multivariable random forest model for probability of response for melanoma patients treated with anti-PD1 +/− anti-CTLA4. Shown are the variable importance scores, which represents the increase in classification error rate when the variable is perturbed, for each myeloid and T/NK clusters. The classification error rate for the model is 21%. For comparison between two groups, a two-sided T-test or Wilcoxon test was used for parametric or non-parametric data, respectively.
Figure 6.
Figure 6.. RIPK1 deletion sensitizes tumors to cell death by perforin-dependent and CASP8-dependent mechanisms
A-B. Survival of mice bearing B16 WT or Ripk1null tumors and depleted of either CD8 T cells (n=5–10, representative of 2 independent experiments) (A) or NK cells (n=5–15, 2 independent experiments) (B) and treated with or without anti-CTLA4 (aC4). Depletion was performed using an anti-CD8 (aCD8) or anti-NK1.1 (aNK) antibody. C. Survival of WT or Prf1−/− mice bearing Ripk1null B16 tumors and treated with or without anti-CTLA4 (n= 15, 2 independent experiments). D. UMAP of lymphocytes and cancer cells from scRNA-seq of untreated TSA WT or Ripk1null tumors (n=2 for each) (right). Expression of Ripk1 in cancer cells and in the indicated T and NK cell subsets is shown in the heatmap. Black box represents p<0.05 for comparison between WT and Ripk1null groups. E-F. Expression of a cell death metagene or Tradd (E) or of the indicated TNF superfamily receptor or ligand (F) in cancer or immune cells. Median expression in each cell population is shown in the heatmap (left), while per cell expression is overlaid on the UMAP from (D) but faceted by Ripk1 genotype and cell type (right). The cell death metagene is the average scaled expression of genes in the Hallmark apoptosis gene set. For the heatmap, cell types of interest for each comparison are highlighted in bold, and black boxes represent values with p<0.05 for comparison between WT and Ripk1null groups. Scale shows relative expression. G-H. Expression of the indicated proteins (G) and in vitro TNF dose response for normalized viability after treatment with TNF plus 1 ug/ml of cycloheximide for 24 hours (H) for WT B16 cells and B16 cells genetically deleted for Ripk1 (Ripk1null), Casp8 (Casp8null), and Ripk1 and Casp8 (Ripk1null/Casp8null). Data for WT and single Ripk1 deletion groups shown in (H) are from Fig. 2G and presented here to facilitate comparison. I. Survival of mice bearing B16 tumors with the indicated genotypes treated with or without antiCTLA4 (n=15–25, 3 independent experiments). P values for survival analysis were determined by log-rank test. For dose response, a non-linear model was fitted and significance determined by comparison to a reduced model using ANOVA.
Figure 7.
Figure 7.. RIPK1 scaffolding but not kinase domain is important for intrinsic and extrinsic resistance mechanisms to immune checkpoint blockade.
A. Schematic of the primary protein and domain structure of RIPK1 and position of various mutants (left). K45A and D138N are kinase dead, while K376R is a scaffolding dead mutant. Expression of RIPK1 protein in WT or Ripk1null TSA cells expressing an empty vector, WT Ripk1, or the indicated Ripk1 mutant (right). B. In vitro chemokine production at 48 hours after 10 ng/ml of TNF for WT TSA cells, Ripk1null TSA cells, or Ripk1null cells expressing the indicated Ripk1 mutants. C-D. In vitro dose response for TNF-mediated killing with 1 ug/ml of cycloheximide (C) for the indicated cell lines. The effective dose 50 (ED50) for 24-hour TNF-mediated killing relative to WT cells are also shown with 95% confidence intervals (D). E-F. Response rates (E) and tumor growth (F) of mice bearing the indicated TSA tumor and treated with or without anti-PD1 (n=10–19, 2 independent experiments). The p-values beneath the pie charts in (E) compare response rates with and without anti-PD1. For comparison between two groups, a two-sided T-test or Wilcoxon test was used for parametric or non-parametric data, respectively. Mixed effect model was used for tumor growth analysis.

Comment in

References

    1. Aaes TL, Kaczmarek A, Delvaeye T, De Craene B, De Koker S, Heyndrickx L, Delrue I, Taminau J, Wiernicki B, De Groote P, et al. (2016). Vaccination with Necroptotic Cancer Cells Induces Efficient Anti-tumor Immunity. Cell Rep. 15, 274–287. - PubMed
    1. Annibaldi A, and Meier P. (2018). Checkpoints in TNF-Induced Cell Death: Implications in Inflammation and Cancer. Trends Mol. Med. 24, 49–65. - PubMed
    1. Beck RJ, Slagter M, and Beltman JB (2019). Contact-Dependent Killing by Cytotoxic T Lymphocytes Is Insufficient for EL4 Tumor Regression In Vivo. Cancer Res. 79, 3406–3416. - PubMed
    1. Benci JL, Xu B, Qiu Y, Wu TJ, Dada H, Twyman-Saint Victor C, Cucolo L, Lee DSM, Pauken KE, Huang AC, et al. (2016). Tumor Interferon Signaling Regulates a Multigenic Resistance Program to Immune Checkpoint Blockade. Cell 167, 1540–1554.e12. - PMC - PubMed
    1. Benci JL, Johnson LR, Choa R, Xu Y, Qiu J, Zhou Z, Xu B, Ye D, Nathanson KL, June CH, et al. (2019). Opposing Functions of Interferon Coordinate Adaptive and Innate Immune Responses to Cancer Immune Checkpoint Blockade. Cell 178, 933–948.e14. - PMC - PubMed

MeSH terms